

Abstract
We have developed and implemented a sequence identification algorithm (inSeq) that processes tandem mass spectra in real-time using the mass spectrometer’s (MS) onboard processors. The inSeq algorithm relies on accurate mass tandem MS data for swift spectral matching with high accuracy. The instant spectral processing technology takes ∼16 ms to execute and provides information to enable autonomous, real-time decision making by the MS system. Using inSeq and its advanced decision tree logic, we demonstrate (i) real-time prediction of peptide elution windows en masse (∼3 min width, 3,000 targets), (ii) significant improvement of quantitative precision and accuracy (~3x boost in detected protein differences), and (iii) boosted rates of posttranslation modification site localization (90% agreement in real-time vs. offline localization rate and an approximate 25% gain in localized sites). The decision tree logic enabled by inSeq promises to circumvent problems with the conventional data-dependent acquisition paradigm and provides a direct route to streamlined and expedient targeted protein analysis.
Keywords: peptide scheduling, MS/MS, real-time analysis, electron-transfer dissociation, proteomics
The shotgun sequencing method has rapidly evolved over the past two decades (1, 2). In this strategy eluting peptide cations have their mass-to-charge (m/z) values measured in the MS1 scan. Then precursor m/z values are selected for a series of sequential tandem MS events (MS2). This succession is cycled for the duration of the analysis. The process, called data-dependent acquisition (DDA), is at the very core of shotgun analysis and has not changed for over 15 y, however, MS hardware has. Major improvements in MS sensitivity, scan rate, mass accuracy, and resolution have been achieved. Orbitrap hybrid systems, for example, routinely achieve low ppm mass accuracy with MS/MS repetition rates of 5–10 Hz (3, 4). Constant operation of such systems generates hundreds of thousands of spectra in hours. These MS2 spectra are then mapped to sequence using database search algorithms (5–7).
The DDA sampling strategy offers an elegant simplicity and has proven highly useful for discovery-driven proteomics. Of recent years, however, emphasis has shifted from identification to quantification-often with certain targets in mind. In this context, faults in the DDA approach have become increasingly evident. There are two primary limitations of the DDA approach: First, is poor run-to-run reproducibility and, second, is the inability to effectively target peptides of interest (8). Hundreds of peptides often coelute so that low-level signals often are selected in one run and not the next, and selecting m/z peaks to sequence by abundance certainly does not offer the opportunity to inform the system of preselected targets.
Several DDA add-ons and alternatives have been examined. Sampling depth, for example, can be increased by preventing selection of an m/z value identified in a prior technical replicate (PAnDA) (9). Irreproducibility can be somewhat countered by informing the DDA algorithm of the precursor m/z values of desired targets (inclusion list)—if observed, this can ensure their selection for MS2. Frequently, however, low abundance peptides may not have precursor signals above noise so that a MS2 scan, which is requisite for identification, is never triggered. This conundrum is avoided altogether in the data-independent acquisition approach (DIA) (10). Here, no attention is paid to precursor abundance or even presence; instead, consecutive m/z isolation windows are dissociated and mass analyzed. A main drawback of DIA is that it requires significantly more instrument analysis time as MS2 scans from every m/z window must be collected (11). As such, DDA analysis remains the preeminent method for MS data acquisition.
Besides improvements in MS analyzer performance, numerous alternative dissociation methods and scan types have recently advanced. These include collision, electron and photon-based fragmentation [i.e., High-Energy Collisional Dissociation (HCD), Electron-Transfer Dissociation (ETD), Infrared Multiphoton Dissociation, etc.], specialized quantification scans (i.e., QuantMode), or simply analysis using varied precursor ion targets, m/z accuracy, etc. (12–17). Each of these techniques shows applicability and superlative performance for a subset of peptide precursors. The result is a dizzying alphabet soup of techniques, scan types, and parameter space that is not easily integrated into the current data acquisition paradigm. Recently, we introduced a decision tree (DT) algorithm that used precursor m, z, and m/z to automatically determine, in real time, whether to employ CAD or ETD during MS2 (18). The approach significantly improved sequencing success rates and was an important step in a movement toward development of informed acquisition.
Here we describe the next advance in DT acquisition technology—instant sequence confirmation (inSeq). The inSeq algorithm processes MS2 spectra at the moment of collection using the MS system’s onboard processing power. With sequence in hand, the MS acquisition system can process this knowledge to make autonomous, real-time decisions about what type of scan to trigger next. Here, with the inSeq instant identification algorithm, we extend our simple DT method by adding several different decision nodes. These nodes enable automated functionalities including real-time elution prediction, advanced quantification, posttranslation modification (PTM) localization, large-scale targeted proteomics, and increased proteome coverage, among others. This technology provides a direct pathway to transform the current passive data collection paradigm. Specifically, knowing the identity of a peptide that is presently eluting into the MS system permits an ensemble of advanced automated decision-making logic.
Results
Instant Sequence Confirmation (inSeq).
To develop an advanced DT acquisition scheme that can seamlessly incorporate the myriad of specialized procedures and scans available on modern day MS systems, we must expedite the spectral analysis process—i.e., from offline to real-time. There are two obvious pathways to incorporate real-time spectral analysis within an MS system. The first approach exports spectra for processing with an external computing system followed by import of the search outcome (19). A second, more elegant strategy, is to perform all computation within the MS onboard computing system (20). The former approach circumvents complications in accessing instrument firmware and allows for the use of more sophisticated processing power; however, a serious constraint is the time required for import/export of the information (i.e., ∼40 ms). We have pursued technologies and computational algorithms that integrate real-time spectral analysis into the MS system’s onboard processors and firmware. We call this method inSeq. Experimental details (e.g., peptide candidates, scan sequences, etc.) are transferred on demand along with the instrument’s method file to the instrument before the experiment commences allowing for flexibility in experimental design with minimum configuration. To establish robustness across platforms, we implemented inSeq on two distinct MS systems (operating with different code bases)—a dual-cell, quadrupole, linear ion trap-Orbitrap hybrid (LTQ-Velos Orbitrap) and a quadrupole mass filter-Orbitrap hybrid (Q-Exactive). In both cases, we modified and extended the instrument firmware to quickly (∼ < 20 ms in the case of the more modern Q-Exactive system) and accurately [< 2% false discovery rate (FDR)] map MS/MS spectra to sequence. The embedded peptide database-matching algorithm processes MS/MS scans immediately (Fig. 1 A–B) by comparing product ions present in the MS/MS scan to those from peptide candidates preloaded onto the instrument’s firmware. Note the candidate sequences are first filtered so that only sequences whose mass is within a small window (e.g., 5–50 ppm) of the sampled precursor neutral mass are considered (Fig. 1C). For each candidate sequence the number of +1 product ions (+2 ions are included for precursors > +2) that matched the spectrum at a mass tolerance < 10 ppm is recorded (Fig. 1C). Next, it uses straightforward scoring metrics providing sufficient evidence for the confirmation of a putative sequence without burdening the system with nonessential calculations. On both MS platforms, the real-time confirmation algorithm was expediently executed and required no hardware modification taking an average of 16 ms to perform (Q-Exactive, Fig. S1). To confirm that this small overhead does not affect the overall duty cycle, we compared the number of MS/MS scans performed when inSeq was and was not operating (9,076 DDA vs. 8,908 DDA with inSeq, ∼1.6%). The number of MS1 scans for the peptide IVGIVSGELNNAAAK within its elution profile further demonstrates the negligible impact on duty cycle as 20 MS1 scans were taken with inSeq inactive as compared to 19 scans with inSeq active (Fig. S2).
Fig. 1.

Progression of the inSeq logic. (A) A nHPLC-MS/MS chromatogram at 48.35 min along with an MS2 scan (B) that was acquired at that time following dissociation of a +2 feature of m/z 737.86. Upon collection of the MS2 scan, inSeq groups all peptide candidates (in silico, n = 94) whose theoretical mass are within 30 ppm of the experimentally determined precursor neutral mass 1473.756 (C). Then inSeq performs in silico fragmentation to produce a theoretical product ion series for each of the 94 candidates and proceeds to compare each to the experimental spectrum (< 10 ppm mass accuracy). (D) Plot of inSeq identifications compared to conventional postacquisition searching. When > 6 fragment ions match, inSeq agrees (True Positive) > 98% of the time.
To characterize the inSeq algorithm, we performed a nHPLC-MS/MS experiment on tryptic peptides derived from human embryonic stem cells. A database consisting of all theoretical tryptic peptides (up to three missed cleavages, 6–50 in length) contained within the human proteome was uploaded to the instrument’s (Q-Exactive) onboard computer. A DDA method was employed and analysis proceeded as usual except following each MS/MS scan the inSeq algorithm was executed and the results logged. This manifest of instant identifications was then compared to those made postacquisition via traditional database searching at a 1% FDR (reverse-decoy method). We assumed the conventional postacquisition approach to represent the true answer and compared the number of correct instant spectral identifications as a function of matched product ions (Fig. 1D). From these data we conclude the detection of > 6 product ions at high mass accuracy (< 10 ppm) by the inSeq algorithm produces the correct sequence identification > 98% of the time. To determine the impact of inSeq on depth of protein coverage, we compared OMSSA identifications with inSeq identifications (species with > 6 matching peaks) (Fig. S3). Traditional postacquisition searching identified more peptides than inSeq (11,095 vs. 7,910, respectively) indicating strong initial performance but also room for further development of a more sophisticated real-time scoring algorithm.
The inSeq method represents a straightforward approach to correlate sequence to spectrum and is positioned to become an essential technology in transforming the current passive data collection paradigm. Specifically, learning the identity of a peptide that is presently eluting into the MS system permits an ensemble of advanced automated decision-making logic. These concepts build upon our previous development of the data-dependent DT method. There we embedded an onboard algorithm to make real-time decisions of which fragmentation method to engage based on precursor charge (z) and m/z. Here, with the inSeq instant identification algorithm, we extend our simple DT method by adding several different decision nodes (Fig. S4). These nodes enable automated functionalities including: real-time elution prediction, advanced quantification, PTM localization, large-scale targeted proteomics, and increased proteome coverage, among others (Fig. 1F).
Predicting Peptide Elution.
Liquid chromatography is the conventional approach to fractionate highly complex peptide mixtures prior to measurement by MS. The highest MS sensitivity is achieved when one tunes the MS system to detect a given target (i.e., execute MS/MS) regardless of its presence in the preceding MS1 event (i.e., selected reaction monitoring). SRM measurements deliver sensitivity and reproducibility at the cost of bandwidth. Specifically, if one does not know the elution time of a target, the duration of the nHPLC-MS/MS analysis must be dedicated to conditions for that specific entity. If elution times are known, then multiple SRM scan events can be programmed allowing for detection of multiple targets; however, chromatographic conditions must remain identical or the scheduled SRM elution windows will no longer align. Still, the bandwidth of that approach is low, ∼100 peptide targets per nHPLC-MS/MS analysis, and compiling such an experiment is highly laborious (21).
We surmised that inSeq could inform the MS system without human intervention, of which peptide targets are most likely to elute subsequently. Such capability could enable robust, large-scale targeting (> 500 per analysis) in an automated manner. Our approach relies upon relative peptide elution order and, consequently, bypasses the use of absolute retention times that shift depending on chromatographic conditions and are not directly portable from multiple disparate experiments. Peptide elution order can be obtained in two ways. First, discovery experiments can be employed to determine retention order by normalizing the measured retention time for each detected peptide sequence. Second, the relative hydrophobicity for any sequence can be theoretically determined using existing software (e.g., SSRCalc) (22–24). In our experience, experimentally determined retention order offers better precision, though it requires prior knowledge that may not be available. However, retention order is determined, the real-time confirmation algorithm maintains a rolling average of the calculated elution order (CEO—a number describing the relative elution order of a target peptide) so that target peptides having nearby CEOs are specifically pursued (Fig. 2B). Fig. 2 presents an overview of this approach. This example, 60.39 min into the chromatograph, highlights the last five inSeq identified peptides and their average CEO (26.926 a.u.). The onboard algorithm then computes an asymmetric CEO window (5 a.u., 24.926–29.926) that presents a short list of desired targets having CEOs within that range (Fig. 2C). With this information the MS system can trigger specialized MS2 scans specific to this refined target subset. Note that as targets are identified, the CEO window is dynamically adjusted so targets come into and out of the range precisely when they are eluting.
Fig. 2.
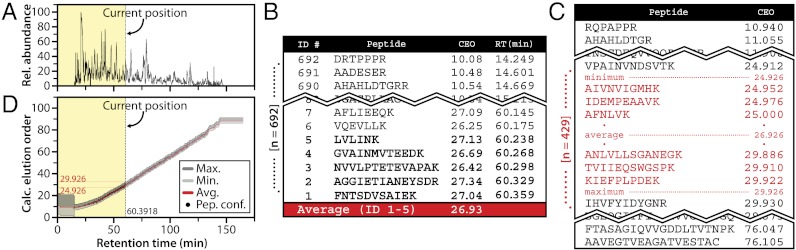
Elution order prediction using inSeq. (A) Experimental chromatogram, 60.39 min into a 120-min gradient obtained while inSeq was recording instant identifications. (B) The inSeq CEO obtained by averaging the CEOs of the preceding five instantly identified peptides. (C) The asymmetric window (5 a.u.) surrounding the instant CEO average (μ = 26.926) and their corresponding sequences. (D) This analysis is repeated following each new peptide confirmation to realign the CEO window constantly based on current chromatographic conditions.
To test this technology, we performed a DDA nHPLC-MS/MS experiment where tryptic peptides from a human ES cell sample were separated over a 60-min gradient. Following data collection, the resulting MS/MS spectra were mapped to sequence using database searching (1% FDR). The unique peptide identifications (4,237) were sorted by observed retention time—this ordering then served as the CEO. Three thousand of these peptides were randomly selected as “targets” and loaded onto the instrument firmware (Velos-Orbitrap), along with their respective CEO, as a database for inSeq. The sample was then reanalyzed with inSeq activated but with a doubled gradient length (120 min). Fig. 2D displays the CEO window as calculated in real-time by the MS system (inSeq) plotted beside the actual elution time of identified peptides. Greater than 95% of the peptides (2,889) fell within the rolling CEO window and were identified by inSeq and postacquisition searching. At our present capability we can achieve window widths similar to those used in absolute scheduling type experiments (∼3–6 min) on a scale that is 30x larger (e.g., 3,000 targets vs. 100) with minimal effort (21, 25). Furthermore, we demonstrate that our approach adapts to different chromatographic conditions with no negative effects (Fig. 2D). The key to the high portability and simplicity of our algorithm is the use of inSeq for continual, real-time realignment.
Improvement of Quantitative Accuracy.
The method of stable isotope labeling has greatly propelled large-scale, quantitative analysis (26–31). While generally robust, these techniques can yield spotty data for certain peptide and protein groups—mainly those present at low abundances. For SILAC, low signal-to-noise (S/N) precursor peaks in the MS1 scan often result in omission of that particular feature or quantitative imprecision, if included (32). For isobaric tagging, low intensity reporter ion signals (MS2) induce similar shortcomings (33). We surmised that inSeq could be employed to counter these limitations.
First, we developed an inSeq module to improve the quality of isobaric label-based measurements. The module analyzes MS2 spectra using inSeq and, when a peptide of interest is detected, the quality of quantitative data is assessed. Should the reporter ion signal fall below a specified threshold, inSeq triggers follow-up scans to generate increased signal at the very instant the target peptide is eluting. In one implementation, we instructed inSeq to automatically trigger three quantitative scans using the recently developed QuantMode (QM) method to generate superior quality quantitative data on targets of high value (17). The trio of QM scans are then summed offline.
To assess this decision node, we analyzed a sample comprising three biological replicates of human embryonic stem cells pre- and 2 d post bone morphogenetic protein 4 (BMP4) treatment (i.e., TMT 6-plex, three pretreatment and three post BMP4 treatment cell populations). BMP4, a growth factor that induces context-dependent differentiation in pluripotent stem cells, is widely used to study differentiation to biologically relevant cell lineages such as mesoderm and endoderm (34–36). Whenever a target peptide was identified by inSeq, three QM scans were immediately executed. This ensured that all identified peptides had the same number of quantitation scans enabling a direct comparison for analyzing multiple QM scans within this experiment. Fig. 3A demonstrates the benefit of summing isobaric tag intensities from one, two, or three consecutive quantitation scans for an inSeq identified target peptide having the sequence FCADHPFLFFIR from the protein SERPINB8. Here the ratio of change between control and treatment cell lines measured in one QM scan is large (5.86) but not significant (P = 0.067, Student’s t test with Storey correction) (37). Note significance testing was accomplished by assessing variation within the three biological replicates of treatment and control cell lines. The measured ratio remains relatively unchanged (5.22 and 5.43) as reporter tag signal from additional quantitation scans are added; however, the corresponding P values decrease to 0.014 and 0.012 when two or three quantitation scans are summed. By plotting the log 2 ratio of quantified proteins from the three biological replicates against the average intensity of isobaric labels (Fig. 3B), we demonstrate this improved significance results from boosted reporter S/N. Ideally, this log 2 ratio would be zero indicating perfect biological replication; however, when only one quantitation scan is employed, this ratio severely deviates from zero with decreasing tag intensity. To improve overall data quality and to omit potentially erroneous measurements, we and others employ arbitrary reporter signal cutoffs (dashed vertical line in Fig. 3B). Summation of additional quantitation scans increases the average reporter tag intensity raising nearly all of the protein measurements above the intensity cutoff value (74, 9, and four proteins omitted using one, two, and three quantification scans, respectively). This quantification decision node also increased the number of proteins within 25% of perfect biological replication (horizontal dashed line).
Fig. 3.

Improved quantitative outcomes using inSeq in isobaric tagging. An inSeq decision node was written to so that a real-time identification of a target sequence prompted automatic acquisition of three consecutive QuantMode (QM) scans. (A) Summing the reporter ion tag intensity from one, two, or three QM scans greatly improves the statistical significance of the measurement. (B) Summation of QM technical replicates reduces the variation in biological replicate measurement by increasing reporter ion S/N. (C) QM-triggered scans by inSeq increase the number of significantly changing proteins from 28 to 91.
To determine if the method could improve the number of statistically significant differences between the cell populations, we calculated the log 2 ratio of treated vs. control (i.e., 2 d/0 d) for each of the 596 quantified proteins (P < 0.05, Student’s t test with Storey correction, Fig. 3C). Only 28 proteins display significant change when one QM scan is used. By simply adding the reporter tag signal from additional scans the number of significantly changing proteins increases nearly threefold from 28 to 91 when all three QM scans are analyzed together.
Many stable isotope incorporation techniques measure heavy and light peptide pairs in MS1 (e.g., SILAC). This approach, of course, requires the detection of both partners. Note, low abundance peptides are often identified with low, or no, precursor signal in the MS1. We supposed that addition of another inSeq decision node could circumvent this problem. We cultured human embryonic stem cells in light and heavy media. Protein extract from these cultures was mixed 5∶1 (light:heavy) before digestion overnight with LysC. The SILAC node was developed to select precursors from an MS1 scan only if the monoisotopic mass was within 30 ppm of any target on a list that contained 4,000 heavy and light peptides from a previous discovery run. Targets were selected only if the SILAC ratio deviated from the expected ratio of 5 by 25%, i.e., the subset containing the most error. Following MS/MS, the resulting spectra were analyzed using inSeq. When a target of interest was identified, inSeq instructed the system to record immediately a SIM scan surrounding the light/heavy pair with a small, charge-dependent isolation window (∼8–10 Th).
The average ratio of the light and heavy peptides subtly, but significantly, shifted from 4.47 under normal analysis to 5.34 for the inSeq triggered SIM scans (Student’s t test, p value < 6 × 10-20). More importantly, the number of useable measurements, i.e., when both partners of the pair are observed, increased by ∼20% (2,887 under normal analysis to 3,548 with inSeq, Fig. S5A). Fig. S5B displays an example of the inSeq-triggered SIM scan and the increase in S/N and accuracy it affords. Here, the MS/MS scan of the light partner was mapped, in real-time to the sequence IEELDQENEAALENGIK. This event triggered a high-resolution SIM scan (8 Th window) that led to the ratio of 4.99∶1 (correct ratio 5∶1). Here, gas phase enrichment was essential to quantify the relative abundance as the isotopic envelope of the heavy partner was not observed even with extensive spectral averaging of successive MS1 scans (∼30 s, Fig. S5B). Whether for MS1 or MS2 centric methods, we conclude that inSeq technology will significantly improve the quality of quantitative data with only a minimal impact on duty cycle.
Posttranslational Modification Site Localization.
The presence of PTMs on proteins plays a major role in cellular function and signaling. Unambiguous localization of PTMs to residues demands observation of product ions resulting from cleavage of the residues adjacent to the site of modification, i.e., site-determining fragments (SDFs). In a typical analysis, only about half of the identified phosphorylation sites can be mapped with single amino acid resolution stymying systems-level data analysis. We reasoned that inSeq could be leveraged to boost PTM localization rates by dynamically modifying MS2 acquisition conditions when necessary. As such, we developed an online PTM localization decision node to determine, within milliseconds, whether a MS/MS spectrum contains SDFs to localize unambiguously the PTM. Should SDFs be lacking, inSeq instantly orchestrates further interrogation.
The PTM localization node is engaged when inSeq confirms the detection of a PTM-bearing peptide. After the sequence is confirmed, inSeq assesses the confidence with which the PTM(s) can be localized to a particular amino acid residue. This procedure is accomplished by computing an online probability score similar to postacquisition PTM localization software—i.e., AScore (38). Briefly, inSeq compares all possible peptide isoforms against the MS/MS spectrum. For each SDF, the number of matches at < 10 ppm tolerance is counted, and an AScore is calculated (inSeq uses similar math). If the AScore of the best fitting isoform is above 13 (p < 0.05), the PTM is declared localized. When the AScore is below 13, however, inSeq triggers further characterization of the eluting precursor until the site has been deemed localized or all decision nodes have been exhausted. Additional characterization can include many procedures such as acquisition of MS/MS spectra using different fragmentation methods (e.g., CAD, HCD, ETD, PD, etc.), varied fragmentation conditions (e.g., collision energy, reaction time, laser fluence, etc.), increased spectral averaging, MSn, pseudo MSn, modified dynamic exclusion, and altered automatic gain control target values among others (39).
To obtain proof-of-concept results, we wrote a simple inSeq node that triggered an ETD MS/MS scan of phosphopeptides that were not localized following HCD MS2. In one example (Fig. 4), the sequence, RNSSEASSGDFLDLK was confirmed to contain a phosphoryl group; however, the inSeq algorithm could not confidently localize the PTM to any of the four Ser residues (AScore = 0). Next, inSeq triggered an ETD MS2 scan of the same precursor (Fig. 4B). The resulting spectrum was then analyzed for the presence of the SDFs,  . Both of these fragments were present and the site was localized to Ser 3 with an AScore of 31.0129 (p < 0.00079). Postacquisition analysis confirmed the results of our online inSeq approach—both spectra (HCD and ETD) were confidently identified, and their calculated AScores were 0 and 45.58, respectively. When compared on a global scale, 993 of the 1,134 inSeq-identified phosphopeptides had localization judgments that matched postacquisition AScore analysis (Fig. 4). This slight difference is the result of using different localization algorithms for online and postacquisition analysis. Primarily, the postacquisition method considers fragment ions on either side of the site-determining fragments separately, whereas the inSeq method does not perform this extra step for simplicity (30, 38). These data demonstrate that our localization node is highly effective at instantaneously determining whether a PTM site can be localized. Unfortunately, only marginal gains were achieved in this basic implementation as most precursors were doubly charged and, therefore, not effectively sequenced by ETD. Next, we modified the inSeq decision node to incorporate a dissociation method DT. Here a follow-up ETD or combination ion trap CAD/HCD scan was triggered depending upon precursor charge (z) and m/z. With the slightly evolved algorithm, the inSeq method detected 998 phosphopeptides in a single shotgun experiment. It determined that 324 of these identifications lacked the information to localize the PTM site and, in those cases, triggered the new dissociation decision node. Seventy-eight of these unlocalizable sites were confidently mapped with this technique—salvaging nearly 25% of the unlocalized sites (Fig. 4D). These encouraging results demonstrate that inSeq has great promise to curtail the problem of PTM localization in a highly automated fashion. We note there are dozens of parameters to explore in the continued advancement of this PTM localization decision node.
Fig. 4.

PTM localization rates increase with inSeq. Following MS2 (HCD) of the singly phosphorylated precursor RNsSEASSGDFLDLK, inSeq could not find sufficient information to confidently localize the modification to either Ser 3 or 4 (A, AScore = 0). An ETD MS2 scan event is immediately triggered by inSeq on the same precursor (B). This spectrum was assigned an AScore of 31.0129 (phosphorylation on Ser3) and was considered confidently localized—note the SDFs c3 and  ions. (C) Globally, the inSeq localization calculation agreed with offline analysis using the actual AScore algorithm. (D) Using a simple dissociation method DT, inSeq produced a confidently localized phosphorylation site for 78 of 324 unlocalizable sites.
Discussion
Here we describe an instant sequencing algorithm (inSeq) that operates using the preexisting processors of the MS. Rapid real-time sequencing affords several data acquisition opportunities. To orchestrate these opportunities, we constructed an advanced decision tree logic that extends our earlier use of the method to intelligently select dissociation type. The approach can circumvent long-standing problems with the conventional DDA paradigm. We provide three such examples herein. First, we demonstrate that knowledge of which peptide sequences are eluting can facilitate the prediction of soon-to-elute targets. This method shows strong promise to revolutionize the way in which targeted proteomics is conducted. Second, we used quantitative decision nodes that fired when inSeq detected a peptide sequence of interest. With SILAC or isobaric tagging, significant gains in quantitative outcomes were documented. Third, we endowed inSeq with an instant PTM site-localization algorithm to determine whether or not to initiate more rigorous follow-up at the very instant the peptide of interest was eluting. We show that the inSeq site localizer is highly effective (90% agreement with postacquisition analysis) and that triggering a simple dissociation method DT can improve site localization by ∼25%. Further development will doubtless deliver additional gains.
Targeted proteomics is an area of increasing importance. Following discovery analysis it is natural to cull the list of several thousand detected proteins to several hundred key players. In an ideal world, these key proteins are then monitored in dozens or even hundreds of samples with high sensitivity and reproducibility without rigorous method development and can be expediently performed. We envision that advanced DT analysis with inSeq could offer such a platform. Using the retention time prediction algorithm we introduced here, one can foresee the inSeq algorithm quickly and precisely monitoring hundreds of peptides without the extensive labor and preplanning required by the selected reaction monitoring (SRM) technique, current state-of-the-art (40). Other possibilities include automated pathway analysis where user-defined proteins within a collection of pathways are simply uploaded to the MS system. Then, inSeq automatically determines the best peptides to track their retention times and constructs the method. Two key advantages over current SRM technology make this operation possible. First, knowledge of specific fragmentation transitions is not necessary as all products are monitored with high mass accuracy. Second, precise elution time scheduling is not necessary as inSeq can use CEO, experimental or theoretical, to dynamically adjust the predicted elution of targets. In this fashion the most tedious components of the SRM workflow can be avoided.
Materials and Methods
Cell Culture, Cell Lysis, Digestion, Isobaric Labeling, and Phosphopeptide Enrichment.
For all experiments, cells were lysed by sonication, protein extracted, and digested by LysC or LysC/Trypsin before desalting. For isobaric-labeled experiments, peptides were labeled, mixed, and desalted before nHPLC-MS/MS analysis. For phosphopeptide experiments, phosphopeptides were enriched via immobilized metal affinity chromatography. Further details are provided in SI Text.
inSeq Configuration, nHPLC, MS, Database Searching, Phosphosite Localization, and Peptide and Protein Quantification.
All experiments were performed on LTQ Orbitrap Velos and Q-Exactive mass spectrometers (Thermo Fisher Scientific). All MS/MS spectra were searched using OMSSA (Open Mass Spectrometry Search Algorithm). Peptide FDR, protein FDR, and peptide and protein quantification using isobaric labels was performed using Coon OMSSA Proteomics Analysis Software Suite. Phosphosite localization and SILAC quantitation was performed using in-house software. Additional details are provided in the SI Text.
Supplementary Material
Acknowledgments.
We thank Steve Gygi for assistance in analyzing the SILAC datasets and A.J. Bureta for figure illustrations. We also thank Jae Schwartz, John Syka, Mike Senko, and Jens Griep-Raming for helpful discussions. This work was funded by the grants from the National Institutes of Health (NIH) (GM081629 and HG004952), the National Science Foundation (NSF) (DBI-0701846), and Thermo Fisher Scientific. J.B. was funded by an NSF Graduate Research Fellowship and NIH traineeship (5T32GM08349). C.M.R. was also funded by an NSF Graduate Research Fellowship and NIH Traineeship (T32GM008505).
Footnotes
The authors declare no conflict of interest.
This article contains supporting information online at www.pnas.org/lookup/suppl/doi:10.1073/pnas.1205292109/-/DCSupplemental.
References
- 1.Washburn MP, Wolters D, Yates JR. Large-scale analysis of the yeast proteome by multidimensional protein identification technology. Nat Biotechnol. 2001;19:242–247. doi: 10.1038/85686. [DOI] [PubMed] [Google Scholar]
- 2.Nilsson T, et al. Mass spectrometry in high-throughput proteomics: ready for the big time. Nat Methods. 2010;7:681–685. doi: 10.1038/nmeth0910-681. [DOI] [PubMed] [Google Scholar]
- 3.Wenger CD, McAlister GC, Xia QW, Coon JJ. Sub-part-per-million Precursor and Product Mass Accuracy for High-throughput Proteomics on an Electron Transfer Dissociation-enabled Orbitrap Mass Spectrometer. Mol Cell Proteomics. 2010;9:754–763. doi: 10.1074/mcp.M900541-MCP200. [DOI] [PMC free article] [PubMed] [Google Scholar]
- 4.Michalski A, et al. Mass spectrometry-based proteomics using Q Exactive, a high-performance benchtop quadrupole orbitrap mass spectrometer. Mol Cell Proteomics. 2011;10:M111 011015. doi: 10.1074/mcp.M111.011015. [DOI] [PMC free article] [PubMed] [Google Scholar]
- 5.Eng JK, Mccormack AL, Yates JR. An approach to correlate tandem mass-spectral data of peptides with amino-acid-sequences in a protein database. J Am Soc Mass Spectr. 1994;5:976–989. doi: 10.1016/1044-0305(94)80016-2. [DOI] [PubMed] [Google Scholar]
- 6.Perkins DN, Pappin DJC, Creasy DM, Cottrell JS. Probability-based protein identification by searching sequence databases using mass spectrometry data. Electrophoresis. 1999;20:3551–3567. doi: 10.1002/(SICI)1522-2683(19991201)20:18<3551::AID-ELPS3551>3.0.CO;2-2. [DOI] [PubMed] [Google Scholar]
- 7.Geer LY, et al. Open mass spectrometry search algorithm. J Proteome Res. 2004;3:958–964. doi: 10.1021/pr0499491. [DOI] [PubMed] [Google Scholar]
- 8.Liu HB, Sadygov RG, Yates JR. A model for random sampling and estimation of relative protein abundance in shotgun proteomics. Anal Chem. 2004;76:4193–4201. doi: 10.1021/ac0498563. [DOI] [PubMed] [Google Scholar]
- 9.Hoopmann MR, Merrihew GE, von Haller PD, MacCoss MJ. Post analysis data acquisition for the iterative MS/MS sampling of proteomics mixtures. J Proteome Res. 2009;8:1870–1875. doi: 10.1021/pr800828p. [DOI] [PMC free article] [PubMed] [Google Scholar]
- 10.Venable JD, Dong MQ, Wohlschlegel J, Dillin A, Yates JR. Automated approach for quantitative analysis of complex peptide mixtures from tandem mass spectra. Nat Methods. 2004;1:39–45. doi: 10.1038/nmeth705. [DOI] [PubMed] [Google Scholar]
- 11.Panchaud A, et al. Precursor acquisition independent from ion count: how to dive deeper into the proteomics ocean. Anal Chem. 2009;81:6481–6488. doi: 10.1021/ac900888s. [DOI] [PMC free article] [PubMed] [Google Scholar]
- 12.McAlister GC, Phanstiel DH, Brumbaugh J, Westphall MS, Coon JJ. Higher-energy collision-activated dissociation without a dedicated collision cell. Mol Cell Proteomics. 2011;10:o111 009456. doi: 10.1074/mcp.O111.009456. [DOI] [PMC free article] [PubMed] [Google Scholar]
- 13.Olsen JV, et al. Higher-energy C-trap dissociation for peptide modification analysis. Nat Methods. 2007;4:709–712. doi: 10.1038/nmeth1060. [DOI] [PubMed] [Google Scholar]
- 14.Syka JEP, Coon JJ, Schroeder MJ, Shabanowitz J, Hunt DF. Peptide and protein sequence analysis by electron transfer dissociation mass spectrometry. Proc Natl Acad Sci USA. 2004;101:9528–9533. doi: 10.1073/pnas.0402700101. [DOI] [PMC free article] [PubMed] [Google Scholar]
- 15.Little DP, Speir JP, Senko MW, Oconnor PB, Mclafferty FW. Infrared multiphoton dissociation of large multiply-charged ions for biomolecule sequencing. Anal Chem. 1994;66:2809–2815. doi: 10.1021/ac00090a004. [DOI] [PubMed] [Google Scholar]
- 16.Olsen JV, Mann M. Improved peptide identification in proteomics by two consecutive stages of mass spectrometric fragmentation. Proc Natl Acad Sci USA. 2004;101:13417–13422. doi: 10.1073/pnas.0405549101. [DOI] [PMC free article] [PubMed] [Google Scholar]
- 17.Wenger CD, et al. Gas-phase purification enables accurate, multiplexed proteome quantification with isobaric tagging. Nat Methods. 2011;8:933–935. doi: 10.1038/nmeth.1716. [DOI] [PMC free article] [PubMed] [Google Scholar]
- 18.Swaney DL, McAlister GC, Coon JJ. Decision tree-driven tandem mass spectrometry for shotgun proteomics. Nat Methods. 2008;5:959–964. doi: 10.1038/nmeth.1260. [DOI] [PMC free article] [PubMed] [Google Scholar]
- 19.Graumann J, Scheltema RA, Zhang Y, Cox J, Mann M. A framework for intelligent data acquisition and real-time database searching for shotgun proteomics. Mol Cell Proteomics. 2011;11:M111 013185. doi: 10.1074/mcp.M111.013185. [DOI] [PMC free article] [PubMed] [Google Scholar]
- 20.Bailey DJ, et al. How High Mass Accuracy Measurements Will Transform Targeted Proteomics; Proceedings of the 59th ASMS Conference on Mass Spectrometry and Allied Topics; Denver, CO: ASMS; 2011. ThOE:278. [Google Scholar]
- 21.Yan W, et al. Index-ion triggered MS2 ion quantification: a novel proteomics approach for reproducible detection and quantification of targeted proteins in complex mixtures. Mol Cell Proteomics. 2011;10:M110 005611. doi: 10.1074/mcp.M110.005611. [DOI] [PMC free article] [PubMed] [Google Scholar]
- 22.Krokhin OV, et al. An improved model for prediction of retention times of tryptic peptides in ion pair reversed-phase HPLC—Its application to protein peptide mapping by off-line HPLC-MALDI MS. Mol Cell Proteomics. 2004;3:908–919. doi: 10.1074/mcp.M400031-MCP200. [DOI] [PubMed] [Google Scholar]
- 23.Krokhin OV. Sequence-specific retention calculator Algorithm for peptide retention prediction in ion-pair RP-HPLC: Application to 300-and 100-angstrom pore size C18 sorbents. Anal Chem. 2006;78:7785–7795. doi: 10.1021/ac060777w. [DOI] [PubMed] [Google Scholar]
- 24.Kiyonami R, et al. Increased selectivity, analytical precision, and throughput in targeted proteomics. Mol Cell Proteomics. 2011;10:M110 002931. doi: 10.1074/mcp.M110.002931. [DOI] [PMC free article] [PubMed] [Google Scholar]
- 25.Schmidt A, et al. An Integrated, Directed Mass Spectrometric Approach for In-depth Characterization of Complex Peptide Mixtures. Mol Cell Proteomics. 2008;7:2138–2150. doi: 10.1074/mcp.M700498-MCP200. [DOI] [PMC free article] [PubMed] [Google Scholar]
- 26.Gruhler A, et al. Quantitative phosphoproteomics applied to the yeast pheromone signaling pathway. Mol Cell Proteomics. 2005;4:310–327. doi: 10.1074/mcp.M400219-MCP200. [DOI] [PubMed] [Google Scholar]
- 27.Choe L, et al. 8-Plex quantitation of changes in cerebrospinal fluid protein expression in subjects undergoing intravenous immunoglobulin treatment for Alzheimer’s disease. Proteomics. 2007;7:3651–3660. doi: 10.1002/pmic.200700316. [DOI] [PMC free article] [PubMed] [Google Scholar]
- 28.de Godoy LMF, et al. Comprehensive mass-spectrometry-based proteome quantification of haploid versus diploid yeast. Nature. 2008;455:1251–U1260. doi: 10.1038/nature07341. [DOI] [PubMed] [Google Scholar]
- 29.Xiao KH, et al. Global phosphorylation analysis of beta-arrestin-mediated signaling downstream of a seven transmembrane receptor (7TMR) Proc Natl Acad Sci USA. 2010;107:15299–15304. doi: 10.1073/pnas.1008461107. [DOI] [PMC free article] [PubMed] [Google Scholar]
- 30.Phanstiel DH, et al. Proteomic and phosphoproteomic comparison of human ES and iPS cells. Nat Methods. 2011;8:821–U884. doi: 10.1038/nmeth.1699. [DOI] [PMC free article] [PubMed] [Google Scholar]
- 31.Lee MV, et al. A dynamic model of proteome changes reveals new roles for transcript alteration in yeast. Mol Syst Biol. 2011;7:514. doi: 10.1038/msb.2011.48. [DOI] [PMC free article] [PubMed] [Google Scholar]
- 32.Bakalarski CE, et al. The impact of peptide abundance and dynamic range on stable-isotope-based quantitative proteomic analyses. J Proteome Res. 2008;7:4756–4765. doi: 10.1021/pr800333e. [DOI] [PMC free article] [PubMed] [Google Scholar]
- 33.Zhang Y, et al. A robust error model for iTRAQ quantification reveals divergent signaling between oncogenic FLT3 mutants in acute myeloid leukemia. Mol Cell Proteomics. 2010;9:780–790. doi: 10.1074/mcp.M900452-MCP200. [DOI] [PMC free article] [PubMed] [Google Scholar]
- 34.Lengerke C, et al. BMP and Wnt specify hematopoietic fate by activation of the Cdx-Hox pathway. Cell Stem Cell. 2008;2:72–82. doi: 10.1016/j.stem.2007.10.022. [DOI] [PubMed] [Google Scholar]
- 35.Yang L, et al. Human cardiovascular progenitor cells develop from a KDR plus embryonic-stem-cell-derived population. Nature. 2008;453:524–U526. doi: 10.1038/nature06894. [DOI] [PubMed] [Google Scholar]
- 36.Yu PZ, Pan GJ, Yu JY, Thomson JA. FGF2 Sustains NANOG and switches the outcome of BMP4-induced human embryonic stem cell differentiation. Cell Stem Cell. 2011;8:326–334. doi: 10.1016/j.stem.2011.01.001. [DOI] [PMC free article] [PubMed] [Google Scholar]
- 37.Storey JD, Tibshirani R. Statistical significance for genomewide studies. Proc Natl Acad Sci USA. 2003;100:9440–9445. doi: 10.1073/pnas.1530509100. [DOI] [PMC free article] [PubMed] [Google Scholar]
- 38.Beausoleil SA, Villen J, Gerber SA, Rush J, Gygi SP. A probability-based approach for high-throughput protein phosphorylation analysis and site localization. Nat Biotechnol. 2006;24:1285–1292. doi: 10.1038/nbt1240. [DOI] [PubMed] [Google Scholar]
- 39.Schroeder MJ, Shabanowitz J, Schwartz JC, Hunt DF, Coon JJ. A neutral loss activation method for improved phosphopeptide sequence analysis by quadrupole ion trap mass spectrometry. Anal Chem. 2004;76:3590–3598. doi: 10.1021/ac0497104. [DOI] [PubMed] [Google Scholar]
- 40.Picotti P, et al. High-throughput generation of selected reaction-monitoring assays for proteins and proteomes. Nat Methods. 2009;7:43–U45. doi: 10.1038/nmeth.1408. [DOI] [PubMed] [Google Scholar]
Associated Data
This section collects any data citations, data availability statements, or supplementary materials included in this article.