Abstract
This paper presents a two-stream microfluidic system for transporting cells or micro-sized particles from one fluid stream to another by acoustophoresis. The two fluid streams, one being the original suspension and the other being the destination fluid, flow parallel to each other in a microchannel. Using a half-wave acoustic standing wave across the channel width, cells or particles with positive acoustic contrast factors are moved to the destination fluid where the pressure nodal line lies. By controlling the relative flow rate of the two fluid streams, the pressure nodal line can be maintained at a specific offset from the fluid interface within the destination fluid. Using this transportation method, particles or cells of different sizes and mechanical properties can be separated. The cells experiencing a larger acoustic radiation force are separated and transported from the original suspension to the destination fluid stream. The other particles or cells experiencing a smaller acoustic radiation force continue flowing in the original solution. Experiments were conducted to demonstrate the effective separation of polystyrene microbeads of different sizes (3 μm and 10 μm) and waterborne parasites (Giardia lamblia and Cryptosporidium parvum). Diffusion occurs between the two miscible fluids, but it was found to have little effects on the transport and separation process, even when the two fluids have different density and speed of sound.
INTRODUCTION
Manipulation of cells at the microscale plays a critical role in cellular analysis and modern clinical diagnostic studies.1, 2 Some of these operations include separation or aggregation in continuous fluid flow, sorting and trapping of specific cells, and transport between solutions. For example, specific cells in a blood sample may need to be separated and concentrated and moved to another solution for subsequent analysis. Recently, miniaturized lab-on-chip systems provide an extremely attractive and useful technology for integration of all the cellular analysis procedures, including micro-manipulation of cells, cell identification and functional assay or cellular assay, into a small and portable device.3, 4, 5 Compared to conventional batch systems, miniaturized lab-on-chip devices operated in continuous mode offer some advantages such as small sample volume requirement, precise handling of samples, potency to integrate into point-of-care or in-the-field devices and potency for automation and fast optimization of processes where continuous feedbacks of the process efficiency and parameters are performed on-line.
The techniques of cell micro-manipulation are normally based on several well studied physical mechanisms such as sedimentation, dielectrophoresis, electrophoresis, acoustophoresis, and optical tweezers. The sedimentation method utilizes the balance between gravity and buoyancy force6 acting on cells in a microfluidic environment. Dielectrophoresis, in which a force is exerted on the cell in a non-uniform electric field, is another phenomenon that is commonly used. The strength and direction (attractive or repulsive) of this force depends on the extend of polarization of the cell, which in turn depends on the dielectric properties of the cell, and this can be an effective way of separating and trapping specific cells in a heterogeneous population.7 A similar phenomenon using ultrasonic waves in microfluidic environment, called acoustophoresis, has also been reported.8, 9 For example, studies have demonstrated the use of acoustophoresis to separate a mixture of microparticles that differ in size.10, 11 Furthermore, an acoustic radiation force can also act on cells based on the differences in density and compressibility of the cells (instead of dielectric properties, as in dielectrophoresis) with respect to the surrounding fluid medium.12 Again, the differing magnitude and direction of this force acting on cells with different densities and compressibilities can be used to separate and sort cells based on their mechanical properties. The use of ultrasonic waves for cell separation is preferable compared to the other mentioned physical mechanisms because it allows manipulation and separation of cells without any direct contact with the cells and with a relatively low power. For example, while ultrasonic waves typically use a power intensity at the order of 102–103 W/m2, another popular physical technique—optical tweezer—uses a typical power intensity at the order of 109 W/m2.13
In this paper, we describe a new microfluidic device that uses acoustophoresis to continuously separate and transport species between two streams of fluids. The acoustic radiation force is applied through an ultrasonic standing wave set up across the width of the microchannel. This force moves species to the pressure node (at the center of the channel) or anti-node (at the side walls) depending on the acoustic contrast factor of the species which is determined by its density and compressibility with respect to the surrounding fluid. As reported in previous works, this acoustic force has been successfully applied in steady fluid flows to concentrate cells and increase cell-cell contact area,8 and in a continuous micro-flow to separate cellular species, such as blood cells and lipid particles.9 Continuous cell separation has recently received increasing interest for some applications such as separation of circulating tumour cells from blood as well as automation and fast optimization of cell separation.14, 15
Recent applications of the acoustophoresis to cell/particle separation or extraction in microdevices are usually performed in a single fluid medium.16 However, there are situations where the extracted species need to be re-diluted in another solvent for subsequent analysis such as in flow cytometry and in hemolysis experiments. For example, cells extracted from culture solutions need to be re-diluted in another solvent for flow cytometry.17, 18, 19 Hence, it is desirable to design a multi-fluidic flow system for simultaneous cell extraction and re-dilution, transporting cells from one solvent to another. Such a system can be designed by having the pressure node in the destination fluid, so that the cells with positive acoustic contrast factor will be extracted and transported from its original solvent to the destination solvent as they move to the pressure node. For cells with negative acoustic contrast factors, the source and destination solvents are interchanged, as the cells concentrate to the pressure anti-node.
Petersson et al.20 reported a particle transport system between two types of solvents using a three-stream setup with an ultrasonic standing wave. Particles suspended in one solvent enter a microchannel etched in silicon through two side inlets, while the destination solvent enters through a center inlet. With this three-stream setup, the pressure node due to the standing wave is located at the midpoint of the channel within the central fluid stream. Thus, the particles or cells with positive contrast factors are transported from their original solvent at the sides of the channel to the destination solvent in the middle as they concentrate towards the pressure nodal line. At the end of the channel, the three streams branch out into three outlets and the species are collected in the middle stream, suspended in the new solvent. Augustsson et al.21 reported a strategy to perform buffer exchange of particle and cell suspensions between two medium. In their design, an acoustic chamber with multi-segments and multiple consecutive cross-flow junctions was used to deform the fluid streams and shift the interface from the pressure nodal line. Utilizing this design, high medium exchange efficiency was achieved at high volume flow rate.
When two or more fluid medium or solvents are present in the system, the relative position of the pressure nodal line and the fluid interface is a key factor to design and operation of the microdevice. With proper design and operation conditions, the pressure nodal line can be shifted into the appropriate fluid medium for the desired outcome. Kapishnikov et al.22 reported a microchannel with the width of one-quarter of the acoustic wavelength. Ultrasonic transducers, vibrating at the same frequency, were placed on both sides of the microchannel. The coupling layers to the transducers and the phase difference between the two transducers were carefully adjusted so that the acoustic pressure node is formed near to one of the channel walls and a pressure anti-node is formed at the other wall. Two fluid streams were used, with the particles originally suspended in the stream next to the wall with the pressure anti-node. Again, under the action of the acoustic radiation force, particles with positive acoustic contrast factor are transported to the other fluid stream where the pressure nodal line resides. Kapishnikov’s method simplifies Petersson’s three-stream system to one with only two streams. However, a relatively complex acoustic system to control the relative phase difference of the two transducers is needed to maintain the positions of the pressure nodal and anti-nodal lines in the microchannel. The thicknesses of the channel wall and the coupling layers also need to be carefully designed for the system to work properly with the transducers. Furthermore, fluid medium with similar density and speed of sound were usually considered in the previous studies on medium exchange. The deformation of the acoustic field caused by the difference between the two highly dissimilar mediums and effects of diffusion between the two medium streams were not studied in detail.
In this paper, we present a two-stream microfluidic system to separate and transport species (cells or polystyrene beads) from one solvent to another by acoustophoresis, using just a single transducer coupled to the bottom of the microchannel. An acoustic standing wave with its half-wavelength corresponding to the channel width was setup so that a pressure nodal line is located near the center of the channel. Due to the differences in density and compressibility of the two fluid streams, the nodal line will also be shifted from the center of the channel. We will show that the shift in the nodal line position is small, and we can effectively manipulate the location of the fluid interface, relative to the nodal line, by adjusting the flow rates of the two streams. By placing the nodal line within the destination solvent or fluid, species with positive acoustic contrast factors can be transported across the fluid interface into this fluid medium. As the system is set up for miscible fluid streams with dissimilar properties, the effects of diffusion at the fluid interface on the ultrasonic pressure field and nodal line location will also be investigated. Compared to the elaborate setup used by Augustsson et al.,21 the current design is simpler, but it is only suited to handle a small volume flow.
In Sec. 2 of this paper, we present a simple theoretical analysis of the fluid flow in the fully developed region of the channel based on the laminar flow theory. The acoustic field set up in the microchannel and the acoustic radiation force acting on spherical species are also presented. The newly fabricated microdevice and experimental setup are described in Sec. 3, and the results from a series of experimental studies are given in Sec. 4. We show that a stable two-stream flow with an acoustic standing wave can be used to separate and transport cells and particles from one solvent to another, under proper control of the fluid flow rates.
THEORY
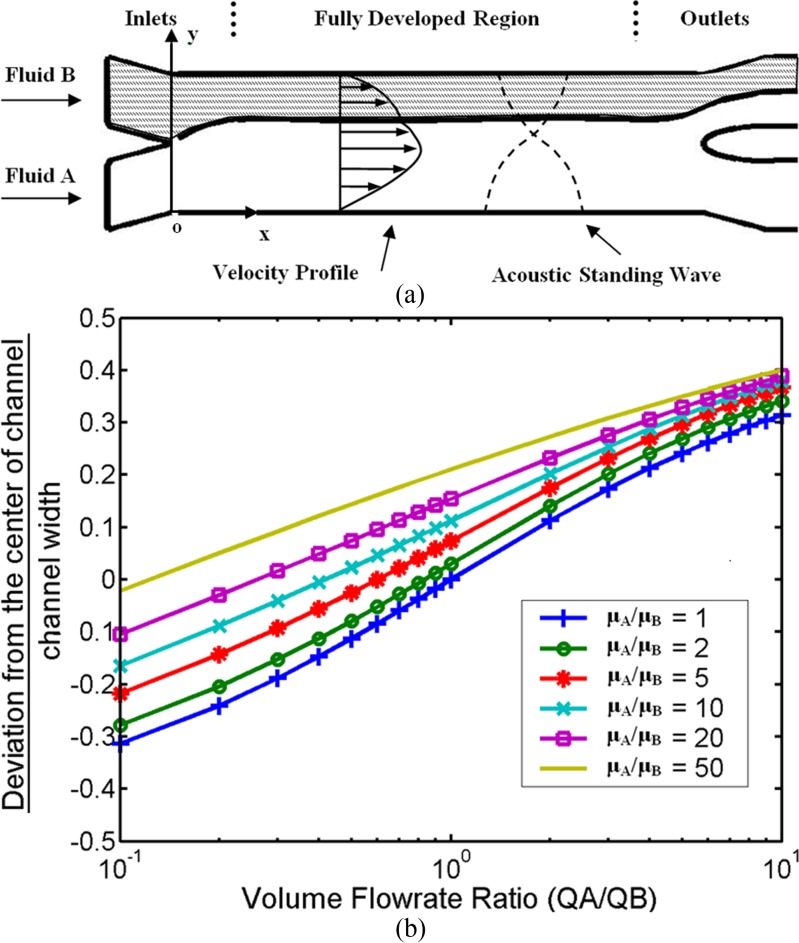
In our studies, a microchannel with two inlets and two outlets was used. Two streams of fluids are pumped into the channel at the two inlets. Due to the low Reynolds number, the flow is laminar, and the flow state in the channel is mainly governed by the fluid densities, viscosities, and flow rates. At steady state, the flow becomes fully developed after a certain distance from the inlets. The fluid interface between the two streams lies parallel to the channel walls over most part of the microchannel until a small section before the outlets (shown in Figure 1a). The ideal interface location is a function of the input volume flow rates and the dynamic viscosities of the two incoming fluid flows. Within the fully developed region, an acoustic standing wave will be set up to transport species between the two fluidic streams. Figure 1b shows a parametric study of the interface location as a function of the relative flow rate and relative dynamic viscosity of the fluids. When the two fluid streams have the same viscosity and flow rate (μA/μB = 1 and QA/QB = 1), the fluid interface is located exactly at the center of the channel width. The interface can be shifted towards one of the fluid stream by decreasing the flow rate of that fluid. When the two fluid streams have different viscosities, the interface is shifted towards the less viscous fluid even when the flow rates are equal. Nevertheless, the interface location can be controlled by adjusting the relative flow rate.
Figure 1.
Flow state of two parallel fluid streams within micro-channel. (a) Schematic diagram of microchannel and parallel fluid streams. The channel has two inlets and two outlets for two streams of fluids. The fluids exhibit laminar flow and a fully developed region is present over most of the channel, except regions near the inlets and outlets. An ultrasonic standing wave is set up across the channel width in the fully developed region. (b) Interface location between two fully developed parallel streams. When the two fluids have the same flow rate and viscosity, the interface lies at the center of the channel; the deviation is zero. When the flow rate or viscosity is changed, the fluid interface deviates from the center. For a given ratio of viscosities, the interface location can be controlled by the relative flow rate.
Due to the small dimension of the channel, the Reynolds number for the fluid flow is small. Hence, we model the fully developed flow region by the 2D Stokes flow equation,
| (1) |
where P is the static pressure in the fluid, is the x component of the fluid velocity, μ is the dynamic viscosity of the fluid, and y is the coordinate along channel width. The two side walls are modeled with no-slip boundary conditions, and continuity in both velocity and traction at the fluid interface is enforced. Typically, the velocity profiles take on a parabolic shape. Cells or micro-particles moving through the microchannel will be subjected to fluid drag force and acoustic radiation force of the ultrasonic standing wave. The species are usually much smaller than the channel dimensions that they do not disturb the flow field. The fluid drag force acting on the species can be estimated using the Stokes drag expression for a sphere in infinite fluid domain,
| (2) |
where R is the species radius; is the species velocity, and is the fluid velocity at that point. In our case, the mass of the micro-species is so small that the species will attain the fluid velocity in a very short time. The suspended species also experience a buoyancy force which is the sum of the gravitational force and lift force. Due to the small differences in the densities of the species and the fluid and the very low Reynolds number of the flow (Re < 1), the buoyancy force is neglected in our model.
The frequency of the ultrasound field is chosen such that it is close to the resonant frequency of the standing wave across the channel width. We use a simplified 1D model for the acoustic field across the channel width, and the pressure is assumed to be harmonic in time, as given by , where ω is the angular frequency. The governing equation for the pressure field is given by the Helmholtz equation,
| (3) |
where is the acoustic pressure amplitude and c is the speed of sound in the fluid medium. At the fluid interface, continuity in acoustic pressure and velocity is enforced. At the two channel walls, the rigid boundary condition is applied.
The acoustic force FA acting on the species is given by23
| (4) |
where v is the fluid velocity due to the acoustic field, the angled brackets denote time-averaged quantities, ρ is the density of the fluid, and and are factors dependent on the density and sound speed of both the surrounding fluid and the suspended species.
| (5) |
where the subscript s indicates properties of the suspended species. In the case of a homogeneous fluid medium, where a sinusoidal wave is set up between the walls, the factors combine to give the commonly known acoustic contrast factor22
| (6) |
where, and β give the compressibility of the suspended species and the surrounding fluid, respectively. In the present case where two different fluids are used, the standing wave set up will have a slightly different profile from a sinusoidal wave. Nevertheless, the ultrasonic field will still exert an acoustic radiation force on species suspended in the fluid and push the species with positive contrast factor towards the pressure nodal line at the center of the channel.
For two miscible fluids, there is a certain degree of diffusion between the two fluids at the interface. To study the diffusion of the fluids across the interface (in the y-direction along the channel width), we use a 2D steady state model given by the following governing equation:
| (7) |
where ux and uy are the x and y components of the fluid velocity, respectively; and D is the diffusion coefficient. In the present investigation of two fluid streams consisting of deionized (DI) water and salt (NaCl) solution, c represents the concentration of the NaCl. The diffusion along the x-direction along the channel is neglected as it is overwhelmed by the convective term due to the fluid velocity in the x-direction. Along the side walls, the boundary condition is given by .
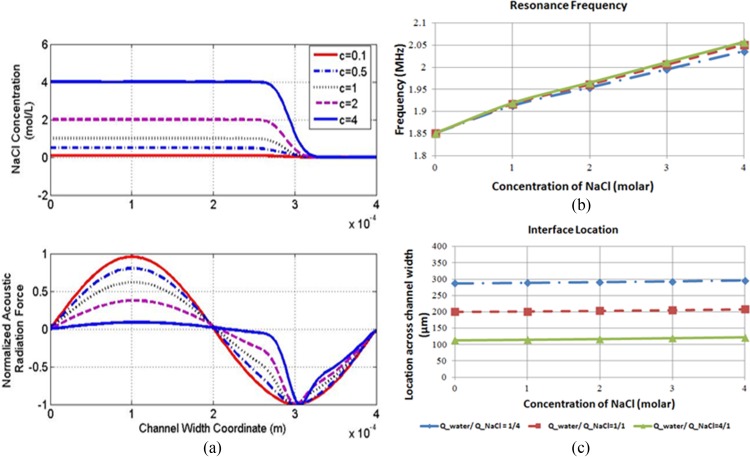
Figure 2a shows the distribution of the acoustic radiation force for several cases where the salt concentration is changed, while the other fluid stream is kept as DI water. For a low concentration of salt (0.1 mol/l), the acoustic force profile takes on a sinusoidal shape, similar to the case of a single fluid stream. As the salt concentration increases and there is higher mismatch in the acoustic impedance between the two fluid streams, the acoustic radiation force increases at the fluid interface. It is noted that the pressure node location is also shifted as the salt concentration varies, but the shift is rather small (less than 10% of the channel width). Due to the changes of the salt concentration, the resonance frequency of the two fluids will also change. Figure 2b illustrates the resonance frequencies corresponding to different salt concentrations. It can be seen that the resonance frequency changes by about 10% over the range of concentration of NaCl from 0 to 4 mol/l. However, the resonance frequency is quite insensitive to the change in volume flow rate ratio. Figure 2c shows the corresponding interface locations.
Figure 2.
Acoustic field for different salt (NaCl) concentration. (a) Distribution of the acoustic radiation force for different NaCl concentrations at the cross-section 2000 μm downstream from the inlets. The calculated acoustic radiation force is normalized by the maximum magnitude in each case. DI water with input flow rate of 0.6 μl/min at the upper inlet and 2 mol/l NaCl solution with input flow rate of 2.4 μl/min at the lower inlet. Diffusion coefficient is D = 0.2 e-9 m2/s. The corresponding density, viscosity, and sound speed at different NaCl concentration are calculated according to Refs. 24, 25. (b) Simulation results of the resonance frequencies for different NaCl concentrations at the cross-section 2000 μm downstream when different flow rate ratio were used. Total volume flow rate within the channel was set to be 3 μl/min. (c) Interface location for various flow rates and concentrations of NaCl. The interface is the location within the diffusion layer which has the mean NaCl concentration of the two fluids.
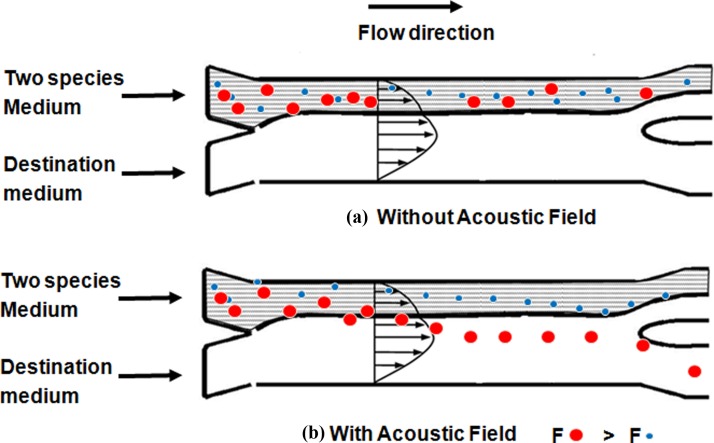
By controlling the relative flow rate of the two inlet fluids, the interface between the two fluid streams within the channel can be shifted from the pressure nodal line of the acoustic standing wave so that the species laden fluid stream is narrowed. When different species flow through the acoustic standing wave, the species that experience a sufficiently large acoustic radiation force will be transported across the interface from the original fluid medium into the other parallel stream (as shown by the larger red dots in Figure 3). Equation 4 indicates that the magnitude of the acoustic radiation force on a sphere is proportional to the gradient of the acoustic field, contrast factor, and the volume of the species. If two species have same acoustic property (positive contrast factor) but different sizes, the larger one will experience a larger acoustic radiation force than the smaller one. Consequently, the larger species will move faster to the pressure node than the smaller one. With proper sizing of the microchannel, volume flow rate, and the acoustic field strength, different species can be separated by their size at the end of the micro channel. The present method is able to separate different species based on their size and acoustic property, and transported the separated species into the destination fluid stream simultaneously.
Figure 3.
Sketch of the separation process of two species. Two different species were carried into the micro-channel through upper inlet. (a) Without acoustic field, all species (denoted as large and small dots) flow within the original suspension. (b) When the acoustic field is applied, the larger species that experienced a larger acoustic radiation force move faster than the smaller one towards the node. At the end of the channel, the larger species crossed the fluid interface into the destination fluid, while the smaller species did not cross the interface and remained within the original medium.
MATERIALS AND METHODS
Materials
Syringes and Tygon tubings were obtained from Cole Palmer. Polystyrene beads were purchased from Thermo Scientific. Cryptosporidium parvum, Giardia lamblia, anti-C. parvum antibody and anti-G. lamblia antibody were obtained from Waterborne Inc. Phosphate buffered saline (PBS) was obtained from Sigma Aldrich. Ultrapure water with a resistivity of 18.2 MΩ cm was obtained from a Milli-Q system.
Experimental setup
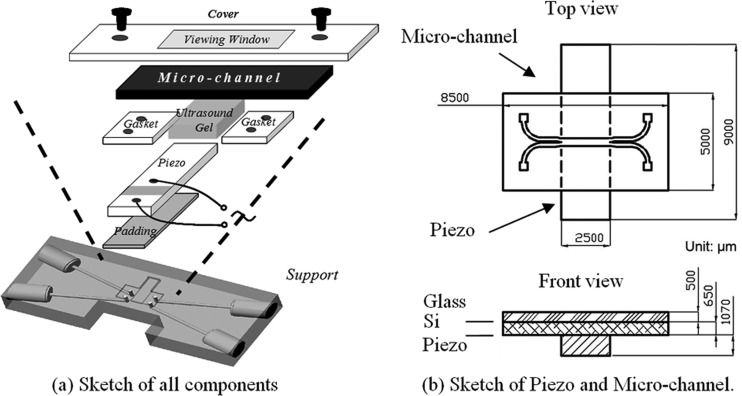
The acoustic micro-channel system used in the experiments is shown in Figure 4. The microchannel chip consists of an H-shape microchannel which has two inlets and two outlets. This channel is made by deep reactive etch on a silicon base (Oxford Plasma 100 DRIE/ICP system: 200 etch/deposit steps, vertical error ±0.1°, and amplitude of undulations on side walls of 100–400 nm), and it is covered by glass on top. The channel width corresponds to the half wavelength of the ultrasound used so that a standing wave is set up between the side walls. A piezo-ceramic transducer (Sparkler Ceramics Pte Ltd, India, resonance frequency is 1.875 MHz for first thickness mode) is attached to the bottom surface of the channel with the width of the transducer covering the whole length of the micro channel. Ultrasound gel is used to ensure good coupling between the transducer and the microchannel. The assembled system is measured using a LRC meter, and the resonance frequency of the piezo-ceramic is found to be 1.88 MHz. The transducer is then driven by a sinusoidal signal using a function generator (Agilent 33120 A). The voltage applied on the piezo-ceramic is 20 Vpp for all the experiments. At this working condition, no acoustic cavitation and no acoustic streaming were observed, as the acoustic intensity was found to be low (about 75 mW/cm2). Furthermore, since the transducer is directly driven by the function generator without any power amplifier, the driving current was very low, about several milli-amperes for the applied voltage of 20 Vpp. The power dissipation by the piezo-ceramic transducer is very small and no temperature change was observed in the experiments. The flow of species in the fluid channel is observed through the top glass cover via a microscope with a CCD camera (Leica Microsystems Vetzlar GmbH). Typical flow rate of the fluid used in the following experimental studies varies from hundreds of μL/h to several mL/h. These flow rates correspond to the Reynolds number in the range of Re ≈ 0.3–0.5, meaning that the flow within the channel is laminar.
Figure 4.
Acoustic micro-channel system. (a) Exploded view showing the various components in the system. (b) Top and front views of the microfluidic channel with piezoelectric transducer at the bottom.
Preparation of cell samples
To stain the parasite cells, both of the C. parvum and G. lamblia were separately mixed with their corresponding antibodies. The mixtures were incubated at 37 °C for 30 min. The parasite cells were then collected via centrifugation and were reconstituted into a drinking water solution. A 1 ml syringe was then used to contain the suspensions of cells and was connected to the inlet of the acoustic chip. A syringe pump (New Era Pump SystemTM) was used to purge the channel as well as to flow the cell samples into the channel.
Cell separation analysis and viability test
For cell separation analysis, the cells obtained from the outlets of the channel were collected and centrifuged. The concentrated cell samples were analyzed using a haemocytometer. Cell separation efficiency was calculated as the percentage of target parasite cells among all the parasite cells collected at that outlet. For parasite cell viability test, cells were flowed into the microchannels at different flow rates. The cells obtained from the outlets of the channel were immediately mixed with propidium iodide. Under fluorescence lighting, a number of the green and red stained cells are counted using a haemocytometer.
EXPERIMENTAL RESULTS AND DISCUSSIONS
Using the acoustic micro-system described in Sec. 3, a series of experiments were conducted with polystyrene microbeads in DI water and NaCl solution and parasites in DI water and PBS buffer. The experimental results demonstrated the effectiveness of separation of species based on size, and transportation of the suspended species from one fluid stream to another using acoustophoresis.
Polystyrene particle transport between two miscible fluid streams
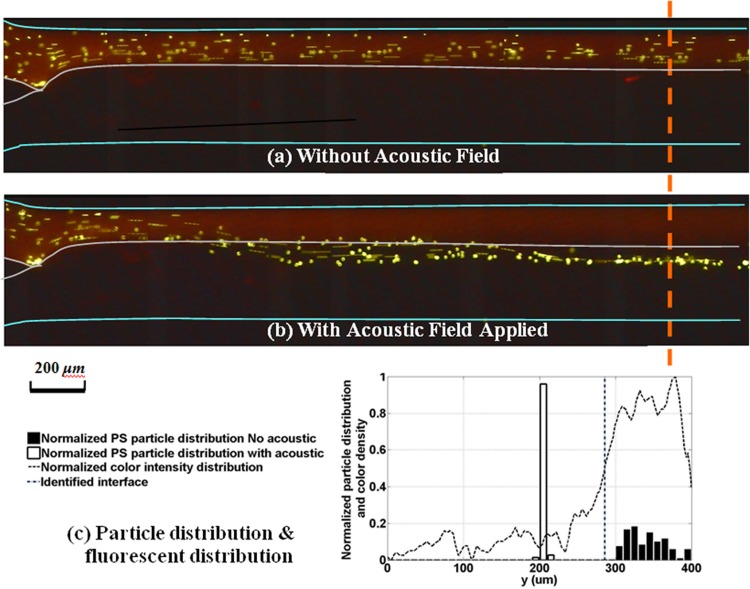
Spherical polystyrene particles of diameter 10 μm were first used to demonstrate the particle transport between two fluid streams. These spherical polystyrene particles were suspended in the first fluid stream (which we denote as the source fluid) of DI water dyed with red rhodamine B. Since the polystyrene particles are fluorescent green, the suspended particles show up as green dots against a red background under UV light. A second fluid stream of DI water, which is the destination fluid, flows parallel to the first stream; it is not dyed and hence appears as dark or black under UV light (Figure 5). The flow rates of the first fluid stream with particles and the destination fluid stream are set to be 100 μL/h and 200 μL/h, respectively. The concentration of the particles used is about 8 million particles per mL. Figures 5a, 5b show the captured images of the particle distribution in the bi-fluidic flow with and without acoustic field, respectively. The curve (dashed) in Figure 5c shows the normalized dye intensity across the channel width at 2200 μm downstream of the channel entrance. The variation in the dye intensity indicates the distribution of the source fluid (high intensity of 1) and the destination fluid (low intensity of 0). There is a gradual variation in the intensity, instead of an abrupt change in intensity, due to diffusion between these two miscible streams. We use the normalized intensity value of 0.5 to denote the “interface” between the two fluid streams and the range from 0.2 to 0.8 as the region of diffusion. From Figure 5, the diffusion region lies between 241 μm to 303 μm, and the interface is located at 285 μm.
Figure 5.
Particle distributions in bi-fluid flow. (a) Captured image under UV light when no acoustic field applied, particles flow within its original solvent (DI water colored red). (b) Captured image under UV light when the acoustic field applied, particles are transported across the fluid interface. (c) Particle distribution and fluorescent density distribution along a cross section (2200 μm) downstream. Sample size: 100 (acoustic field applied) and 120 (no acoustic field applied).
To study the distribution of the particles, the width of the channel (400 μm) was divided into forty parts of equal width (10 μm), and the number of particles passing through each part was counted over a fixed time period. This number is expressed as a fraction of the total number of particles flowing through the channel, giving a histogram of the particle distribution along the channel width. The results for the cases with and without acoustic field are shown and compared in Figure 5c. Without the acoustic field, the particles are suspended uniformly in the original source fluid, as shown by the spread of the histogram with bars shaded in black. When the acoustic field is applied, the particles were concentrated to a small region (as shown by the histogram with unshaded bars) near the center of the channel where the acoustic pressure nodal line lies. This nodal line is located in the destination fluid, and the particles had been transported across the fluid interface from one fluid to the other.
By adjusting the relative outlet pressures of the two fluid streams at the outlets of the channel, the fluid interface can be shifted with respect to the pressure nodal line. The transported particles in the destination fluid stream are then collected at the lower outlet (in this case). Table TABLE I. shows the experimental results of the particles collected with the destination fluid stream in the presence of the acoustic standing wave. It can be seen the acoustic field is effective in transporting more than 90% of the particles from the source fluid to the destination fluid.
TABLE I.
Statistic results for water/water case.a)
| Particle diameter | Percentage of particles through upper outlet (%) | Percentage of particles through lower outlet (%) | Sample size |
|---|---|---|---|
| 10 μm | 6.25 | 93.75 | 48 |
| 20 μm | 8.40 | 91.60 | 119 |
Flow rate of DI water with particles: 100 μL/h and Flow rate of DI water without particles: 400 μl/h.
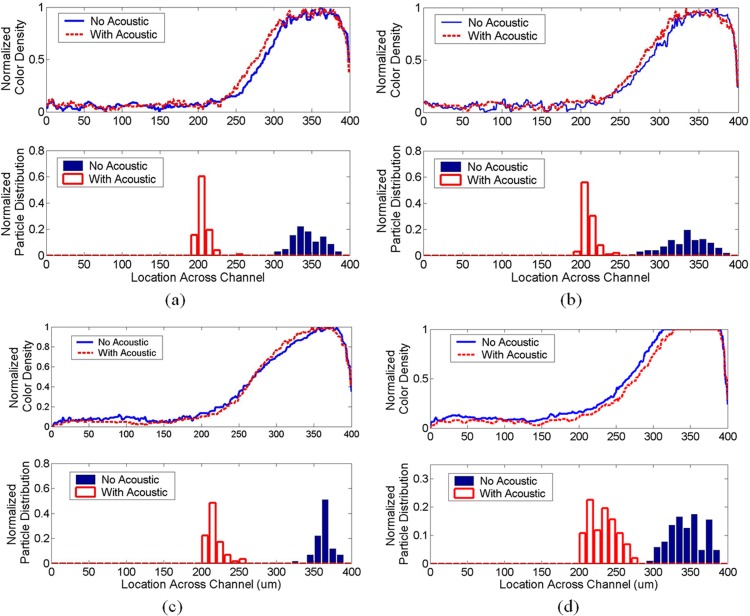
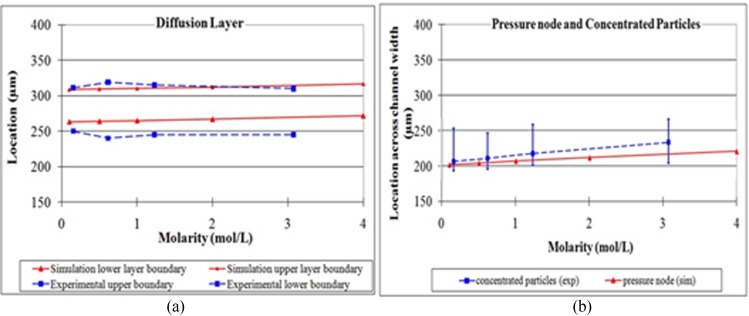
Next, we study the transport of polystyrene beads across two dissimilar fluids: DI water and NaCl solution. The setup is the same as the previous experiment, except that the destination fluid is changed to a salt solution. Figure 6 shows the color intensity distribution across the channel width which indicates the fluid distribution, interface, and diffusion region for various concentrations of salt solution from 0.15 mol/l to 3.075 mol/l. The distributions of particles are also indicated by the shaded and unshaded histograms for cases in the absence and presence of acoustic field, respectively. Again, the results show that the polystyrene particles were carried in the original source fluid (dyed DI water shown as high dye intensity) when there is no acoustic field was applied. When the acoustic field was applied, the particles crossed the fluid interface and moved to the pressure nodal line in the destination fluid (salt solution shown as low dye intensity) and were transported along with the salt solution. The experimental results also show that the pressure nodal line is shifted slightly when different concentrations of salt were used. Higher concentration of salt caused a larger shift in the nodal location, and this is in agreement with the trend predicted by the theoretical model (shown in Figure 7). The diffuse region across the channel width observed experimentally, as defined by the region with intensity between 0.2 and 0.8, also matched the results in the theoretical model. The mean locations of the particles in the destination fluid for various salt concentrations are close to the pressure node locations predicted by the theoretical model. The experimental results show some spread in the particle location in the destination fluid (Figure 6). This spread of the particles is about 50 μm, which is well within the width of destination fluid.
Figure 6.
Normalized color density and particle distribution for different NaCl concentrations in the destination fluid while the source fluid is kept as DI water. (a) 0.154 mol/l NaCl solution. (b) 0.615 mol/l NaCl solution. (c) 1.23 mol/l salt solution. (d) 3.075 mol/l salt solution.
Figure 7.
Comparison of the diffusion layer and pressure node between experimental and simulation results. (a) The region of diffusion observed in experiments, given by the region where the dye intensity falls between 0.2 and 0.8, compares favorably with the numerical prediction for different concentration of NaCl. (b) The mean locations of the particles together with the minimum and maximum locations (shown in blue) are in good agreement with the location of the pressure node (predicted by numerical model and shown in red) for different concentration of NaCl.
Particle and parasite separation and the transportation
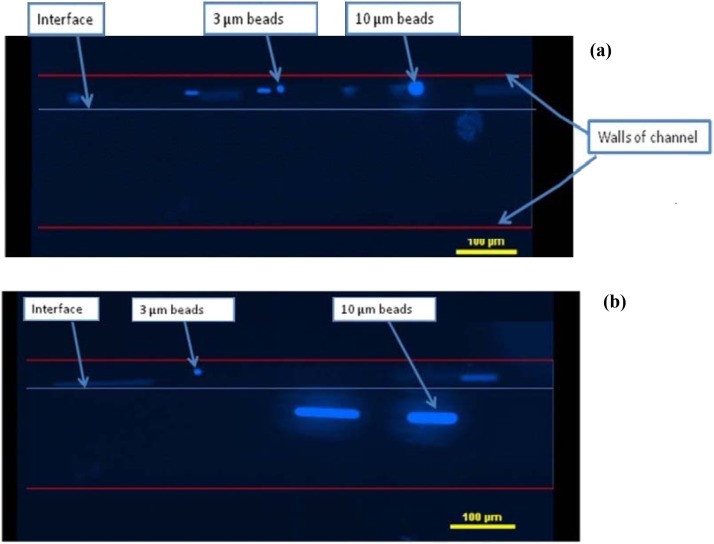
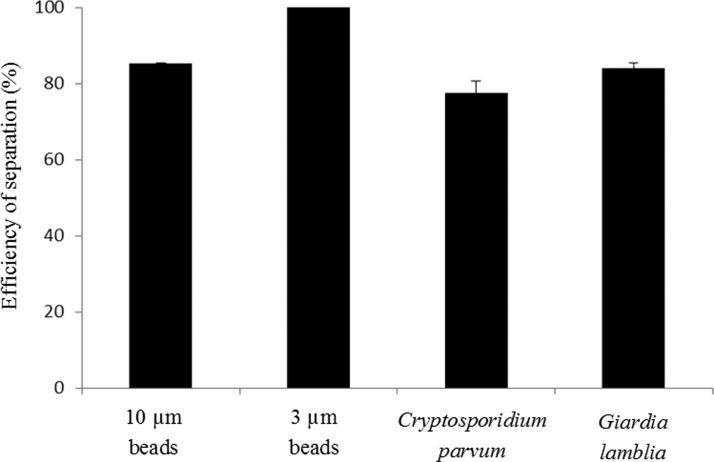
Next, we demonstrate the separation of polystyrene beads of different sizes (3 μm and 10 μm in diameter) and waterborne parasites (G. lamblia and C. parvum) using the ultrasonic standing wave. In this experiment, a narrower Si micro-channel, whose width is 200 μm and the corresponding resonance frequency is 3.85 MHz, was used. The experimental setup and procedure are same as those used in Sec. 4A. This narrower channel has higher resonance frequency and it provides a higher acoustic field gradient and higher acoustic radiation force. Its small dimensions also allow the species to be separated over a shorter distance, making experimental observations easier. The transducer was driven by sinusoidal signal of 20 Vpp. Figure 8 shows the captured images under UV light when polystyrene beads were used. A mixture of two types of fluorescent beads (3 μm and 10 μm) in DI water was pumped into the micro channel through the upper inlet at 50 μL/h. Another parallel stream of DI water was also pumped through the lower inlet at 200 μL/h. Without the ultrasound field (Figure 8a), all the beads flow within the original fluid stream along the microchannel. When the ultrasound field was applied, the larger beads move towards the center of the channel where the acoustic pressure node lies, while the smaller beads continue flowing within the original suspension. At the end of the acoustic channel, the larger beads were separated from the original suspension and transported into the lower parallel fluid simultaneously. Separation efficiency of 85.3% and 100% were achieved for 10 μm beads at the lower outlet and 3 μm beads at the upper outlet, respectively (Figure 9).
Figure 8.
Captured images of the polystyrene beads as they flow through the micro-channel. Upper fluid stream is a suspension of 3 μm and 10 μm beads in DI water with a flow rate of 50 μL/h. Lower fluid stream is clean DI water with a flow rate of 200 μL/h. (a) No ultrasound field was applied and all beads flow within the original suspension. (b) Ultrasound field applied at 20 Vpp and the larger beads are separated and transported to the lower fluid stream.
Figure 9.
Relative separation efficiency of 10 and 3 μm polystyrene beads as well as C. parvum and G. lamblia.
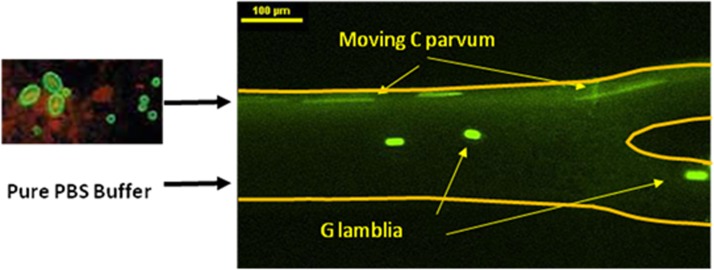
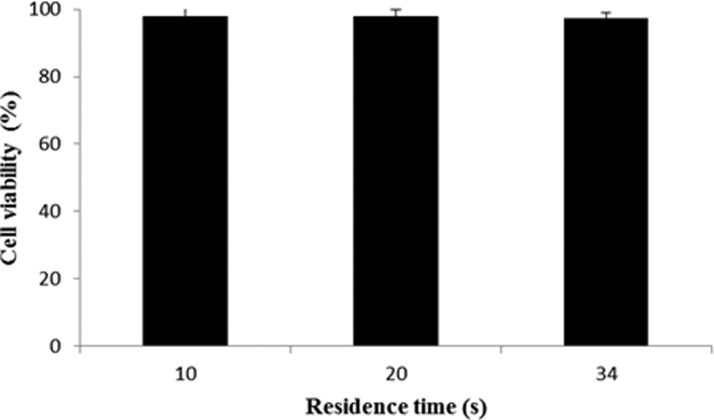
The experiment was repeated with two species of waterborne parasites, G. lamblia and C. parvum, obtained from Waterborne Inc. Typically, the G. lamblia are larger (∼15 μm) than the C. parvum (∼5 μm). These two parasites, dyed by green fluorescent dye, were first suspended in drinking water at a concentration of 106 cells/mL and pumped into the channel through the upper inlet at the flow rate of 50 μL/h. A parallel stream of PBS buffer was pumped though the lower inlet at the flow rate of 200 μL/h. Figure 10 shows the captured images under UV light. Under the action of the ultrasound field, the larger G. lamblia were transported to the lower stream of PBS buffer and collected at the lower outlet. The smaller C. parvum continue to flow within its original stream of DI water. Separation efficiency of 77.5% and 84% were achieved for C. parvum and G. lamblia, respectively (Figure 9). Furthermore, after being exposed to acoustic field, the viability of the parasites could be tested by exposing them to a mixture of fluorescein isothiocyanate (FITC)-labeled antibody and propidium iodide. The antibody can stain both of live and dead parasites whereas propidium iodide can only stain dead parasites. The parasites were exposed to an ultrasound excited by 20 Vpp for different cell residence time inside the acoustic chip of 34, 20, and 10 s, which correspond to the three different flow rates of 30, 50, and 100 μL/h, respectively. Figure 11 shows the percentage of cell viability as a function of cell residence time. We observed negligible difference in the degree of cell viability for these different residence times. These results suggest that the parasites survive the acoustic field employed in our experiment and they remain viable.
Figure 10.
Captured image of separation of G. lamblia and C. parvum in a microchannel under an ultrasound standing wave. The flow rate of the parasite solution was set to 50 μL/h and the flow rate of the parallel PBS buffer to 200 μL/h. The PZT transducer was driven by a sinusoidal waveform of 20 Vpp. The mobile G. lamblia were separated from C. parvum and re-diluted into the lower PBS buffer stream, demonstrating the separation and re-dilution process using the acoustic field.
Figure 11.
Viability of parasites after being exposed to acoustic field at 20 Vpp at different exposure times.
Overall, the above experiments demonstrate the effective separation and transportation of particles (polystyrene beads) and cells (waterborne parasites) across two fluid medium in a microchannel using an ultrasound field.
CONCLUSION
A new technique for transporting micro-particles and cells using ultrasonic acoustophoresis between two miscible fluid streams has been presented. The experimental setup is simple, using just a microchannel with a piezoelectric transducer attached at the base. By controlling the relative flow rate of the two fluid streams, the fluid interface can be maintained at a specific offset from the pressure nodal line. This enables the separation and extraction of suspended species from one fluid medium to another simultaneously. Diffusion between the two miscible fluids was observed in the experiments, but it is found to have little effects on the ultrasound field and transport process.
ACKNOWLEDGMENTS
The authors would like to acknowledge the funding support from NRF (EWI) Singapore, Grant No. 0803-IRIS-02.
References
- Zare R. N. and Kim S., Annu. Rev. Biomed. Eng. 12, 187 (2010). 10.1146/annurev-bioeng-070909-105238 [DOI] [PubMed] [Google Scholar]
- Voldman J., Annu. Rev. Biomed. Eng. 8, 425 (2006). 10.1146/annurev.bioeng.8.061505.095739 [DOI] [PubMed] [Google Scholar]
- El-Ali J., Sorger P. K., and Jensen K. F., Nature 442, 403 (2006). 10.1038/nature05063 [DOI] [PubMed] [Google Scholar]
- Hacberle S. and Zengerle R., Lab Chip 7, 1094 (2007). 10.1039/b706364b [DOI] [PubMed] [Google Scholar]
- Reyes D. R., Dimitri L., Auroux P. A., and Manz A., Anal. Chem. 74, 2623 (2002). 10.1021/ac0202435 [DOI] [PubMed] [Google Scholar]
- Springston S. R., Myers M. N., and Giddings J. C., Anal. Chem. 59, 344 (1987). 10.1021/ac00129a026 [DOI] [Google Scholar]
- Hunt T. P., Lee H., and Westervelt R. M., Appl. Phys. Lett. 85, 6421 (2004). 10.1063/1.1840109 [DOI] [Google Scholar]
- Coakley W. T., Hawkes J. J., Sobanski M. A., Cousins C. M., and Spengler J., Ultrasonics 38, 638 (2000). 10.1016/S0041-624X(99)00151-1 [DOI] [PubMed] [Google Scholar]
- Petersson F., Nilsson A., Holm C., Jönsson H., and Laurell T., Analyst 129, 938 (2004). 10.1039/b409139f [DOI] [PubMed] [Google Scholar]
- Petersson F., Aberg L., Sward-Nilsson A. M., and Laurell T., Anal. Chem. 79, 5117 (2007). 10.1021/ac070444e [DOI] [PubMed] [Google Scholar]
- Liu Y. and Lim K. M., Lab Chip. 11, 3167 (2011). 10.1039/c1lc20481e [DOI] [PubMed] [Google Scholar]
- Yoshioka K. and Kawashima Y., Acustica 5, 167 (1955). [Google Scholar]
- Shi J. J., Ahmed D., Mao X. L., Lin S. S., Lawit A., and Huang T. J., Lab Chip 9, 2890 (2009). 10.1039/b910595f [DOI] [PubMed] [Google Scholar]
- Pamme N., Lab Chip 7, 1644 (2007). 10.1039/b712784g [DOI] [PubMed] [Google Scholar]
- Bhagat A. A. S., Bow H., Hou H. W., Tan S. J., Han J., and Lim C. T., Med. Biol. Eng. Comput. 48, 999 (2010). 10.1007/s11517-010-0611-4 [DOI] [PubMed] [Google Scholar]
- Hammarstrom B., Evander M., Barbeau H., Bruzelius M., Larsson J., Laurell T., and Nilsson J., Lab Chip 10, 2251 (2010). 10.1039/c004504g [DOI] [PubMed] [Google Scholar]
- Grogan W. M. and James M. C., Guide to Flow Cytometry Methods (Marcel Dekker Inc., New York, 1990). [Google Scholar]
- Boutron P. and Peyridieu J. F., Cryobiology 31, 367 (1994). [DOI] [PubMed] [Google Scholar]
- Hardt S. and Hahn T., Lab Chip (2011). 10.1039/C1LC20569B [DOI] [PubMed] [Google Scholar]
- Petersson F., Nilsson A., Jönsson H., and Laurell T., Anal. Chem. 77, 1216 (2005). 10.1021/ac048394q [DOI] [PubMed] [Google Scholar]
- Augustsson P., Åberg L. B., Swärd-Nilsson Ann-Margret K., and Laurell T., Microchim. Acta 164, 269 (2009). 10.1007/s00604-008-0084-4 [DOI] [Google Scholar]
- Kapishnikov S., Kantsler V., and Steinberg V., J. Stat. Mech.: Theory Exp. P01012 1742 (2006). [Google Scholar]
- Manneberg , Hagsäter S. M., Svennebring J., Hertz J. M., Kutter J. P., Bruus H., and Wiklund M., Ultrasonics. 49, 112 (2009). 10.1016/j.ultras.2008.06.012 [DOI] [PubMed] [Google Scholar]
- Zhang H. L. and Han S. J., J. Chem. Eng. Data 41, 516 (1996). 10.1021/je9501402 [DOI] [Google Scholar]
- Mackenzie K. V., J. Acoust. Soc. Am. 70(3), 801 (1981). 10.1121/1.386919 [DOI] [Google Scholar]


