Abstract
In this study, the pre-steady state development of enzymatic bioreactions using a microfluidic mixer is presented. To follow such reactions fast mixing of reagents (enzyme and substrate) is crucial. By using a highly efficient passive micromixer based on multilaminar flow, mixing times in the low millisecond range are reached. Four lamination layers in a shallow channel reduce the diffusion lengths to a few micrometers only, enabling very fast mixing. This was proven by confocal fluorescence measurements in the channel’s cross sectional area. Adjusting the overall flow rate in the 200 μm wide and 900 μm long mixing and observation channel makes it possible to investigate enzyme reactions over several seconds. Further, the device enables changing the enzyme/substrate ratio from 1:1 up to 3:1, while still providing high mixing efficiency, as shown for the enzymatic hydrolysis using β-galactosidase. This way, the early kinetics of the enzyme reaction at multiple enzyme/substrate concentrations can be collected in a very short time (minutes). The fast and easy handling of the mixing device makes it a very powerful and convenient instrument for millisecond temporal analysis of bioreactions.
INTRODUCTION
Microfluidic devices are widely used in chemical labs to replace large benchtop equipment. Especially for rare and costly chemicals, the microfluidic approach is very attractive, because of the low sample volume needed. Further, the surface to volume ratio increases in microsystems. This can be harnessed to achieve higher heat transfer, mass transport, or diffusion flux. In micromixers, the large surface to volume ratio can be used to accomplish fast and homogeneous diffusional mixing of reagents.1, 2 Recent reviews on active and passive micromixers can be found in the literature.3, 4, 5
A basic and widely investigated passive mixer design is the so called T-mixer, whose principle is based on a T-shaped channel crossing. Mixing times in the 1 s range can be achieved with these designs.6 To reduce mixing time in T-mixers in the order of one magnitude, pillar structures, or herringbone structured walls can be used, which introduce chaotic advection of the fluid.7, 8, 9 However, to reach mixing times in the low millisecond time regime at low Reynolds numbers, other methods are needed. In laminar flow micromixers molecular diffusion is the dominating effect responsible for mixing.10, 11, 12, 13 By applying multiple laminar flow sheets the diffusion length and hence the mixing time can be drastically shortened so that millisecond time resolutions can be reached.14
The functionality of a micromixer is often extended to a microreactor, where chemical reactions occurring in the device can be monitored.15, 16 Fast and reliable determination of (bio)chemical reaction kinetics, especially those of proteins and enzymes, are of high interest for chemical and pharmaceutical labs.17 Two principles, stopped-flow and continuous flow, are available to build a microreactor for monitoring chemical processes. The stopped-flow principle is reported by several groups.1, 11, 18 The main advantage is a very short dead time but an external trigger is needed to start the chemical reaction which, in many cases, cannot be conveniently realized. Hence, we followed the approach of continuous flow mixing to monitor enzymatic processes,19, 20, 21 where no external trigger is needed.
MATERIALS AND METHODS
Basic biochemical processes can often be described as simple binding steps.22 First, enzyme (E) and substrate (S) bind to each other to form a complex (ES), before the complex is converted into a product (P). Enzyme and product then dissociate so that the next substrate molecule can bind to the enzyme. The forward rate of the first binding process of E and S is k1. This process also works in the reverse direction by the rate k−1. The turnover number kcat, stating the rate of product formation, only works in the forward direction, i.e., the reverse rate is 0.
| (1) |
In most cases, a steady state kinetic analysis, which means that the rate of product formation is constant, is investigated. In enzyme kinetics, a basic and widely used model is represented by the Michaelis-Menten equation 1. Two significant numbers: the Michaelis-Menten constant KM and the turnover number kcat, can thus be determined from such a measurement. The Michaelis-Menten constant is the substrate concentration required for an enzyme to reach one-half of its maximum reaction rate. The turnover number is the maximum number of substrate molecules converted to product per enzyme molecule per second. The ratio kcat/KM thus gives information about how efficiently an enzyme converts a substrate into product. However, information about individual intermediate states occurring cannot be determined from these measurements.
At the beginning of an enzymatic reaction a non-linear, pre-steady reaction state occurs. In this region, the product formation increases exponentially to the steady state rate, a behavior also known as “burst.” Special techniques are needed to analyse these pre-steady state, which typically lasts less than 1 s but contains vital information about intermediate catalytic processes of the enzymatic reaction. Measuring the pre-steady state thus provides a more complete understanding of the events involved.
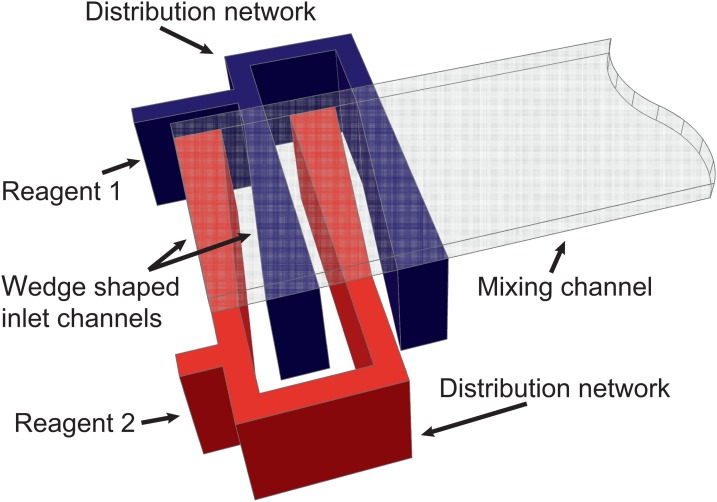
We previously developed a continuous flow device for real time monitoring of chemical reactions based on horizontal multilaminar mixing.14 Using that technology in conjunction with varying the time scale by adjusting the flow rate in a range of 0.3 μl/min up to 30 μl/min enables the investigation of early reaction kinetics by optical means. The measurements were carried out using a passive microfluidic lamination mixer made of silicon, polydimethylsiloxane (PDMS), and glass. The design is shown in Fig. 1, device details are presented in Ref. 23. Initially, this design was developed for time resolved Fourier-transform infrared (FTIR) measurements.24 For the purpose of this work, the design was adapted by applying a 200 μm glass cover instead of a 1 mm thick calcium fluoride (CaF2) slab. This eliminates the optical distortions of the CaF2 crystal and enables close observation using microscopic lenses with short working distances (<1 mm).
Figure 1.
Schematic of the lamination micromixer with two sided, wedge shaped inlet channels, distribution network, and mixing channel.14
The experiments were carried out on a Nikon Eclipse 80i with a C1 confocal system. A 488 nm argon ion laser (200 mW, Spectra Physics) was used for excitation, and the emitted signal was detected by a photomultiplier tube (PMT) after being optically filtered by a notch-filter (515 nm mid-wavelength, 30 nm wide). For confocal measurements, a 20-fold plan-apo lens with a high vertical resolution (0.4 μm) is suitable. To monitor the dynamics of the enzyme reaction in one image a large observation window is necessary which was provided by a 2.5-fold plan-apo lens.
Micromixer performance
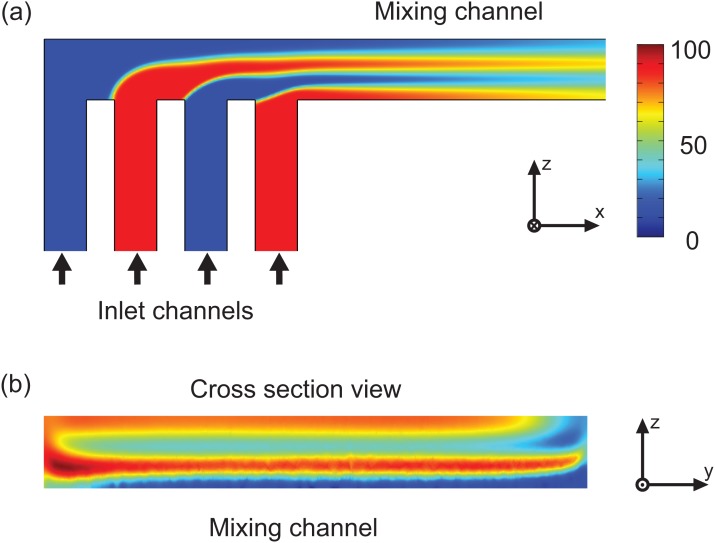
A schematic of the micromixer design is shown in Fig. 1. The two inlets of the microfluidic chip are fed by a Cetoni neMESYS double syringe pump and lead into the distribution network. In this network, four horizontal fluid layers are formed that flow into the mixing channel where fast diffusive mixing occurs. Computational fluid dynamic (CFD) simulations were carried out utilizing COMOL Multiphysics. A laminar flow model was combined with a diffusion model to find an optimized chip design. The simulation result of a length view in the middle of the mixing channel and a cross sectional plot at the beginning of the mixing channel are shown in Figs. 2a, 2b. The horizontal fluid layers are generated with different thicknesses by optimized wedge shaped inlets. This is crucial for fast and homogeneous mixing and shortens mixing time.14
Figure 2.
CFD simulation of the micromixer with optimized inlet channels; (a) length view of the mixer with inlet channels and (b) cross sectional view of mixing channel.
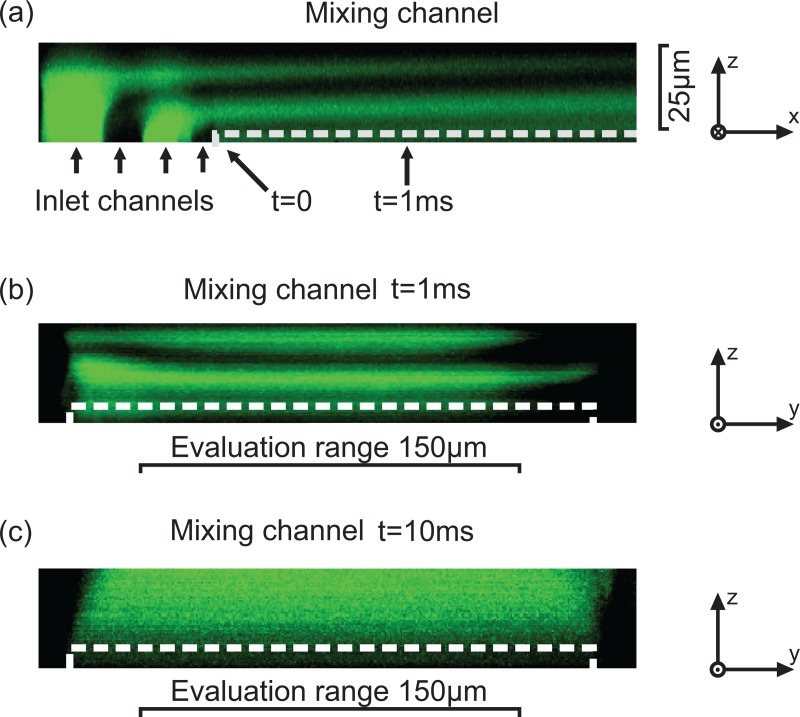
To validate the simulation result, an optical laser scanning confocal measurement was carried out. The two liquids, deionized (DI)-water and a 5 μM sodium fluorescinate solution, were pumped through the micromixer. Fig. 3a shows the measurement result with a flow rate of 15 μl/min in a length view. As predicted by simulations, four homogeneous fluid layers are formed by the optimized wedge shaped inlet channels and diffusive mixing starts after the layers are formed. Fig. 3b depicts the formed layers in a cross sectional view of the 200 μm wide microchannel at a time of 1 ms. Taking into account the 0.4 μm vertical resolution of the 20-fold lens used, 60 layers could be measured over the total channel height of 24 μm. An evaluation range is defined to exclude the inhibited mixing on the edges of the channel wall, seen in Fig. 3b. It has a width of no less than 150 μm because of the excellent mixing performance of the micromixer. In Fig. 3c), a cross sectional view of the mixing channel at a time of 10 ms is depicted showing a fully mixed state. A mixing time of 1 ms for a 8 μm high channel and 8 ms for a 25 μm high channel was calculated by using a mixing coefficient of 0.9 (90% of the equilibrium concentration is reached). These calculated values were also confirmed by measurements. Further, measurements showed that for a 8 μm high channel the reagents are completely mixed within 3 ms, if the inlet flow rate ratio is varied from 1:1 up 3:1. The mixing device operates in a range of 0.3 up to 30 μl/min. Therefore, kinetics in the 10–1000 ms range can be investigated with our device. The device with a channel cross section of 8 × 200 μm2 and a length of 900 μm was used for the enzyme measurements presented in this work.
Figure 3.
Measurement result of a confocal measurement with (a) a length view of the mixing channel and a cross sectional view of the mixing channel at a time of (b) 1 ms and (c) 10 ms. The white dashed line shows the channel bottom. The edges do not mix well and are therefore left out of the measurement. Because of the excellent mixing performance of the micromixer an evaluation range (width) of no less than 150 μm can be applied.
Enzyme protocol
Enzyme kinetic measurements were performed with β-galactosidase, which is an essential enzyme in medicine for lactose intolerance. The enzyme cleaves for instance lactose into the monosaccharides glucose and galactose so that they can be used as carbon-energy sources.25 It is commercially used to produce lactose-free products or drugs for lactose intolerant people. Further, the enzyme has gained importance as a reporter protein in molecular biology.26, 27 Structural as well as chemical analysis of the enzyme and its properties was done by several groups.28, 29, 30, 31, 32 It is a large (120 kDa, > 1000 amino acids) protein that forms a tetramer. The three dimensional structure of β-galactosidase was studied by Jacobson et al.33 Okamoto et al. showed the possibility of measuring reaction kinetics in a spinning microtube34 and a first droplet-based approach for enzyme kinetic experiments using only picolitre of reagents was reported by Tan and Takeuchi.35
The methods for the analysis of enzymes generally take quite long (several minutes to hours). With our device the investigation of an enzyme solution is completed within seconds. Furthermore, only very little substrate and enzyme solution (about 100 μl) is necessary. For the following enzymatic measurement, we applied Fluorescein di-(β-D-galactopyranoside) (FDG) and β-galactosidase from Escherichia coli, which were obtained from Sigma Aldrich (F2756 and 48275). Additionally, dimethyl sulfoxide (DMSO) from Sigma Aldrich (D8418), ethanol and deionized water (DI-water) were used.
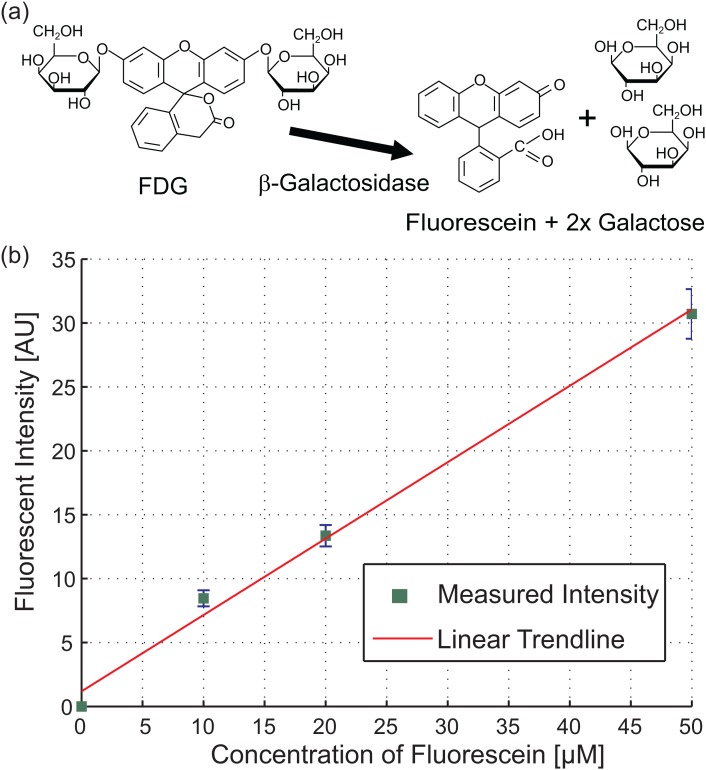
To determine the enzymatic activity of β-galactosidase in optical measurements, a fluorogenic substrate, Fluorescein di-(β-D-galactopyranoside), was used. FDG is non-fluorescent until it is sequentially hydrolyzed by β-galactosidase to fluorescein monogalactoside (FMG) and then to highly fluorescent fluorescein and galactose, see Fig. 4a. The turnover rate for the hydrolysis of FDG to FMG (1.9 μmol · min−1 mg−1) is significantly slower than of FMG to fluorescein (22.7 μmol · min−1 mg−1).36 Therefore, all produced FMG is fully hydrolyzed to fluorescein. Furthermore, as the fluorescence quantum yield of fluorescein is as high as 0.92, a very low concentration of 1 pmol/μl is detectable with our setup.
Figure 4.
Hydrolysis of FDG by β-galactosidase and fluorescent calibration curve. (a) FDG is hydrolyzed to the fluorescent compound, fluorescein, and two galactose residues by β-galactosidase. (b) The calibration curve used to link the measured fluorescent intensity to the produced amount of fluorescein.
EXPERIMENTAL
Device preparation
Although all materials used for fabrication are biocompatible, a preparation of the microfluidic device for the measurements is necessary. At the beginning, the device was flushed with 8:1 (H2O: Ethanol) solution for 2 min at a total flow rate of 10 μl/min to clean residuals from previous measurements. Subsequently, the channels were flushed with a 10 mg/ml bovine serum albumin (BSA) solution to inactivate the channel walls and prevent adhesion of the enzyme. Before the measurement, the channels were flushed with the same 8:1:1 (H2O: Ethanol: DMSO) solution that was also used for preparing the FDG stock solution.
Enzyme preparation
In solid form FDG is not very stable and has to be stored at −20 °C. A more stable 20 mM stock solution in a 1:1 mixture of (DMSO: ethanol) was prepared and also stored at −20 °C. For experiments, it was diluted with a 8:1:1 (H2O: DMSO: ethanol) solution to a concentration of 200 μM. β-galactosidase is also delivered at −20 °C as lyophilized powder with a concentration of approximately 140 U/mg. (One unit (U) corresponds to the amount of enzyme which hydrolyzes 1 μmol of substrate per minute.) Before the measurement, the enzyme is mixed with 200 μl ice-cold DI-water. To make sure all the enzyme is dissolved completely, it was vortexed and centrifuged several times. To keep reagent consumption to a minimum, syringes and tubings were filled with a 8:1:1 (H2O: DMSO: ethanol) solution. For the measurement, only 50 μl of enzyme and FDG solution is pumped into the fluid tubing.
Results and discussion
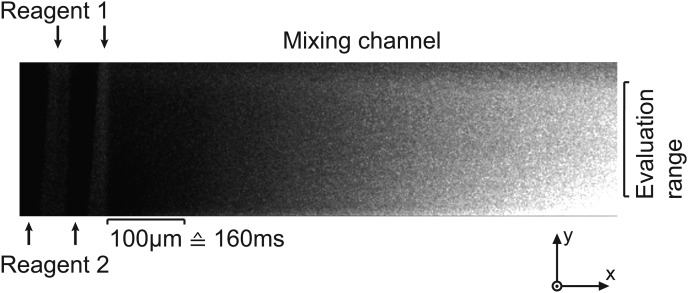
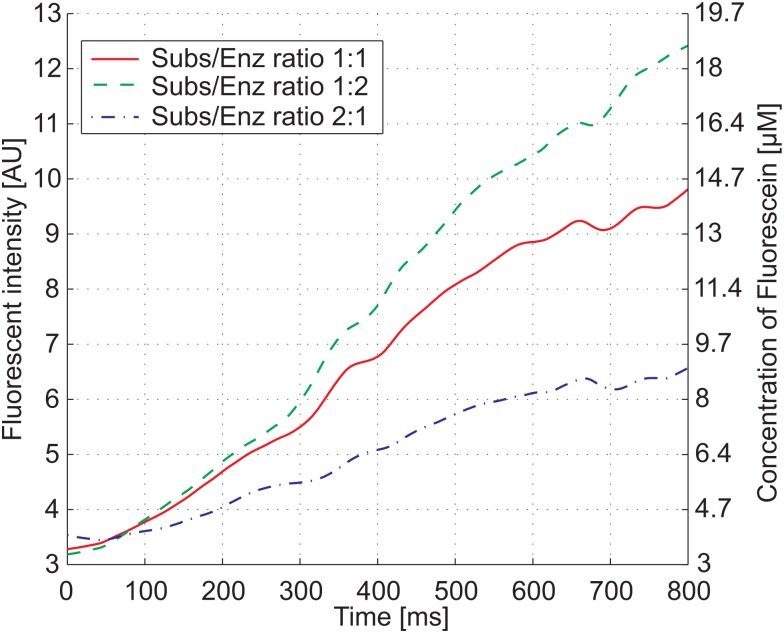
For the experiments, a pure enzyme concentration of 0.7 U/μl and an initial FDG substrate solution of 200 μM were used. Fig. 5 shows a greyscale photograph of the measurement in the mixing channel. The images were cropped at the sides to an evaluation range of 150 μm and processed with matlab. The reaction time was calculated from the distance in the mixing channel and the total flow rate. The fluorescent signal was integrated over the evaluation range to gain a two dimensional plot, as shown in Fig. 6. The total measurement time for the used total flow rate of 0.6 μl/min in the channel is about 800 ms with a time resolution of 500 μs.
Figure 5.
Greyscale image of the enzyme measurement with a concentration of 0.7 U/μl β-galactosidase and 200 μM FDG. The picture shows the hydrolysis of the non-fluorescent FDG (dark) to highly fluorescent fluorescein (bright) and galactose.
Figure 6.
Fluorescent signal of the pre-steady state kinetics of FDG after it is hydrolyzed by β-galactosidase. In the measurement, the ratio between substrate and enzyme was varied resulting in different concentrations (see Table TABLE I.). The left y-axis shows the measured fluorescent intensity, while the right y-axis shows the amount of fluorescein present in the channel.
By the hydrolysis of 1 μM of non-fluorescent FDG, the same concentration of fluorescein is formed which is measured during the experiment. A calibration curve, recorded with defined values of fluorescein, was averaged over 20 measurements; see Fig. 4b. A linear trend-line was fitted to the measured values and is used to link the fluorescent intensity to a concentration of fluorescein. A fluorescent intensity of 10 AU in the experiments corresponds to about 10% of the total FDG present. This shows that the recorded kinetics is in the pre-steady state.
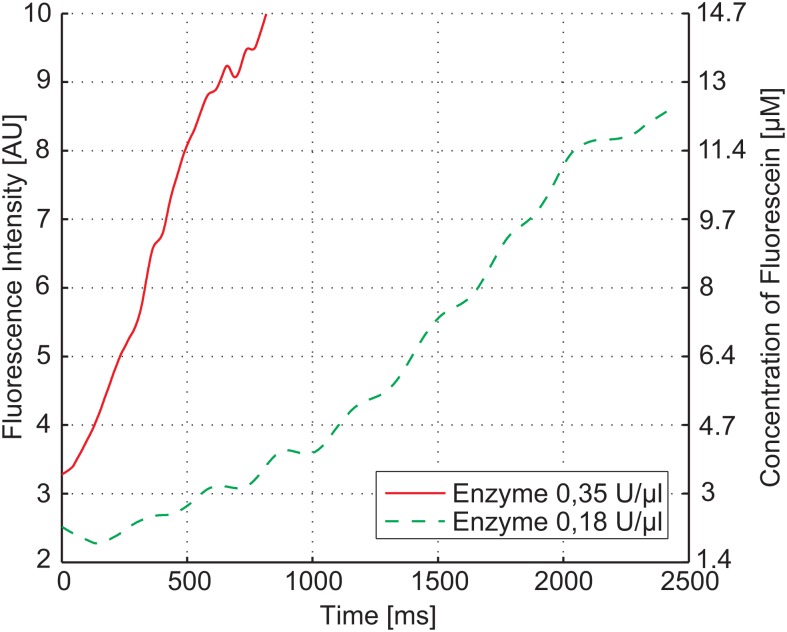
Three different curves were recorded by changing the flow rate ratio between substrate and enzyme, while the total flow rate was kept constant, see Table TABLE I.. The resulting measurement in Fig. 6 shows the kinetics for the three enzyme-substrate combinations. Additionally, the total observation time of the enzyme reaction could be varied by modifying the total flow rate in the mixing channel. In such a second measurement series, an initial enzyme concentration of 0.35 U/μl was used. With these two measurements, it is possible to compare the reaction of two different enzyme concentrations with the same amount of substrate, see Fig. 7. The difference in the recorded measurement time results from different total flow rates in the channel. The slower enzyme reaction was driven with a flow rate of 0.3 μl/min, whereas the faster one was recorded with 0.6 μl/min. The non-linear increase at the beginning of the measurement shows the pre-steady state of the enzyme reaction before the equilibrium, i.e., a constant rate of product formation is reached.
TABLE I.
Calculated enzyme and substrate concentrations resulting from varying the flow rate ratio between substrate and enzyme for an initial enzyme concentration of 0.7 U/μl.
| Flow rate ratio | Enzyme (U/μl) | Substrate (μM) |
|---|---|---|
| 1:1 | 0.35 | 100 |
| 2:1 | 0.47 | 67 |
| 1:2 | 0.23 | 133 |
Figure 7.
Pre-steady state measurement of β-galactosidase with a substrate concentration of 100 μM and two different enzyme concentrations of 0.35 U/μl and 0.175 U/μl. The left y-axis shows the measured fluorescent intensity, while the right y-axis shows the amount of fluorescein present in the channel. By varying the enzyme concentration the rate of hydrolysis and hence the speed of the reaction can be adjusted.
CONCLUSIONS
A multilaminar continuous flow mixer that enables the investigation of the dynamics of biochemical reactions up to 2.5 s reaction time and a resolution of 500 μs, has been presented. A wide operating range of flow rates (0.3 μl/min up to 30 μl/min) makes it possible to adjust the observed time range in the reaction channel. The formation of horizontal fluid layers, which enable very fast mixing, were proven by confocal fluorescence measurements. By varying the inlet flow rates of the reagents, different substrate/enzyme concentrations can be investigated in one measurement cycle. This makes the device a versatile tool for investigating enzyme reactions.
ACKNOWLEDGMENTS
For the device fabrication, we would like to thank E. Svasek and P. Svasek of the Sensor Technology Lab at the Vienna University of Technology. We gratefully acknowledge financial support of this project by BMVIT, BMWFJ and the federal provinces of Carinthia and Styria within the COMET—Competence Centers for Excellent Technologies Program.
References
- Hinsmann P., Frank J., Svasek P., Harasek M., and Lendl B., Lab Chip 1, 16 (2001). 10.1039/b104391a [DOI] [PubMed] [Google Scholar]
- Lipman E., Schuler B., Bakajin O., and Eaton W., Science 301, 1233 (2003). 10.1126/science.1085399 [DOI] [PubMed] [Google Scholar]
- Hardt S., Drese K. S., Hessel V., and Schönfeld F., Microfluid. Nanofluid. 1, 108 (2005). 10.1007/s10404-004-0029-0 [DOI] [Google Scholar]
- Nguyen N. and Wu Z., J. Micromech. Microeng. 15, R1 (2005). 10.1088/0960-1317/15/2/R01 [DOI] [Google Scholar]
- Lee C.-Y., Chang C.-L., Wang Y.-N., and Fu L.-M., Int. J. Mol. Sci. 12, 3263 (2011). 10.3390/ijms12053263 [DOI] [PMC free article] [PubMed] [Google Scholar]
- Hossain S., Ansari M. A., and Kim K.-Y., Chem. Eng. J. 150, 492 (2009). 10.1016/j.cej.2009.02.033 [DOI] [Google Scholar]
- Chen L., Wang G., Lim C., Seong G. H., Choo J., Lee E. K., Kang S. H., and Song J. M., Microfluid. Nanofluid. 7, 267 (2009). 10.1007/s10404-008-0386-1 [DOI] [Google Scholar]
- Park J. M., Seo K. D., and Kwon T. H., J. Micromech. Microeng. 20, 015023 (2010). 10.1088/0960-1317/20/1/015023 [DOI] [Google Scholar]
- Cortes-Quiroz C. A., Zangeneh M., and Goto A., Microfluid. Nanofluid. 7, 29 (2009). 10.1007/s10404-008-0355-8 [DOI] [Google Scholar]
- Kauffmann E., Darnton N., Austin R., Batt C., and Gerwert K., Proc. Natl. Acad. Sci. U.S.A. 98, 6646 (2001). 10.1073/pnas.101122898 [DOI] [PMC free article] [PubMed] [Google Scholar]
- Burke B. J. and Regnier F. E., Anal. Chem. 75, 1786 (2003). 10.1021/ac026173j [DOI] [PubMed] [Google Scholar]
- Kakuta M., Hinsmann P., Manz A., and Lendl B., Lab Chip 3, 82 (2003). 10.1039/b302295a [DOI] [PubMed] [Google Scholar]
- Aoki N., Hasebe S., and Mae K., Chem. Eng. J. 101, 323 (2004). 10.1016/j.cej.2003.10.015 [DOI] [Google Scholar]
- Buchegger W., Wagner C., Lendl B., Kraft M., and Vellekoop M., Microfluid. Nanofluid. 10, 889 (2011). 10.1007/s10404-010-0722-0 [DOI] [Google Scholar]
- Haswell S. J. and Skelton V., TrAC, Trends Anal. Chem. 19, 389 (2000). 10.1016/S0165-9936(00)00012-1 [DOI] [Google Scholar]
- McMullen J. P. and Jensen K. F., Annu. Rev. Anal. Chem. 3, 19 (2010). 10.1146/annurev.anchem.111808.073718 [DOI] [PubMed] [Google Scholar]
- Miyazaki M. and Maeda H., Trends Biotechnol. 24, 463 (2006). 10.1016/j.tibtech.2006.08.002 [DOI] [PubMed] [Google Scholar]
- Bleul R., Ritzi-Lehnert M., Hth J., Scharpfenecker N., Frese I., Dchs D., Brunklaus S., Hansen-Hagge T., Meyer-Almes F.-J., and Drese K., Anal. Bioanal. Chem. 399, 1117 (2011). 10.1007/s00216-010-4446-5 [DOI] [PubMed] [Google Scholar]
- Seong G. H., Heo J., and Crooks R. M., Anal. Chem. 75, 3161 (2003). 10.1021/ac034155b [DOI] [PubMed] [Google Scholar]
- de Boer A. R., Letzel T., van Elswijk D. A., Lingeman H., Niessen W. M. A., and Irth H., Anal. Chem. 76, 3155 (2004). 10.1021/ac035380w [DOI] [PubMed] [Google Scholar]
- Jung S.-Y., Liu Y., and Collier C. P., Langmuir 24, 4439 (2008). 10.1021/la800053e [DOI] [PubMed] [Google Scholar]
- Chen W. W., Niepel M., and Sorger P. K., Genes Dev. 24, 1861 (2010). 10.1101/gad.1945410 [DOI] [PMC free article] [PubMed] [Google Scholar]
- Buchegger W., Wagner C., Lendl B., Kraft M., and Vellekoop M., Sens. Actuators B 159, 336 (2011). 10.1016/j.snb.2011.06.083 [DOI] [Google Scholar]
- Wagner C., Buchegger W., Vellekoop M., Kraft M., and Lendl B., Anal. Bioanal. Chem. 400, 2487 (2011). 10.1007/s00216-010-4643-2 [DOI] [PubMed] [Google Scholar]
- Wallenfels K. and Weil R., The Enzymes, edited by Boyer P. D. (Academic Press, New York, 1972), 3rd ed, Vol 7, pp. 617–663. [Google Scholar]
- Beckwith J. R., Science 156, 597 (1967). 10.1126/science.156.3775.597 [DOI] [PubMed] [Google Scholar]
- Jiang T., Xing B., and Rao J., Biotechnol. Genet. Eng. Rev. 25, 41 (2008). 10.5661/bger-25-41 [DOI] [PubMed] [Google Scholar]
- Jacob F. and Monod J., J. Mol. Biol. 3, 318 (1961). 10.1016/S0022-2836(61)80072-7 [DOI] [PubMed] [Google Scholar]
- Karlsson U., Koorajian S., Zabin I., Sjöstrand F. S., and Miller A., J. Ultrastruct. Res. 10, 457 (1964). 10.1016/S0022-5320(64)80022-8 [DOI] [PubMed] [Google Scholar]
- Marchesi S. L., E.Steers, Jr., and Shifrin S., Biochim. Biophys. Acta 181, 20 (1969). [DOI] [PubMed] [Google Scholar]
- Huber R. E., Kurz G., and Wallenfels K., Biochemistry 15, 1994 (1976). 10.1021/bi00654a029 [DOI] [PubMed] [Google Scholar]
- Fiedler F. and Hinz H., Eur. J. Biochem. 222, 75 (1994). 10.1111/j.1432-1033.1994.tb18843.x [DOI] [PubMed] [Google Scholar]
- Jacobson R. H., Zhang X.-J., DuBose R. F., and Matthews B. W., Nature (London) 369, 761 (1994). 10.1038/369761a0 [DOI] [PubMed] [Google Scholar]
- Okamoto Y., Monjushiro H., Fukumoto T., and Watarai H., Anal. Bioanal. Chem. 385, 1430 (2006). 10.1007/s00216-006-0551-x [DOI] [PubMed] [Google Scholar]
- Tan W.-H. and Takeuchi S., Lab Chip 6, 757 (2006). 10.1039/b517178d [DOI] [PubMed] [Google Scholar]
- Huang Z., Biochemistry 30, 8535 (1991). 10.1021/bi00099a006 [DOI] [PubMed] [Google Scholar]


