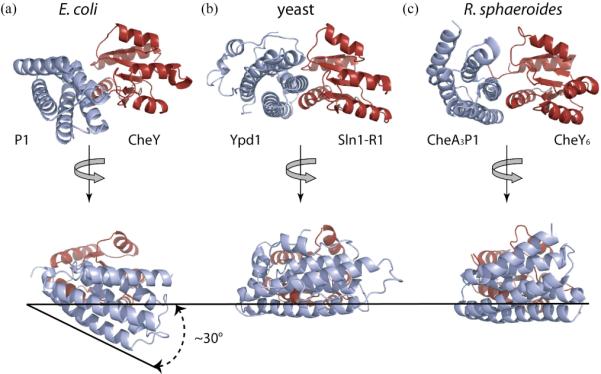
Figure 9.

(a) (b) (c). Comparison of the E. coli P1-CheY complex (a) with the yeast Ypd1-Sln1(R1) complex (b) and the R. sphaeroides CheA3P1-CheY6 complex (c). The HPt domains are in light blue, and the RR domains, in red, are held constant to show the difference in the relative orientation of the two domains among these structures. E. coli P1 appears to be rotated downward (~30°) compared to yeast Ypd1 and R. sphaeroides CheA3P1 such that the top of the active site surface of CheY is more exposed in the E.coli model (bottom figures). The extent of rotation was estimated by comparing the orientation of E.coli P1 α1 to its equivalent helices in the other two structures.
