Abstract
Our group has constructed the small animal radiation research platform (SARRP) for delivering focal, kilo-voltage radiation to targets in small animals under robotic control using cone-beam CT guidance. The present work was undertaken to support the SARRP’s treatment planning capabilities. We have devised a comprehensive system for characterizing the radiation dosimetry in water for the SARRP and have developed a Monte Carlo dose engine with the intent of reproducing these measured results. We find that the SARRP provides sufficient therapeutic dose rates ranging from 102 to 228 cGy min−1 at 1 cm depth for the available set of high-precision beams ranging from 0.5 to 5 mm in size. In terms of depth–dose, the mean of the absolute percentage differences between the Monte Carlo calculations and measurement is 3.4% over the full range of sampled depths spanning 0.5–7.2 cm for the 3 and 5 mm beams. The measured and computed profiles for these beams agree well overall; of note, good agreement is observed in the profile tails. Especially for the smallest 0.5 and 1 mm beams, including a more realistic description of the effective x-ray source into the Monte Carlo model may be important.
1. Introduction
Recently there has been much interest in the radiation research community surrounding the use of more sophisticated radiation devices for pre-clinical studies in the small animal laboratory setting. The basic paradigm is that these new devices better mimic the technologies available to humans in the modern radiotherapy clinic. In addition to ours, several groups are actively building the first-generation devices, including Graves et al (2007) (Stanford University, CA), Stojadinovic et al (2007) (Washington University, MO) and Jaffray et al (2006) (Princess Margaret Hospital, Ontario).
Previously, our group has reported on progress with the small animal radiation research platform (SARRP), which is a novel and complete system capable of delivering multi-directional (focal), kilo-voltage radiation fields to targets in small animals under robotic control using cone-beam CT (CBCT) image guidance (Wong et al 2007). We have demonstrated that, with our platform, we can routinely and efficiently acquire volumetric CBCT datasets with 0.55 mm cubed voxels; meanwhile, our robotically controlled delivery system has been rigorously calibrated to target CBCT-imaged objects to sub-millimeter precision. A focal, multi-beam phantom irradiation experiment has demonstrated that we can target a CBCT-imaged object to within 0.2 mm (Matinfar et al 2009).
Delivery precision notwithstanding, the challenges associated with designing the radiation sources for these devices, and measuring and predicting their radiation dosimetry, are uniquely difficult. The smaller target geometries and avoidance constraints in the animal laboratory setting ultimately demand sharp radiation penumbrae; therefore, a consensus emerging from the community is the need for low-energy or diagnostic x-ray tube sources. Such sources have the advantages of programmable and stable output, but potentially suffer from issues such as the dose rate and the heel effect. Moreover, tissue heterogeneity, most notably bone attenuation, is very important at these x-ray energies. It is generally accepted that Monte Carlo (MC)-based treatment planning platforms must be developed to support the more complex, individualized, conformal radiation experiments under consideration.
The aims of the present study are (1) to develop a comprehensive system for measuring dosimetric data for the SARRP and, (2) by way of comparison with measured data, to introduce the MC engine that will ultimately be used to support the radiation treatment planning capabilities currently under development. The former has involved the building and testing of a commissioning apparatus to facilitate radiation measurements in water phantom as well as developing custom distributable software to analyze the set of measured data. The radiation measurements serve as the basis for benchmarking and calibrating our MC dose engine, to be described.
2. Materials and methods
2.1. SARRP overview
Figure 1 highlights the components of the latest working version of the SARRP. As has been described previously (Wong et al 2007), the system comprises a constant-voltage, dual-focus (0.4 and 3 mm spot sizes), 225 kVp source (GE ISOVOLT 225 M2, Lewistown, PA) mounted on a rotating arm; a set of robotic stages providing four degrees of freedom (x, y, z, φz) used in positioning the animal; and a 512 × 512 amorphous Si flat panel detector (20 × 20 cm2). Oriented orthogonal to the flat-panel imaging system is a digital fluoroscopic camera box used for taking anterio-posterior (or vice versa) radiographs, to be potentially used in conjunction with lateral radiographs from the flat panel detector. This latter imaging capability was developed for experiments not requiring CBCT-based image guidance.
Figure 1.
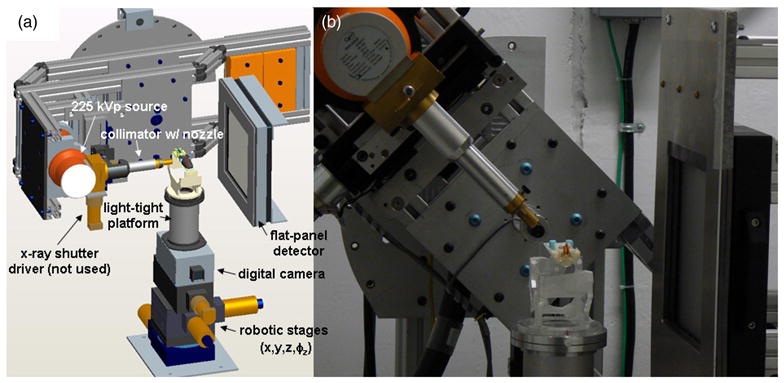
(a) Design rendering and (b) photo of the latest working version of the SARRP. The system comprises a constant-voltage, dual-focus, 225 kVp source mounted on a rotating arm, a collimation system with interchangeable nozzles, a set of robotic stages for positioning the animal, an amorphous Si flat panel detector and a digital fluoroscopic camera box.
2.2. SARRP beam collimation and filtration
Figure 2 shows the high-precision beam collimation system that will be the focus of the present work. The collimating components, or those that the primary x-ray beam impinges upon, are made of brass. Mostly aluminum is used for all other components. Mechanical stability of this system was maximized by mounting the collimator directly to the exit flange, or intrinsic collimator, of the x-ray tube with a special pin-hole fitting at the interface for rigidity and reproducibility. It has been designed to be strongly self-shielding, as no primary x-rays can escape the system without first traversing at least 25 mm of brass. Generally, the constraint that no upstream components shadow the primary beam from downstream components was imposed. The downstream face of the last field-shaping ‘nozzle’ collimator is nominally located at 30 cm from the presumed source of the x-ray tube. With the nominal source-to-isocenter distance of 35 cm, this collimator design minimizes the geometric radiation penumbrae.
Figure 2.
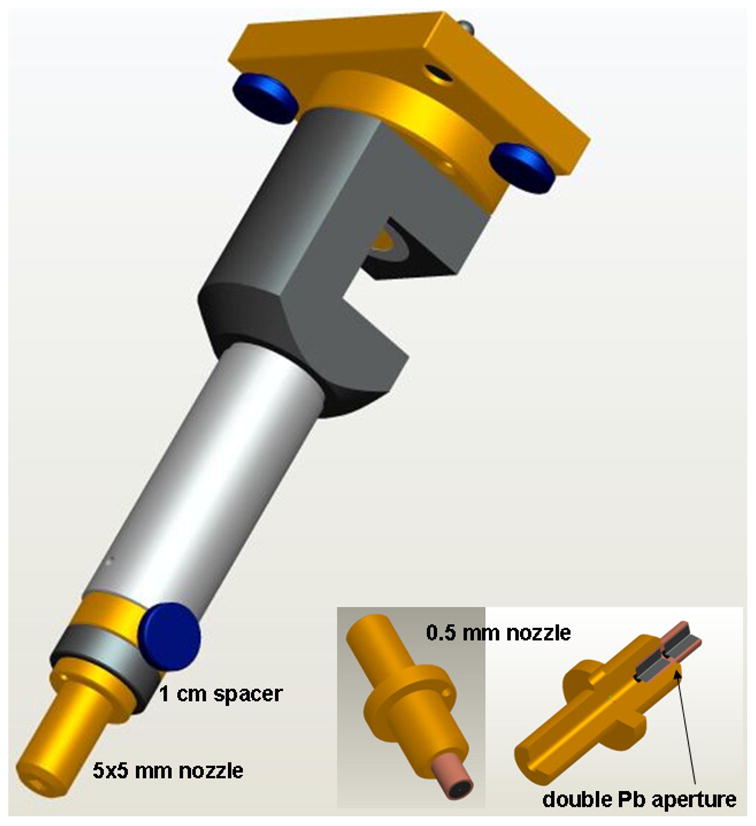
Design rendering of the high-precision beam collimation system for the SARRP. The collimating components are made of brass. Aluminum is used elsewhere. The downstream edge of the last field-shaping ‘nozzle’ collimator is located at 30 cm from the presumed source of the x-ray tube (but can be extended to 31 cm with the indicated spacer). Interchangeable nozzles provide different rectangular or circular radiation fields. A special design incorporating lead for the final aperture was used for the smallest 0.5 mm collimator, shown in the lower-right insert.
Multiple, interchangeable nozzles provide rectangular radiation fields of 10 × 5, 5 × 5 and 3 × 3 mm2 or circular fields of 1.16 and 0.58 mm in diameter as scaled to 35 cm from the source. (The latter two field sizes will be referred to as 1 and 0.5 mm in the remainder of this report.) A special design was required for the smallest collimator. In this case, a double-aperture design comprising lead was used, minimizing the thickness of material required to be accurately machined (see figure 2).
Filtration is used to remove the low-energy contamination in the x-ray spectrum. Intrinsically, the x-ray tube incorporates 1 mm of beryllium filtration as an exit window. For the treatment of mice and rats, balancing beam hardening against dose rate, we have initially chosen to incorporate additional copper filtration of either 0.16 or 0.25 mm in thickness. Results for both will be presented.
2.3. Commissioning device
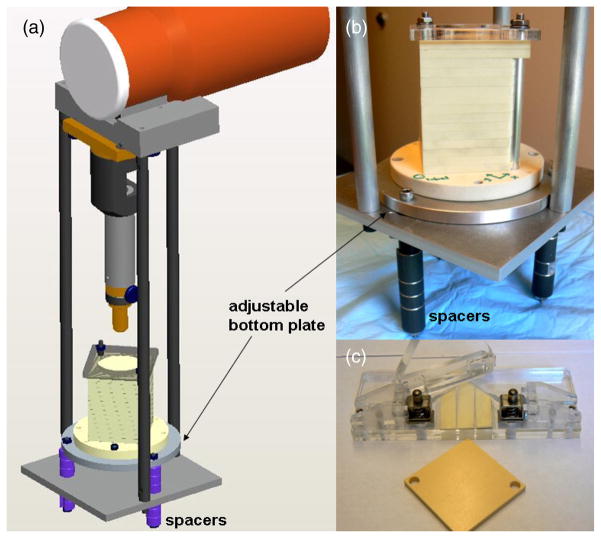
Figure 3 shows the commissioning jig, phantom assembly and related equipment that was designed and built for the SARRP. Using this system, exposed EBT films, which are sandwiched between layers of 5 mm thick kV-equivalent solid water (CIRS, Norfolk, VA), are rigidly indexed to the beam axis by way of bisecting aluminum rods. A custom film hole puncher, also shown, was constructed for this purpose. The phantom dimensions are 6 cm × 6 cm × 8 cm, the latter dimension being the maximum depth. The circular bottom plate of the phantom was constructed of solid water, assuring that the distribution of back-scattered photons is water-equivalent to the last depth sampled. The bottom aluminum plate of the jig can slide along the beam axis, its position being determined by the configuration of precisely machined spacers. This allows variable source-to-surface (SSD) distances; the system can sample SSDs between 32 and 38 cm, in increments of 5 mm.
Figure 3.
The commissioning jig, 6 × 6 × 8 cm cubed plastic water phantom assembly and related equipment. Using this system, EBT films are sandwiched between layers of 5 mm thick, kV-equivalent plastic water and are rigidly indexed to the beam axis. A custom film hole puncher (c) was constructed for this purpose. Note that the indicated bottom plate of the jig can slide along the vertical beam axis, its position being determined by the configuration of the spacers (a and b). This allows that the source-to-surface distance (SSD) be varied.
2.4. EBT film dosimetry
Gafchromic EBT film (International Specialty Products, Wayne, NJ) is used for dosimetric measurements. It has been shown that EBT film is ideal for two-dimensional (2D) dose measurements for lower energies because of its energy independence and high sensitivity (see, e.g. Devic et al (2005) and references therein). Our EBT dosimetry protocol is similar to that described by Devic et al (2005). EBT films were scanned as 48 bit RGB (16 bits per color) TIFF images at 400 or 600 dpi resolution with a professional-grade flatbed scanner (Epson Expression 10000 XL). The lower scanning resolution was employed for the larger beams, whereas 600 dpi was used exclusively for the 0.5 mm aperture. Only transmission data from the red channel was evaluated, as per standard EBT protocol. Using a modified version of the template (provided with the scanner), films were (re-)positioned for scanning with the scanning direction being consistent for all with respect to the orientation of the uncut film. The films were scanned prior to and at least 24 h post-irradiation. At both time points, an average was taken over three consecutive scans to reduce the random or sampling noise. All nine films (depths) for a given phantom setup could be scanned simultaneously with the aforementioned template.
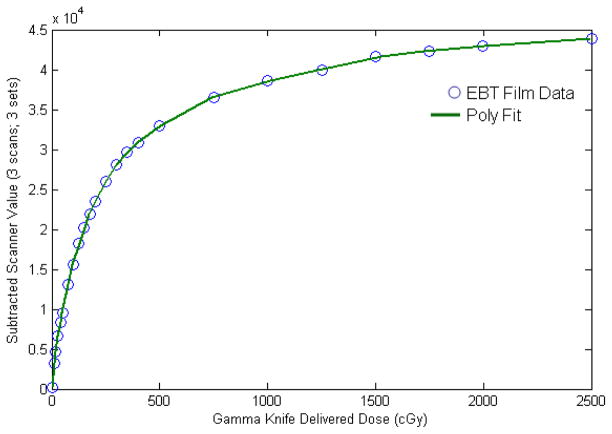
To calibrate our batch of EBT, three films were exposed simultaneously to 60Co gamma rays for each of 23 different exposure times spanning doses between 0 and 25 Gy using the Gamma Knife, Model C (Elekta AB, Stockholm, Sweden). In total 69 films were used. The films were positioned at the Gamma Knife focus using the standard (16 cm diameter) polystyrene calibration phantom. The exposure time of the films was related to dose, as monitored by the clinical calibration protocol in use at our institution for the Gamma Knife (AAPM Task Group 21, 1983). The difference in scan-averaged pixel values, before and after exposure, was correlated to the radiation dose corresponding to each exposure time, averaging over the three films which had been exposed simultaneously. A 12th-order polynomial fit well described the data over its range, except in the extreme low-dose region (0–11 cGy), where a linear fit was smoothly matched. The scanning direction with respect to the uncut films was consistent with that used for the experimental measurements.
The result of this calibration process is shown in figure 4. An important feature is that the relationship between dose and detected transmission (scanner) value gives rise to noise amplification that is increasingly important for doses that are outside of the more ‘linear’ response range (approximately 0–3 Gy). For the peak doses sampled in this set of measurements (>10 Gy), the noise amplification factor was greater than 5 in some cases. Therefore, the measured results are more prone to statistical sampling error at the shallower depths sampled, especially for the larger apertures.
Figure 4.
The result of the EBT film calibration process. 69 films were irradiated with doses (or exposure times) spanning from 0 to 25 Gy using a Gamma Knife (60Co) irradiator. Data points: the difference in scan-averaged transmission values, before and after radiation exposure, was correlated to the known radiation dose, averaging over three films which had been exposed simultaneously. Line: A 12th-order polynomial fit described the data well, except in the extreme low-dose region (0–11 cGy), where a linear fit was smoothly matched.
All image processing was implemented in MATLAB (The MathWorks, Inc., Natick, MA). Functions were written to perform the following tasks: (1) apply a gain correction to the scan-averaged image for y-pixel location based on a polynomial fit to the flood-field (blank template) scans; (2) convert the pre- and post-exposure differences for each individual film to planar dose; (3) threshold post-exposure image and automatically segment the punched holes for each film to determine their locations in a reference coordinate system defined by the beam axis; (4) apply the indicated transformations to each of the measured planar dose images; (5) automatically tabulate results in terms of obtained radiation profiles, peak and region-averaged dose rates and penumbra widths—these results can be output in Microsoft Excel format for simple reference by SARRP users requiring simplified radiation descriptions for their laboratory studies.
EBT film sets, or stacks, were exposed for 4, 6 or 8 min, depending on the field size, under maximal tube current (13 mA) and potential (225 kVp). The larger focal-spot setting was used for all measurements. Two SSDs, 34 and 38 cm, were sampled for 0.16 mm Cu filtration—for the latter the 5 × 10 mm nozzle was not measured. One SSD (34 cm) and a subset of collimators were sampled for 0.25 mm Cu filtration, namely the 1 mm, 3 × 3 mm2 and 5 × 5 mm2 apertures. In total, 12 sets of exposures, each recording nine film depths (therefore 108 films in total) were included in the present analysis.
2.5. Monte Carlo modeling
BEAM is the basis for our MC modeling (Rogers et al 1995). We have installed the BEAMnrc multi-platform package (GUI version, revision 1.10) on a Linux server (64 bit, quad-core processor 4 × 1.86 GHz) running SUSE Enterprise Server Edition, v10 (Novell, Inc., Waltham, MA). BEAM is advantageous in that the user can ‘build’ an ‘accelerator’ using an arbitrary arrangement of pre-defined geometrical elements (collimators, targets, filters) or ‘component modules’ (CMs) (Verhaegen and Seuntjens 2003, Verhaegen et al 1999). Our MC model considers all physical processes which are important at these low energies, namely bremsstrahlung radiation (for photon production in the target as well as throughout the geometry), bound Compton scattering, Rayleigh scattering, electron impact ionization and fluorescent atomic relaxation following photo-electric absorption. Full electron transport was only carried out in the target, filter and a subset of the collimating apertures. Bremsstrahlung yields were taken from the NIST library (Seltzer 1989); XCOM photon cross sections were used (Berger and Hubbell 1987).
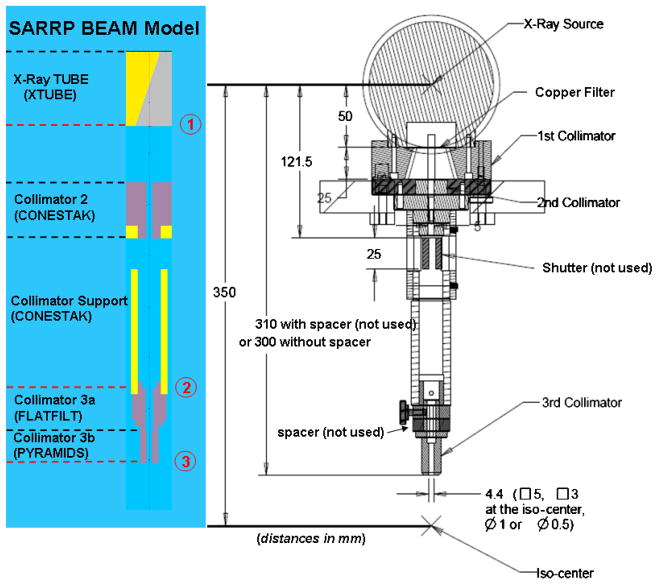
Figure 5 shows a cut view in the gun-target (G-T)–z plane of the CMs which together comprise the BEAM model for the SARRP source and collimators. With the set of available CMs, it was not possible to incorporate exact geometries for all components of the SARRP collimator design, nor was this necessary. Rather, the goal was to closely approximate the system geometrically and show that this model could adequately reproduce the set of measured data.
Figure 5.
Right: the SARRP x-ray source and collimator design rendered in the A–B–z plane for the 5 × 5 nozzle. Note that collimator 3 is interchangeable, depending on the desired field size. Left: corresponding SARRP BEAM Monte Carlo model in the G-T–z plane, indicating the types and locations of the incorporated component modules (CMs). The CMs labeled Collimator 3a and 3b differed depending on the field size simulated. A large phase-space file generated at the labeled z-location 1, at the exit of the x-ray tube, was used as input for the second-stage simulations, which incorporated the different choice of Cu filtration. These secondary phase-space files, sampled at z-location 2, were then used as input in the tertiary or final simulations which computed phase-space files at z-location 3; in the final simulations, Collimators 3a and 3b were varied.
A large ‘phase-space’ file (PSF) containing energy, position and history information for simulated particles was first generated or sampled from the indicated z-location 1, at the exit of the x-ray tube (X-TUBE CM). This CM included the geometry for the SARRP source, namely the 20°, 1 mm tungsten target with a parallel, rectangular electron beam providing an effective 3 mm × 3 mm x-ray source. 30 × 109 electron histories were simulated. Uniform bremsstrahlung splitting with a splitting factor of 300 was used for efficiency in generating the photons of interest.
This primary PSF was then used as the generator for the second-stage simulations, which allowed for the different choices of Cu filtration, 0.16 or 0.25 mm. Finally, these secondary PSFs, sampled at z-location 2, were used as input in the tertiary simulations which sampled particle phase space at z-location 3, at the exit of the given nozzle, each of which comprises two CMs, collimators 3a and 3b. Note that the indicated PYRAMIDS CM for collimator 3b only accommodates square-field nozzles whereas a CONESTAK CM was required for the two circular apertures (0.5 and 1 mm).
Depth–dose information was extracted from the tertiary simulations by inserting a water-filled CHAMBER CM into the geometry at the requisite SSD. The cross-sectional diameter of the active central region was set to correspond to the size of the dose averaging regions on the EBT films in the measurements. Likewise, the active dose-scoring layers of the CHAMBER were defined at the same depths as the measurements. In the simulations, the ‘film’ layers had 1 mm thicknesses to augment statistics, compared with approximately 0.2 mm actual film thicknesses5.
For dose-profile comparisons with measurement, simulations of 3D (voxelized) dose-deposition in water were carried out for a subset of the measured data using DOSXYZnrc (Walters et al 2006). For these, final PSFs sampled from z-location 3 within the tertiary BEAM simulations were used as input. The resolution of the calculation grid was either 0.0625 mm squared (0.5 and 1 mm nozzles) or 0.250 mm squared (all others) transverse to and 1 mm along the beam axis.
For the tertiary simulations, each particle from the PSF (at z-location 2) was recycled 99 times to improve dose-computation statistics6. Additionally, for the DOSXYZ simulations, the input parameter ISMOOTH was set to ‘1’, which allows that each particle in the phase-space file be used a total of four times, with its x, y starting position and trajectory in the scoring plane being recursively mirrored over four quadrants7.
3. Results
3.1. Water phantom measurements with the SARRP commissioning jig
Table 1 summarizes the measured dose rates for a subset of measured depths, namely 1.03, 2.07, 4.11 and 6.15 cm (a), and provides the 20–80% penumbrae for the films at 1.03 cm depth (b), chosen arbitrarily. Reported dose rates for the 3 × 3, 5 × 5 and 5 × 10 mm2 collimators are averages within a square region measuring 1.77 mm squared (29 × 29 square pixels). The errors provided correspond to the observed 1σ variation in this averaging region. The smallest two collimators exhibit a peaked, rather than flat, dose distribution and therefore a peak dose rate is reported without an associated statistical error. The measured dose rates at the applicable depth are clearly high enough so as to appropriately mimic dose rates achievable in human radiotherapy. The reported penumbrae in table 1(b) are averages from profiles in both x and y and clearly exhibit noteworthy sharpness. A variation with field size is observed; this effect is consistent with an increasing physical penumbra with aperture size8. Compared with the measured dose rate for the 5 × 5 mm2 nozzle, that for the 5 × 10 mm2 nozzle at the depth of 1.03 cm is lower than expected and is therefore suspect, since the remainder of the depths (films) for this collimator give similar results.
Table 1.
Summary of measured dose rates at a subset of measured depths (a) and 20–80% radiation penumbrae at a depth of 1.03 cm (b). Reported dose rates are averages within a square region measuring 1.77 mm squared (29 × 29 square pixels), although for the smallest two apertures the stated values are peak dose rates. Dose rate errors correspond to 1σ statistical variations over this averaging region, where applicable. Penumbra widths are average values between the x and y profiles.
| Depth | Collimator | 0.16 mm Cu filtration
|
0.25 mm Cu filtration | |
|---|---|---|---|---|
| SSD = 34 cm | SSD = 38 cm | SSD = 34 cm | ||
| (a) Dose rates (cGy min−1) | ||||
| 1.03 cm | 0.5 mm | 102 | 58.0 | – |
| 1.0 mm | 170 | 149 | 138 | |
| 3 × 3 mm | 222 (±7.4) | 174 (±4.2) | 164 (±4.3) | |
| 5 × 5 mm | 228 (±5.9) | 200 (±6.0) | 177 (±6.7) | |
| 5 × 10 mm | 207 (±5.4) | – | – | |
| 2.07 cm | 0.5 mm | 66.2 | 40.0 | – |
| 1.0 mm | 126 | 105 | 107 | |
| 3 × 3 mm | 167 (±5.6) | 134 (±3.9) | 124 (±3.6) | |
| 5 × 5 mm | 170 (±5.5) | 139 (±3.5) | 123 (±3.6) | |
| 5 × 10 mm | 170 (±4.8) | – | – | |
| 4.11 cm | 0.5 mm | 36.9 | 20.7 | – |
| 1.0 mm | 81.3 | 62.1 | 66.3 | |
| 3 × 3 mm | 96.2 (±2.2) | 81.2 (±2.2) | 79.4 (±2.2) | |
| 5 × 5 mm | 101 (±2.4) | 85.1 (±2.2) | 78 (±2.0) | |
| 5 × 10 mm | 105 (±2.7) | – | – | |
| 6.15 cm | 0.5 mm | 18.7 | 10.9 | – |
| 1.0 mm | 53.4 | 35.7 | 43.3 | |
| 3 × 3 mm | 63.2 (±1.4) | 49.9 (±1.1) | 49.4 (±1.1) | |
| 5 × 5 mm | 68.0 (±1.5) | 52.2 (±1.3) | 50.5 (±1.3) | |
| 5 × 10 mm | 65.0 (±1.9) | – | – | |
| (b) Average 20–80% penumbrae (mm) | ||||
| 1.03 cm | 0.5 mm | 0.17 | 0.19 | – |
| 1.0 mm | 0.22 | 0.35 | 0.24 | |
| 3 × 3 mm | 0.29 | 0.51 | 0.27 | |
| 5 × 5 mm | 0.30 | 0.49 | 0.32 | |
| 5 × 10 mm | 0.37 | – | – | |
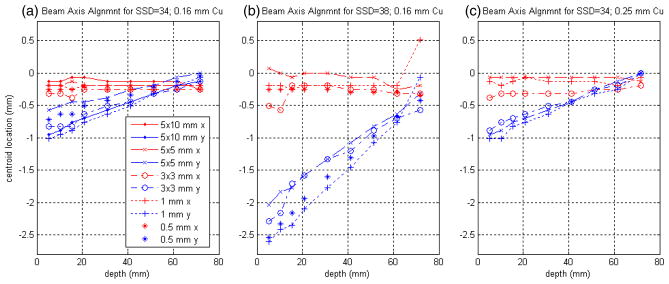
The accuracy and reproducibility of the mechanical alignment of the commissioning apparatus with the SARRP beam axis could be inferred from the measured data. Figure 6 summarizes the result of a MATLAB analysis indicating the x (red) and y (blue) locations of the beam-spot centroids in the registered coordinate system as a function of depth for the given film set. It is important to note that the sets of exposures for the left-most and right-most series of figure 6 were measured one after the other, whereas the middle series, for SSD = 38 cm, were measured lastly and required a change in the configuration of the spacers to change the SSD. This process clearly introduced a more-pronounced tilt to the phantom alignment than was originally present. Phantom-axis alignment aside, the fact that the x centroids are stable and the y centroids approach the theoretical beam axis at the largest depths (near the bottom of the phantom platform) seems to indicate that the support jig itself was aligned to the SARRP beam axis to within 0.5 mm over this range of depths.
Figure 6.
Correspondence of the SARRP commissioning jig z-axis with the physical beam axis, as indicated by the location of the measured beam spot on the registered films as a function of depth. Red and blue data points correspond to the observed beam-spot centroids in x and y, respectively. The film set exposures for (a) and (c) were measured one after the other, whereas (b), for SSD = 38 cm, was measured last and required a change in the configuration of spacers to change the SSD. (See text for further description).
3.2. Monte Carlo calculated results and comparisons with measured data
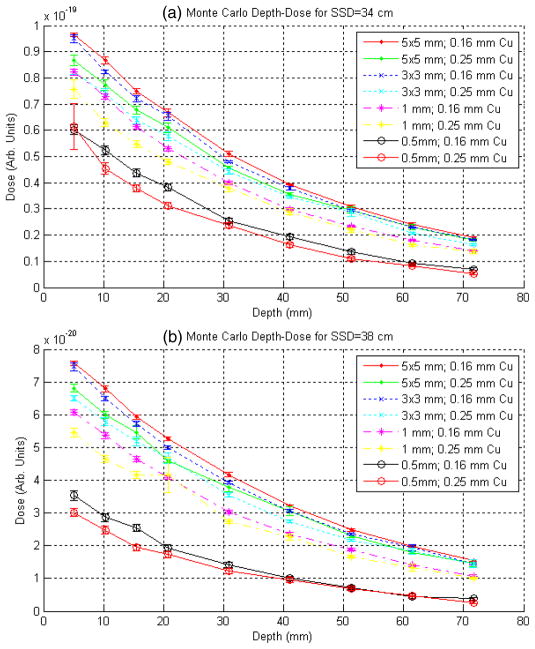
Figure 7 summarizes the BEAM results for depth–dose in water for the full set of simulated geometries using the CHAMBER CM description of the SARRP measurement phantom. The top and bottom plots show data for SSD of 34 cm and 38 cm, respectively. All simulations were seeded with the same PSF at the exit of the x-ray tube; thus, the relative relationship between the curves is meaningful9. The dose-scoring regions for the 5 × 5, 3 × 3, 1 mm and 0.5 mm collimators were cylinders with radii of 1, 1, 0.5 and 0.25 mm, respectively, all having lengths of 1 mm.
Figure 7.
Raw depth–dose curves in water from the Monte Carlo calculations for the full set of simulated geometries using the CHAMBER CM description of the measurement phantom. Plotted in (a) and (b), respectively, are the results for SSD = 34 and 38 cm. All simulations were seeded with the same primary PSF at the exit of the x-ray tube, thus the relative relationship between the curves is meaningful. The statistical error bars included here were computed by BEAM. (See the text for further description.)
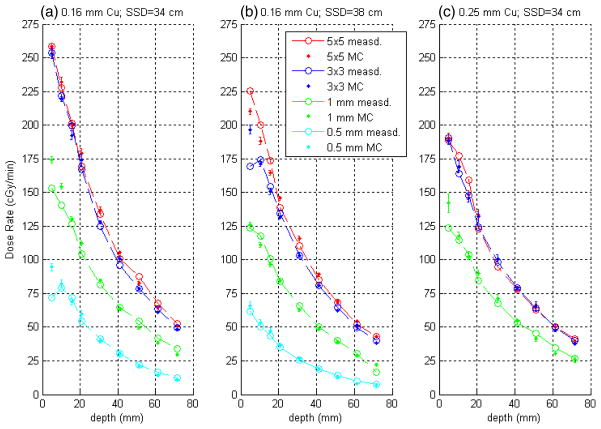
Figure 8 provides the comparison of measurement with these computed depth–dose curves for the SARRP. With the exception of the results from SSD = 34 cm and 0.16 mm Cu filtration for the 5 × 10 mm2 nozzle, the full set of measurements is shown. Plotted left to right are the data sets for SSD = 34 with 0.16 mm Cu, SSD = 38 with 0.16 mm Cu and SSD = 34 with 0.25 mm Cu filtration, respectively. Computed data have been normalized to measurement to best fit over the range of depths, giving equal weight to all depth points. For the measured results shown here, the areas of the dose-averaging regions on the films were matched to the cross-sectional areas of the active volumes for the BEAM simulations. Specifically, square regions of 1.77, 1.77, 0.89 and 0.44 mm squared were used for the 5 × 5, 3 × 3, 1 and 0.5 mm apertures, respectively.
Figure 8.
Comparison of measured and computed depth–dose curves for the SARRP. Plotted are (a) SSD = 34 with 0.16 mm Cu; (b) SSD = 38 with 0.16 mm Cu; (c) SSD = 34 with 0.25 mm Cu filtration. Measured data are plotted as open circles with Monte Carlo data plotted as points with statistical error bars computed by BEAM. Computed data have been normalized to measurement to best-fit over the range of depths.
Overall the agreement between measurement and BEAM is good. For the square apertures, including all data included in figure 8, for shallower depths (≤2.07 cm) the maximum percentage difference is 16.0% with a mean absolute percentage difference of 3.9%. For depths >2.07 cm, the maximum percentage difference is 6.2% with a mean absolute percentage difference of 2.9%. Again, this is explained in part by larger statistical uncertainty in the measured data for the highest dose exposures (as evident in table 1). Sources for systematic uncertainties, which are difficult to predict or quantify, include dust and scratches on individual films (introduced through cutting and handling), subtle warping of the film surface when positioned for scanning and (inadvertent) rotation of the films with respect to the intended scanning direction (the latter are perhaps the most important).
Given the expected sensitivity of the comparison for the smallest field sizes (0.5 and 1 mm nozzles) on the specific properties of the fluence distribution at the x-ray source, the depth–dose comparison is encouraging. Here we find that the mean of the absolute value of percentage differences over the full range of depths (for the sampled SSDs and filter combinations) is 7.2%.
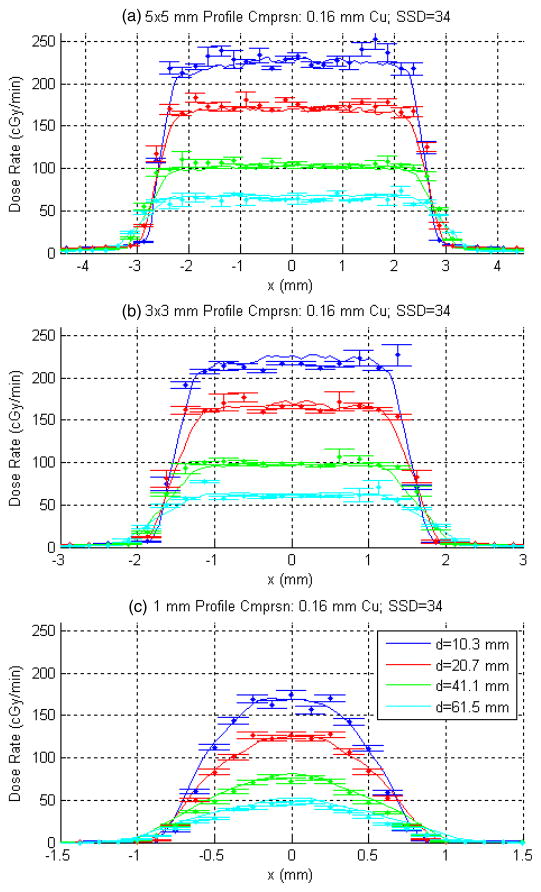
Figure 9 is a representative sampling of measured versus computed x-profiles for SSD = 34 cm and 0.16 mm Cu filtration. Four of nine measured depths, chosen arbitrarily, are shown. The 0.5 mm profiles are not shown, in part because of the dependence of the profile shape on the effective fluence at the source location, which has not been modeled. (More discussion on this will follow.) DOSXYZ was used to generate the computed profiles, with statistical error bars shown. The transverse resolution of the calculation grid was 0.06252 mm squared for the 1 mm and 0.250 mm squared for the 3 × 3 and 5 × 5 mm2 apertures with a parallel grid spacing of 1 mm. So as to better match the measured depths, these computed profiles have been linearly interpolated between the two transverse planes which straddled the measured depths. To reduce noise in both the measured and computed profiles, averaging was performed across neighboring pixel lines. To the extent possible given the DOSXYZ calculation grid, the widths of these averaging regions were matched. Experimentally, the widths were 1.33, 0.95 and 0.32 mm for the 5 × 5 mm2, 3 × 3 mm2 and 1 mm apertures, respectively.
Figure 9.
A sampling of measured (solid lines) versus computed x-profiles (points) for SSD = 34 cm and 0.16 mm Cu filtration for (a) 5 × 5 mm2, (b) 3 × 3 mm2 and (c) 1 mm collimators. Four of nine measured depths, chosen arbitrarily, are shown. DOSXYZ was used to generate the computed profiles, with statistical error bars shown. For a given aperture size, the computed results were normalized to measurement in the high-dose regions, giving equal weights to all depths (including those not shown) and applying a single scaling factor.
For a given aperture size, the computed results were normalized to measurement in the high-dose regions, giving equal weights to all depths (including those not shown) and applying a single scaling factor. Both the x and y directions were included in this normalization process. The high-dose regions were defined as including profile data points within 2, 1 and 0.5 mm from the central axis for the 5 × 5 mm2, 3 × 3 mm2 and 1 mm profiles, respectively.
Overall the agreement in figure 9 is quite good. The results between measurement and MC calculations outside of the field, in the tails of the profiles, agree to within 1 cGy min−1 for the 3 × 3 and 5 × 5 mm2 collimators. Discrepancies are observed for the 3 × 3 and 5 × 5 mm2 nozzles at the edges of the high-dose region, with the computed profiles displaying sharper penumbrae. This may be partly due to the noted differences in the effective source geometry and partly this is due to similar resolution of the measured radiation penumbrae and the calculation grid. For the 1 mm nozzle, the computed profiles are slightly more peaked. Discrepancies here can be expected due to the neighboring line-averaging process which is not perfectly matched (in terms of the averaging width) and also due to differences between the actual and simulated effective source distribution.
4. Discussion and outlook
4.1. Monte Carlo calibration
Based on the results presented here we are confident in the use of BEAM as our MC dose computation engine. The practical application of this system for RTP will require calibration of the DOSXYZ output. We anticipate that a nozzle-specific scaling factor can be applied to the voxelized 3D ‘dose’ output from DOSXYZ such that we effectively arrive at dose per minute of beam-on time knowing the number of phase-space histories run for any given simulation. The best case scenario would be that this scaling factor is independent of SSD, because this would imply that the calibration process for this platform would require a smaller set of benchmarking data—e.g. one phantom set at a single SSD for each combination of filtration and collimation. In the worst case scenario, it is a reasonable assumption that an SSD-dependent scaling factor can be derived for each aperture from benchmarking data acquired at two extreme SSDs, linearly interpolating to arrive at the scaling factor for any desired SSD in between.
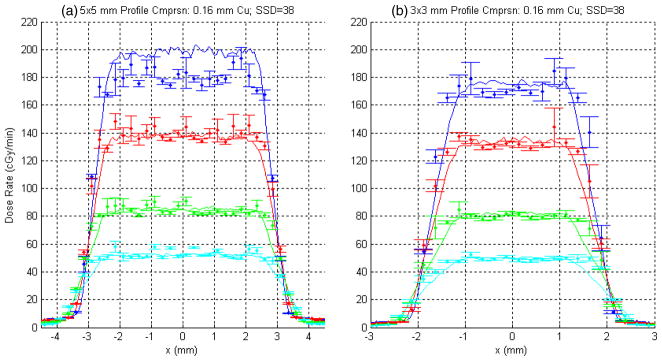
Figure 10 was generated to demonstrate this first DOSXYZ calibration concept, namely normalization using an SSD-independent scaling factor. The single scaling factors that were derived for each of the full set of depth profiles for the 5 × 5 and 3 × 3 mm2 apertures shown in figure 9 (SSD = 34 cm) have been applied to the corresponding data for the same collimator and filtration for an SSD of 38 cm. (Note that DOSXYZ simulations for a given collimator for the two different SSDs were seeded with the same PSF.) The concept seems to work, ignoring the systematic discrepancy associated with the 1 cm depth measurement for the 5 × 5 mm2 collimator. (Note this same discrepancy is evident in the depth–dose data plotted in figure 8(b).)
Figure 10.
Measured (solid lines) versus computed x-profiles (points) for SSD = 38 and 0.16 mm Cu filtration for (a) 5 × 5 mm2 and (b) 3 × 3 mm2. The same four depths from figure 9 are shown. Note that in this case the corresponding normalization factors derived from the profiles in figure 9 (SSD = 34 cm) were applied.
4.2. Focal-spot shape and intensity heterogeneities
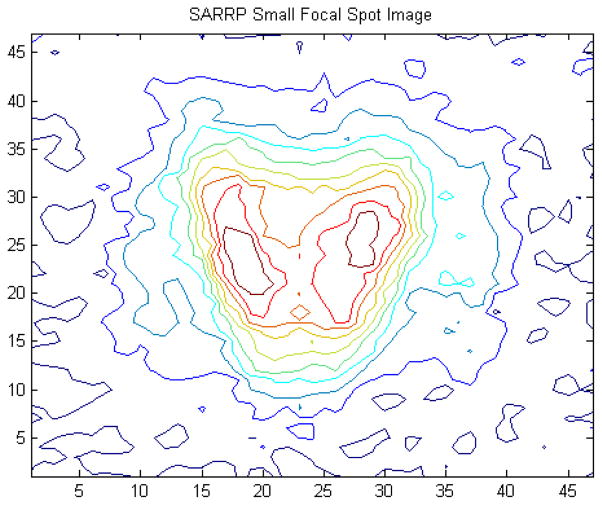
There have been several references in this report made to the dependence of the comparisons between measurement and MC on the details of the effective focal-spot photon fluence distribution. This problem becomes more important as the aperture size is reduced, because the fluence distribution at the exit of the aperture, to an extent, will mirror that of the source. In the early phases of commissioning of our system, significant efforts were expended on the mechanical alignment of our nozzle collimation system with the physical beam axis. During this process the effective source spot was imaged using a 0.25 mm thick brass pinhole collimator (100 μm diameter) for both the large and small x-ray tube focus. The large focal spot was found to be inhomogeneous in intensity, with its envelope being essentially rectangular and effectively rotated in the gun-target, A–B plane. Even the small (0.4 mm) focal spot exhibits resolvable structure, as illustrated by figure 11.
Figure 11.
An image of the SARRP 0.4 mm (small) focal spot in the gun-target, A–B plane as rendered through a 100 μm pinhole punched in a 0.25 mm thick brass plate located 6 cm from the source and imaged at 35 cm from the source using EBT film.
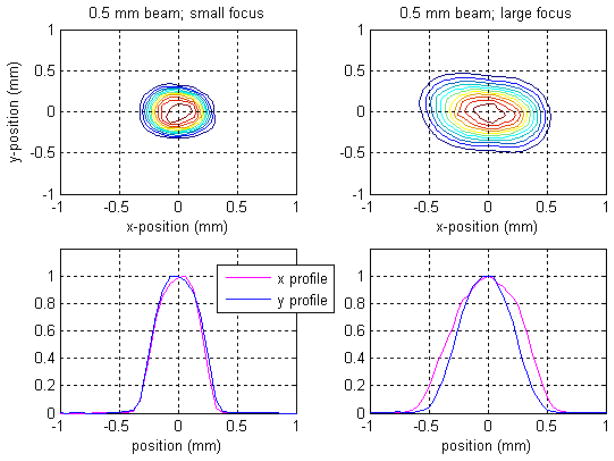
Figure 12 demonstrates the overall effects of the focal-spot size and fluence distribution in terms of dose for the smallest, 0.5 mm aperture. These are experimental results; those shown on the left were measured with the small focal spot and were provided by a first commissioning experiment employing the same apparatus. The effects of the resolved structure of the small focal spot shown in figure 11 in terms of the dose distribution are clearly minimal, whereas the same cannot be said for the large focal spot—its 2D dose distribution is clearly asymmetric; the rotation previously alluded to persists, as one might expect. This problem is significantly less important for the 1 mm aperture. Though this has not been presented here in detail, only a slight asymmetry in the 2D dose distribution is present.
Figure 12.
Dependence of the SARRP 0.5 mm circular beam on the focal-spot size. The left panels show a 2D contour dose plot and individual x, y dose profiles for the smallest SARRP beam resulting from the small focal-spot size (0.4 mm). The beam is reasonably symmetric. The right panels are the corresponding results for the large focal spot (3 mm). The beam in this case is considerably broader and asymmetric, with a slight rotation evident in the 2D distribution.
To date, most SARRP experiments employing the smallest nozzles have required only simplistic, point-dose descriptions of the radiation received. Though, for applications employing these apertures where full 3D RTP is required, perhaps the easiest strategy to deal with the focal-spot asymmetries is to effectively eliminate them by exclusively employing smaller focal spot. Use of this strategy would come at the price of lower dose rates. An estimate for the 0.5 mm aperture at 1 cm depth with the small focal spot (SSD = 34 cm and 0.16 mm Cu, running at maximal current of 3 mA), based on earlier measurements, is approximately 40 cGy min−1, to be compared with the present result of 102 cGy min−1 with the large focal spot. The percentage reduction in the dose rate is larger than this for the 1 mm aperture given its aperture design.
Another strategy could involve effective incorporation of the known focal-spot image into the 2D flux of the incident electron beam. At present, the X-TUBE CM in BEAM does not support this and customization is therefore implied. A third strategy, which is of general interest in consideration of dose computation speed, would be to develop a (non-MC) pencil-beam convolution dose engine that has been tuned, using a virtual source, to reproduce the (asymmetric) dose data acquired with the large focus for the smallest circular collimators. For this model, tissue heterogeneities could be dealt with, to first order, using a path length correction.
One must consider that the effective asymmetries in the focal spot may not necessarily be stable over time. If they are not, the latter two strategies discussed become more difficult to maintain. More study of this is needed.
5. Outlook and conclusions
We are encouraged by these results towards our continued development of a full 3D MC-based RTP platform that will employ the BEAM dose engine presented here. The commissioning equipment that has been designed and built for the SARRP has performed well and only minor improvements are perhaps indicated for stabilizing the water phantom to the support jig.
This first study has afforded an understanding of the scope of required experimental measurements for the calibration of our MC dose engine. It is likely that fewer depth points (films) are required per measured set with only one SSD sampled per nozzle. EBT film dosimetry for our application involving extremely small geometries is certainly feasible, but has proved to be challenging. To further reduce statistical sampling uncertainties, future measurements will employ a lower maximum film dose. Meanwhile, we continue to refine our EBT protocols in efforts to minimize the introduction of unexpected or systematic uncertainties, which are difficult to quantify. In its final RTP application, our primary phase-space file at the exit of the x-ray tube will contain more particles. We intend to simulate 300 × 109 histories. Given the asymmetric dose distributions for the smallest circular collimators and observed discrepancies in the dose profiles at the edges of the high-dose region for the 3 × 3 and 5 × 5 mm2 nozzles, further improvements to the present MC dose engine involve modifications to the effective x-ray source. On the other hand, an approach using a fast pencil-beam calculation warrants consideration for the smallest 0.5 mm (and perhaps 1 mm) beams.
Since this project was first undertaken, our group has designed a micro multi-leaf collimator (μMLC) that will facilitate greater flexibility and efficiency in conformal animal irradiation experiments. MC-based RTP is likely implicated in this endeavor and, therefore, significant MC dose engine developments to support this technology are planned in parallel.
Acknowledgments
This work has been supported by a grant from the NCI (RO1 CA108449).
Footnotes
Note that this use of the CHAMBER CM to extract depth–dose information in a given material is consistent with intended functionality.
Such a large particle recycling value would not be statistically acceptable for computing photon fluence at the exit of the nozzle geometry. However, when dose is the quantity of interest, problems associated with artificially enhanced fluence fluctuations tend to be smoothed out.
This feature was turned on in favor of improved dose-profile statistics, sacrificing the asymmetrical subtleties in the simulated geometry owing to the heel effect in the target.
Note that the collimators were not designed with divergence matching.
In the sense that dose in the figure refers to dose per initial electron incident on the tungsten target.
References
- Berger MJ, Hubbell JH. Report NBSIR87-3597. Gaithersburg, MD: NIST; 1987. XCOM: photon cross sections on a personal computer. [Google Scholar]
- Devic S, Seuntjens J, Sham E, Podgorsak EB, Schmidtlein CR, Kirov AS, Soares CG. Precise radiochromic film dosimetry using a flat-bed document scanner. Med Phys. 2005;32:2245–53. doi: 10.1118/1.1929253. [DOI] [PubMed] [Google Scholar]
- Graves EE, Zhou H, Chatterjee R, Keall PJ, Gambhir SS, Contag CH, Boyer AL. Design and evaluation of a variable aperture collimator for conformal radiotherapy of small animals using a microCT scanner. Med Phys. 2007;34:4359–67. doi: 10.1118/1.2789498. [DOI] [PubMed] [Google Scholar]
- Jaffray D, Moseley D, Chow J, Kim S, Ansell S, Wilson G, Chiarot C. An image-guided irradiator for pre-clinical radiation therapy studies (abstract) Med Phys. 2006;33:2241. [Google Scholar]
- Matinfar M, Ford E, Iordachita I, Wong J, Kazanzides P. Image guided small animal radiation research platform: calibration of treatment beam alignment. Phys Med Biol. 2009;54:891–905. doi: 10.1088/0031-9155/54/4/005. [DOI] [PMC free article] [PubMed] [Google Scholar]
- Rogers DWO, Faddegon BA, Ding GX, Ma CM, We J, Mackie TR. BEAM: a Monte Carlo code to simulate radiotherapy treatment units. Med Phys. 1995;22:503–24. doi: 10.1118/1.597552. [DOI] [PubMed] [Google Scholar]
- Seltzer SM. Electron and positron stopping powers of materials database Version 2.0. NIST Standard Reference Database. 1989:7. http://www.nist.gov/srd/WebGuide/nist7/072.htm.
- Stojadinovic S, et al. MicroRT—small animal conformal irradiator. Med Phys. 2007;34:4706–16. doi: 10.1118/1.2799887. [DOI] [PubMed] [Google Scholar]
- Task Group 21. AAPM Radiation Therapy Committee 1983 A protocol for the determination of absorbed dose from high-energy photon and electron beams. Med Phys. 10:741–71. doi: 10.1118/1.595446. [DOI] [PubMed] [Google Scholar]
- Verhaegen F, Nahum A, Van de Putte S, Namito Y. Monte Carlo modeling of radiotherapy kV x-ray units. Phys Med Biol. 1999;44:1767–89. doi: 10.1088/0031-9155/44/7/315. [DOI] [PubMed] [Google Scholar]
- Verhaegen F, Seuntjens J. Topical review: Monte Carlo modeling of external radiotherapy photon beams. Phys Med Biol. 2003;48:R107–64. doi: 10.1088/0031-9155/48/21/r01. [DOI] [PubMed] [Google Scholar]
- Walters B, Kawrakow I, Rogers DWO. DOSXYZnrc users manual. National Research Council of Canada Report PIRS-794revB. 2006 Sep 29 [Google Scholar]
- Wong J, et al. A high resolution, small animal radiation research platform with x-ray tomographic guidance capabilities. Int J Oncol Biol Phys. 2007;71:1591–9. doi: 10.1016/j.ijrobp.2008.04.025. [DOI] [PMC free article] [PubMed] [Google Scholar]


