Abstract
The influence of asymmetric vocal fold stiffness on voice production was evaluated using life-sized, self-oscillating vocal fold models with an idealized geometry based on the human vocal folds. The models were fabricated using flexible, materially-linear silicone compounds with Young’s modulus values comparable to that of vocal fold tissue. The models included a two-layer design to simulate the vocal fold layered structure. The respective Young’s moduli of elasticity of the “left” and “right” vocal fold models were varied to create asymmetric conditions. High-speed videokymography was used to measure maximum vocal fold excursion, vibration frequency, and left-right phase shift, all of which were significantly influenced by asymmetry. Onset pressure, a measure of vocal effort, increased with asymmetry. Particle image velocimetry (PIV) analysis showed significantly greater skewing of the glottal jet in the direction of the stiffer vocal fold model. Potential applications to various clinical conditions are mentioned, and suggestions for future related studies are presented.
Keywords: Voice production, vocal fold modeling, asymmetric vocal fold vibration
1. Introduction
Healthy human vocal folds experience flow-induced vibrations in response to tracheal airflow. These vibrations modulate glottal airflow, thus creating pressure fluctuations within the vocal tract that generate sound for voice production. The vocal folds exhibit natural asymmetry (Hirano et al., 1989), but this is generally asymptomatic. However, voice disorders such as vocal fold scarring (Thibeault et al., 2002), inflammation (e.g., due to reflux or laryngitis; Hanson and Jiang, 2000), and sulcus vocalis (Lee and Niimi, 1990) may exhibit sufficient asymmetry so as to contribute to noticeably irregular vocal fold vibration. Voice quality, and consequently quality of life, is adversely affected. The research described in this paper is aimed at studying asymmetric material properties in vocal fold vibration, in order to assist in the continued development of improved clinical care of the human voice.
Studies using computational and synthetic vocal folds have been used to investigate vocal fold vibration and glottal airflow for both healthy and diseased vocal fold scenarios. The following summarizes a few studies that have focused on structural and/or aerodynamic asymmetry.
Zhang and Jiang (2004) demonstrated that the addition of a unilateral mass (polyp) added to the commonly-used two-mass vocal fold model (Ishizaka and Flanagan, 1972) would affect vocal fold vibratory characteristics, and concluded that other conditions that result in added mass to the vocal folds may produce abnormal vocal fold movements. Using a synthetic rubber vocal fold model to investigate irregular vocal fold vibration, Berry et al. (2006) showed two types of biphonation, one related to asymmetries found between vocal folds (left-right asymmetry), and the other within vocal folds (anterior-posterior asymmetry). The benefit of using synthetic vocal fold models to study asymmetric vibration patterns was emphasized. They recommended further studies into mechanisms of irregular vocal fold vibration across many phonatory conditions involving both symmetric and asymmetric vocal folds using multilayered synthetic vocal fold models.
Regarding glottal jet aerodynamics, Shinwari et al. (2003) used flow visualization to characterize the flow through rigid acrylic vocal fold models with varying degrees of intraglottal asymmetry, and discussed ways in which aerodynamic driving forces could differ between symmetric and asymmetric vocal folds. Khosla et al. (2009) recently used particle image velocimetry (PIV) to investigate the supraglottal flow in excised canine larynges (both normal and asymmetric). They found that asymmetric stiffness between vocal folds resulted in lateral jet skewing, asymmetric glottal areas, and periodic asymmetric mucosal waves. Drechsel and Thomson (2008) demonstrated sensitivity of the glottal jet to the lateral position of supraglottal structures (such as a vocal tract and/or false vocal folds) using a synthetic, self-oscillating vocal fold model. Neubauer et al. (2007) showed that slight unevenness in the mounting of otherwise nominally symmetric self-oscillating synthetic models could produce a laterally-skewed jet.
These studies have focused on asymmetry resulting largely from geometric factors. Lacking is a controlled study of the influence of material-only asymmetry on vocal fold vibration and glottal aerodynamics. It is anticipated that through further studies of geometric and material asymmetry, improved phonosurgical procedures will lead to improved voice preservation and/or restoration. The purpose of this research was to investigate the influence of asymmetric material properties on vocal fold dynamics. This was done using high-speed videokymography and particle image velocimetry (PIV) in conjunction with multi-layer synthetic vocal fold models that included varying degrees of stiffness asymmetry.
2.0 Methods
2.1 Synthetic Vocal Fold Model Fabrication
Synthetic, one-layer (homogeneous), self-oscillating, continuum vocal fold models have been the subject of several recent studies (e.g., Thomson et al., 2005; Berry et al., 2006; Zhang et al., 2006a, 2006b; Neubauer et al., 2007). To reflect the soft cover layer and stiff body layer composition of the human vocal folds (Hirano and Kakita, 1985), two-layer versions of these synthetic models have recently been used (Reide et al., 2008; Drechsel and Thomson, 2008; see Fig. 1), with geometries based on that of Scherer et al. (2001). These models are of the same size, similar shape, and similar flexibility as the human vocal folds. Simplifications associated with these models have included idealized geometries with uniform anterior-posterior cross sections, exclusion of physiological mechanisms (e.g., blood flow, cell response, etc.), as well as elastic, materially-linear, isotropic material properties (in contrast with the viscoelastic, materially-nonlinear, anisotropic properties of human vocal fold tissue). Nevertheless, the models have been shown to vibrate at pressures and frequencies typical of human phonation. Further, they allow for prolonged testing and parametric studies not feasible with excised larynges, and are based on relatively simple and inexpensive manufacturing methods.
Figure 1.
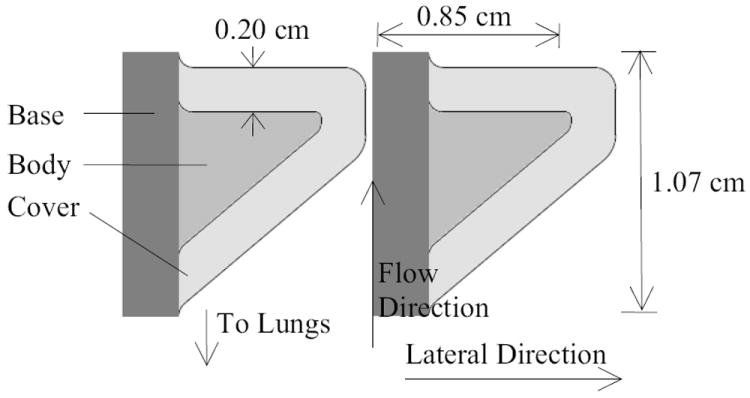
Diagram of vocal fold model dimensions.
The models for the present research were fabricated using a three-component addition-cure silicone compound, consisting of two-part Ecoflex 0030® silicone rubber and single-part Silicone Thinner® (Smooth-On, Inc.). Variation in stiffness between vocal fold models was achieved by using varying amounts of thinner (more thinner reduces the modulus of elasticity of the cured material). Symmetric and asymmetric models were fabricated and tested. Table 1 lists the Young’s modulus values for the body and cover layers of the different models. The notation LBCRBC is used as follows. L and R denote the position of the vocal fold models (left and right, respectively). B and C represent the volume ratio of silicone thinner for the body and cover layers, respectively; for example, a value of B=2 corresponds to a 1:1:2 mixing ratio, or one part of each Ecoflex compound to two parts Silicone Thinner. For a baseline measure, a model representing a healthy vocal fold was kept on the left side (L24) during the experiments for both asymmetric and symmetric cases, and only the right vocal fold model was changed.
Table 1.
Young’s modulus of elasticity (kPa) of vocal fold models.
| Case | Left cover | Right cover | Left body | Right body |
|---|---|---|---|---|
| L24R24 | 3.3 | 2.9 | 8.9 | 7.8 |
| L24R23 | 3.3 | 5.2 | 8.9 | 9.0 |
| L24R22 | 3.3 | 8.7 | 8.9 | 8.8 |
The cover layer thickness for each model was approximately 2 mm. The models were attached to acrylic plates using a silicone rubber adhesive as described by Drechsel (2008). An approximately 3-mm base at the lateral edge of each vocal fold model was used to position the model laterally. The base was made of two-part silicone compound DragonSkin™ (also by Smooth-On, Inc.); it was much stiffer than the other vocal fold model material, and thus did not vibrate significantly during model oscillation.
2.2 Test Setup
The test setup is shown in Fig. 2. An approximately 4.0-m long, 0.95-cm diameter flexible PVC tube connected a compressed air supply to a rigid plenum. Air flow was regulated via a manual valve and monitored using an in-line rotameter (only in place during onset pressure measurements) and a differential pressure transducer (Omega PX138-001D5V). Upstream of the plenum was a LaVision aerosol generator (not shown), used to create seed particles from DEHS oil (di-ethyl-hexyl sebacate, CAS#122-62-3) for PIV data collection. The section immediately upstream of the vocal folds (“trachea”) was a 1.27-cm diameter, 7.6-cm long rigid PVC pipe mounted to the plates holding the synthetic vocal fold models. A 1.27-cm diameter, 30-cm long flexible PVC tube connected the sub-glottal area to the plenum. As is commonly the case with excised larynx studies, no downstream test section (“vocal tract”) was used.
Figure 2.
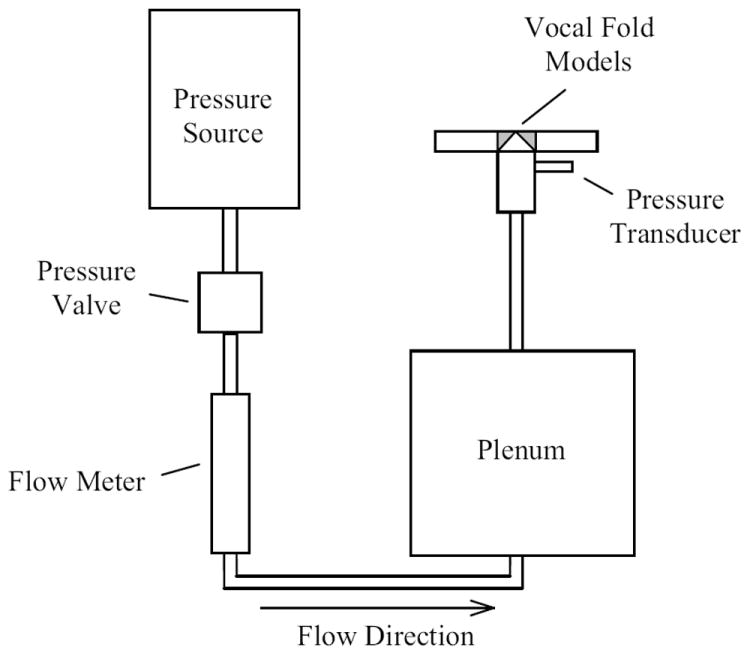
Synthetic vocal fold model setup (adapted from Drechsel and Thomson, 2008).
2.3 Data Acquisition
A National Instruments data acquisition system (PXI-1042Q) and LabVIEW software were used to collect frequency data obtained from the pressure transducer. The PIV system was used to acquire 2D velocity data of the supraglottal jet in what would be the equivalent of a coronal cross section at the approximate anterior-posterior midplane of the vocal fold models. The PIV camera (LaVision VC-Imager Intense, 1376×1045 pixels) was positioned approximately 25 cm from the vocal folds; a raw image is shown in Fig. 3. The differential pressure transducer provided a trigger input to synchronize the PIV laser (New Wave Research Solo II Nd:YAG laser) with the vocal fold vibration. Software-adjustable PIV time delay allowed for imaging at various phases.
Figure 3.
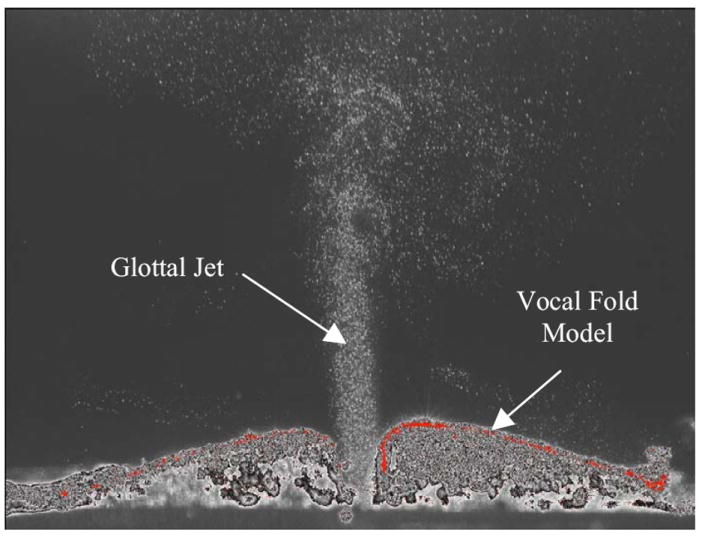
Sample raw PIV image showing instantaneous particles and vocal fold model position. Shown is a symmetric model opening at low pressure (1.0 kPa).
PIV images were acquired at 30 different phases. The time delay between image pairs was 2 μs. A multi-pass 64×64 to 32×32 cross-correlation search window with 50% overlap was used to calculate velocity. Since the vocal folds vibrated at a frequency much greater than the maximum sampling frequency of the PIV system, ensemble averaging was performed over 100 image pairs at each phase. For asymmetric models, PIV data were obtained for low (1.0 kPa) and high (2.0 kPa) pressures. PIV data for the symmetric case (L24R24) were obtained at 1.0 kPa and 1.5 kPa, since the high vibration amplitude at 2.0 kPa made these models overly susceptible to damage.
A high-speed camera (Photron APS-RX) was used to examine medial-lateral model motion in the transverse plane. It was located approximately 20 cm above the model. The camera frame rate and resolution were 3000 fps and 1024×1024 pixels, respectively. Four high-intensity LED lights and controller (Visual Instrumentation Corporation #900415, #200900) were used for model illumination. High-speed images were acquired at 1.0 kPa and 2.0 kPa upstream pressures for all models. (Because short phonation periods were adequate for high-speed data acquisition, the symmetric models were able to be imaged at an upstream pressure of 2.0 kPa.)
Using custom MATLAB codes, image sequences were analyzed for frequency, glottal width, and phase shift measurements. The glottis boundary in each high-speed image was identified using grayscale intensity thresholding, from which the glottal area and half width values were directly computed. Videokymography (VKG), a method used to visualize high frequency vocal fold movement (e.g., Qiu and Shutte, 2007; Svec et al., 2007), was used to track the opening and closing of the vocal folds. This was done by constructing a time-sequenced compilation (kymogram) of grayscale intensity values of images of the models at the anterior-posterior center of the vocal folds through multiple cycles.
Onset pressure (the minimum pressure to initiate vibration from rest) and offset pressure (the minimum pressure to sustain vibration once initiated) were recorded, with vibration onset and offset determined by monitoring the pressure signal in LabVIEW.
An Instron tensile testing apparatus (Instron 2519-102) was used to measure the Young’s modulus of the materials fabricated with varying silicone mixing ratios. Cylindrical test specimens measuring approximately 17-cm long and 0.9-cm diameter were created at the same time that the body and cover layers were manufactured. Stress was measured for a periodic strain input from 0 to 40% strain at a rate of 1000 mm/min over 10 cycles for each specimen.
3. Results and Discussion
3.1 Young’s Modulus of Model Materials
The Young’s modulus values for the different layers of the different models are shown in Table 1. These values are similar to values used by others in both synthetic and computational vocal fold modeling (e.g., Alipour et al., 2000; Thomson et al., 2005; Drechsel and Thomson, 2008), and the magnitude of the Young’s modulus is similar to that of human vocal fold tissue in the small-strain range (Chan et al., 2007).
3.2 Onset and Offset Pressure
The symmetric model had the lowest frequency of vibration and the lowest onset and offset pressures, as shown in Table 2. Interestingly, the onset pressure significantly increased as asymmetry was introduced (L24R23 model) but did not increase further as asymmetry was enhanced (L24R22 model).
Table 2.
Phonation onset and offset threshold pressures (kPa) and maximum glottal area (mm2) at low (1.0 kPa) and high (2.0 kPa) pressures.
| Case | Ponset | Poffset | Plow area | Phigh area |
|---|---|---|---|---|
| L24R24 | 0.48 | 0.41 | 30.18 | 67.69 |
| L24R23 | 1.35 | 0.94 | 12.58 | 42.48 |
| L24R22 | 1.23 | 0.94 | 12.05 | 37.12 |
3.3 Kinematic Variables
Asymmetry significantly affected the maximum glottal area, as shown in Table 2, causing an over 50% decrease for the low pressure cases and an approximately 30% decrease for the high pressure cases. This decreased area could cause either reduced mass flow through the glottis and/or increased flow velocity. However, since the coupling between glottal flow and radiated sound is complex and not yet fully understood (e.g., Barney et al., 1999; Zhao et al., 2002), further studies would need to be performed to determine the effect of the decreased area on radiated sound amplitude and quality.
High-speed images for selected symmetric and asymmetric cases are shown in Fig. 4. High-speed VKG images for all cases are shown in Fig. 5. As is evident in Figs. 4 and 5, in some cases the mid-region of the stiff vocal fold model was overlapped by the opposing less-stiff vocal fold model.
Figure 4.
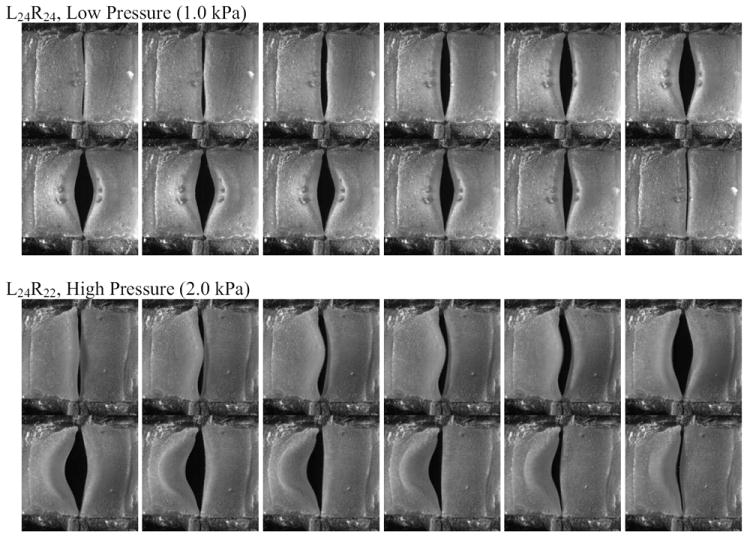
Sample high speed images over one cycle for symmetric (top) and asymmetric (bottom) cases.
Figure 5.
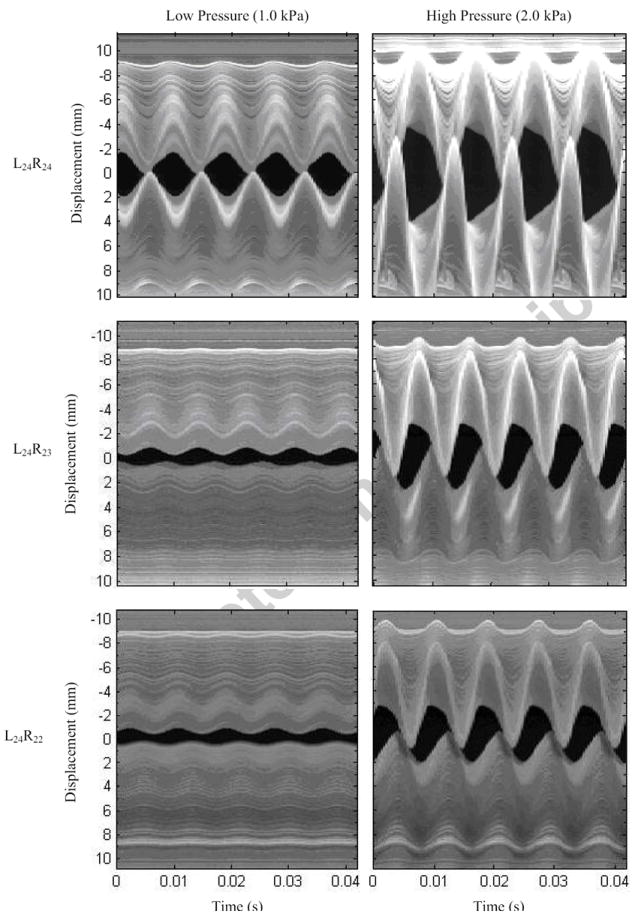
High-speed videokymography images for asymmetric and symmetric models at low and high pressures. The top model is L24 (baseline symmetric model) in every case.
Data derived from the high-speed images include glottal area (Fig. 6), glottal half-width (Fig. 7), and phase shift (Fig. 8). The two asymmetric models had similar glottal half-widths that were both significantly smaller than that of the symmetric model. Reduced vibration amplitude is consistent with a clinically observed “weak” or “hoarse” voice characteristic. It is also important to note that the orifice between the asymmetric models (the “glottis”) did not close completely during the glottal cycle; this would contribute to a “breathy” voice.
Figure 6.
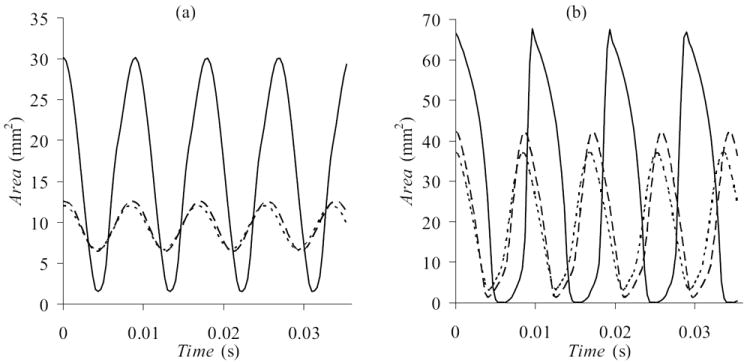
Glottal area derived from VKG images for (a) low (1.0 kPa) pressure and (b) high (2.0 kPa) pressure. Vertical scales are adjusted. Data for asymmetric (-- L24R22, – – L24R23) and symmetric (— L24R24) models are compared.
Figure 7.
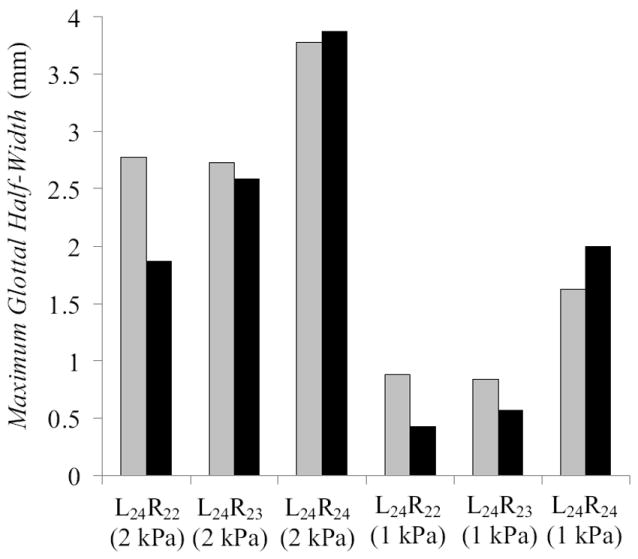
Maximum glottal half-width measured (clear bar – left vocal fold, solid bar – right vocal fold) using high-speed VKG images, for symmetric and asymmetric models at high and low pressures.
Figure 8.
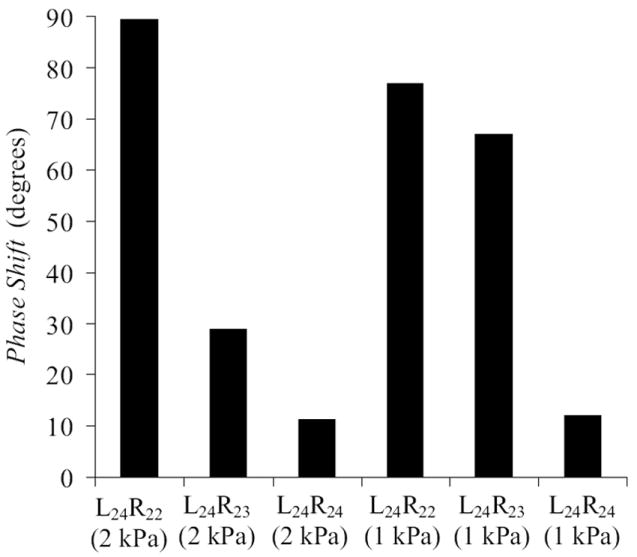
Phase shift derived from high-speed VKG images for symmetric and asymmetric models at high and low pressures.
These results show that increasing the stiffness of one vocal fold significantly reduces the amplitude of both vocal folds, and not just that of the stiff vocal fold. In treating conditions in which asymmetric vocal fold stiffness is a concern, a close match between Young’s modulus values for both covers is highly preferable. In the L24R23 case, the right cover modulus was relatively close to that of the left cover, but nevertheless yielded a reduction of approximately 50% in vibration amplitude at the 1 kPa pressure. Given the high variability of tissue stiffness between individuals (e.g., Chan et al., 2007), precise stiffness matching may be difficult and would require a method for in vivo measurement of the healthy fold’s Young’s modulus.
The left and right models appeared to oscillate at the same frequency, although longer recordings would be required to confirm this. The phase between the two sides differed significantly in the presence of asymmetry. As asymmetry increased, the phase difference also increased, up to 90° for the 2 kPa, highest asymmetry case (see Fig. 8). The phase difference alters the shape of the glottal area, in turn influencing the flow rate waveform and hence quality of generated sound. It is speculated that this out-of-phase asymmetry could possibly result in a qualitatively “unnatural” sounding voice, although further studies with a vocal tract would be necessary to further investigate this.
3.4 Glottal Jet
PIV velocity contours are shown in Fig. 9; every-other recorded phase is displayed. Except for during immediate opening and closing, the symmetric model yielded a relatively symmetric jet near the glottal exit; asymmetry in the jet further from the glottal exit is evident, likely due to flow instability associated with free jets. In contrast, the two asymmetric models yielded skewed velocity profiles, generally towards the stiffer model (right side), for both pressures. At the low pressure, the jet was generally skewed towards the stiffer model throughout the cycle, with the exception of the immediate opening and closing. At the high pressure, the jet straightened out during most of the open phase. This behavior was likely due to the angle of the medial surface of the models with respect to the vertical plane. At immediate opening and closing, the models were at roughly the same elevation vertically and likely were of similar instantaneous geometry. During the bulk of the open phase, however, the stiffer model was lower in elevation than the flexible model; consequently, the flexible model medial surface would be expected to have a greater divergence angle than the stiffer model. The flow thus remained attached to the wall with a lower divergence angle. At the higher pressure, however, the stiffer model angle was sufficiently large that the flow separated from the inferior glottal margin and did not skew significantly. As skewing of the glottal jet may adversely influence sound production, for example, by potential impinging of the glottal jet on the ventricular folds causing broadband sound generation, it is generally thought to be desirable that the jet be as symmetric as possible.
Figure 9.
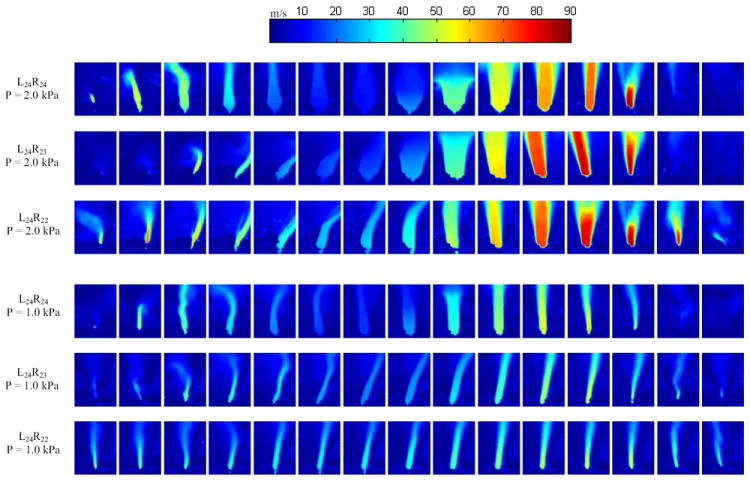
Velocity magnitude from PIV data for asymmetric and symmetric cases at low and high pressures. Images were obtained at thirty phases over the cycle and velocity fields were ensemble averaged; only every other phase is shown here.
Such glottal jet skewing has been seen in other vocal fold models, including synthetic rigid (Shinwari et al., 2003), self-oscillating (Neubauer et al., 2007) and excised canine (Khosla et al., 2009) models. In the case of the nominally symmetric rigid model of Shinwari et al. (2003), skewing was attributed to the Coanda effect. In the case of the self-oscillating synthetic model of Nuebauer et al. (2007), skewing was attributed to uneven mounting of the left and right models. In the case of the canine models of Khosla et al. (2009), skewing was attributed to differences in stiffness between the vocal folds. Skewing has also been shown to occur due to lateral offsetting of a supraglottal duct (Drechsel and Thomson, 2008). These studies highlight the sensitivity of the glottal jet to its surroundings. In the present study, since introduction of asymmetric materials strongly influenced the instantaneous glottal geometry, and since the asymmetric models all demonstrated more skewing than the symmetric models, it is reasonable to conclude that material asymmetry played a significant role in causing glottal jet skewing. This is consistent with the findings of Khosla et al. (2009). However, contribution due to potential slight unevenness in mounting cannot be ruled out. The role of the Coanda effect in influencing the dynamics of a jet through a time-varying glottis is currently an open question in voice research, and no speculation is made here regarding its potential role in the jet skewing observed in these studies.
5.0 Conclusions and Future Research
Asymmetry in the stiffness of synthetic vocal folds is shown to reduce glottal width, introduce phase differences between the left and right folds, increase onset pressure, and contribute to asymmetric glottal velocity profiles. These suggest that from a phonatory perspective, close matching of left-right stiffness is desired, since increased stiffness of one fold (that is, a greater degree of asymmetry) appears to result in: (1) smaller glottal area; (2) higher onset pressure resulting in greater required phonatory effort; (3) incomplete glottal closure, resulting in breathy voice; and (4) jet skewing, potentially contributing to broadband sound production.
Several areas of future work are here suggested. Firstly, comparison should be made of these results with those obtained with a supraglottal vocal tract and false vocal folds. While numerous synthetic and excised larynx studies have been performed without a vocal tract – usually for instrumentation access – it has been shown (e.g., Drechsel and Thomson, 2008; Zhang et al., 2009) that a vocal tract can directly influence the glottal jet. The vocal tract can also present an acoustic loading, thus potentially forming strong acoustic coupling between the vocal folds and the vocal tract (Zhang et al., 2009). Other areas of suggested work include: similar studies using computational models for more precise control over stiffness and geometry; further investigation into the effects of increased phase difference in asymmetric vocal fold vibration, including the presence or absence of irregular phonation as evidenced by slightly different frequencies; and development and testing of improved models (e.g., with nonlinear stress-strain characteristics and less idealized geometry) to more closely mimic human vocal folds.
Acknowledgments
This project was supported by Grant Numbers R03DC008200 and R01DC005788 from the National Institute on Deafness and Other Communicative Disorders (NIDCD). Its content is solely the responsibility of the authors and does not necessarily represent the official views of the NIDCD or the National Institutes of Health (NIH). The assistance of Mr. Paul Gollnick in vocal fold model fabrication and testing is gratefully acknowledged.
Footnotes
There is no conflict of interest with the authors and any aspect of the present work.
Publisher's Disclaimer: This is a PDF file of an unedited manuscript that has been accepted for publication. As a service to our customers we are providing this early version of the manuscript. The manuscript will undergo copyediting, typesetting, and review of the resulting proof before it is published in its final citable form. Please note that during the production process errors may be discovered which could affect the content, and all legal disclaimers that apply to the journal pertain.
References
- Alipour F, Berry DA, Titze IR. A finite-element model of vocal-fold vibration. Journal of the Acoustical Society of America. 2000;108(6):3003–3012. doi: 10.1121/1.1324678. [DOI] [PubMed] [Google Scholar]
- Barney A, Shadle CH, Davies POAL. Fluid flow in a dynamic mechanical model of the vocal folds and tract. I Measurements and theory. Journal of the Acoustical Society of America. 1999;105(1):444–455. [Google Scholar]
- Berry DA, Zhang Z, Neubauer J. Mechanisms of irregular vibration in a physical model of the vocal folds. Journal of the Acoustical Society of America. 2006;120(3):36–42. doi: 10.1121/1.2234519. [DOI] [PubMed] [Google Scholar]
- Chan RW, Fu M, Young L, Tirunagari N. Relative contributions of collagen and elastin to elasticity of the vocal fold under tension. Annals of Biomedical Engineering. 2007;35(8):1471–1483. doi: 10.1007/s10439-007-9314-x. [DOI] [PubMed] [Google Scholar]
- Drechsel JS. Masters Thesis. Brigham Young University; Provo, Utah: 2007. Characterization of synthetic, self-oscillating vocal fold models. [Google Scholar]
- Drechsel JS, Thomson SL. Influence of supraglottal structures on the glottal jet exiting a two-layer synthetic, self-oscillating vocal fold model. Journal of the Acoustical Society of America. 2008;123(6):4434–4445. doi: 10.1121/1.2897040. [DOI] [PMC free article] [PubMed] [Google Scholar]
- Hanson DG, Jiang JJ. Diagnosis and management of chronic laryngitis associated with reflux. The American Journal of Medicine. 2000;108(4A):112S–119S. doi: 10.1016/s0002-9343(99)00349-6. [DOI] [PubMed] [Google Scholar]
- Hirano M, Kakita Y. Speech Science: Recent Advances. College-Hill Press; San Diego: 1985. Cover-body theory of vocal fold vibration; pp. 1–46. [Google Scholar]
- Hirano M, Kurita S, Yukizane K, Hibi S. Asymmetry of the laryngeal framework: a morphologic study of cadaver larynges. Annals of Otology, Rhinology, and Laryngology. 1989;98(2):135–140. doi: 10.1177/000348948909800210. [DOI] [PubMed] [Google Scholar]
- Ishizaka K, Flanagan JL. Synthesis of voiced sounds from a two-mass model of the vocal cords. Bell System Technical Journal. 1972;51:1233–1268. [Google Scholar]
- Khosla S, Murugappan S, Paniello R, Ying J, Gutmark E. Role of vortices in voice production: normal versus asymmetric tension. The Laryngoscope. 2009;119:216–221. doi: 10.1002/lary.20026. [DOI] [PubMed] [Google Scholar]
- Lee STS, Niimi S. Vocal fold sulcus. The Journal of Laryngology and Otology. 1990;104:876–878. doi: 10.1017/s0022215100114227. [DOI] [PubMed] [Google Scholar]
- Neubauer J, Zhang Z, Miraghaie R, Berry D. Coherent structures of the near field flow in a self-oscillating physical model of the vocal folds. Journal of the Acoustical Society of America. 2007;121(2):1102–1118. doi: 10.1121/1.2409488. [DOI] [PubMed] [Google Scholar]
- Qiu Q, Shutte HK. Real-time kymographic imaging for visualizing human vocal-fold vibratory function. Review of Scientific Instruments. 2007;78(2):1–6. doi: 10.1063/1.2430622. 024302. [DOI] [PubMed] [Google Scholar]
- Scherer RC, Shinwari D, De Witt KJ, Zhang C, Kucinschi BR, Afjeh AA. Intraglottal pressure profiles for a symmetric and oblique glottis with a divergence angle of 10 degrees. Journal of the Acoustical Society of America. 2001;109(4):1616–1630. doi: 10.1121/1.1333420. [DOI] [PubMed] [Google Scholar]
- Shinwari D, Scherer RC, Dewitt KJ, Afjeh AA. Flow visualization and pressure distributions in a model of the glottis with a symmetric and oblique divergent angle of 10 degrees. Journal of the Acoustical Society of America. 2003;113(1):487–497. doi: 10.1121/1.1526468. [DOI] [PubMed] [Google Scholar]
- Svec JG, Frantisek S, Schutte HK. Videokymography in voice disorders: What to look for? Annals of Otology, Rhinology, and Laryngology. 2007;116(3):172–180. doi: 10.1177/000348940711600303. [DOI] [PubMed] [Google Scholar]
- Thibeault SL, Gray SD, Bless DM, Chan RW, Ford CN. Histologic and rheologic characterization of vocal fold scarring. Journal of Voice. 2002;16(1):96–104. doi: 10.1016/s0892-1997(02)00078-4. [DOI] [PubMed] [Google Scholar]
- Thomson SL, Mongeau L, Frankel SH. Aerodynamic transfer of energy to the vocal folds. Journal of the Acoustical Society of America. 2005;118(3):1689–1700. doi: 10.1121/1.2000787. [DOI] [PubMed] [Google Scholar]
- Zhang Y, Jiang JJ. Chaotic vibrations of a vocal fold model with a unilateral polyp. Journal of the Acoustical Society of America. 2004;115(3):1266–1269. doi: 10.1121/1.1648974. [DOI] [PubMed] [Google Scholar]
- Zhang Z, Neubauer J, Berry D. The influence of subglottal acoustics on laboratory models of phonation. Journal of the Acoustical Society of America. 2006a;120(3):1558–1569. doi: 10.1121/1.2225682. [DOI] [PubMed] [Google Scholar]
- Zhang Z, Neubauer J, Berry D. Aerodynamically and acoustically driven modes of vibration in a physical model of the vocal folds. Journal of the Acoustical Society of America. 2006b;120(5):2841–2849. doi: 10.1121/1.2354025. [DOI] [PubMed] [Google Scholar]
- Zhang Z, Neubauer J, Berry DA. Influence of vocal fold stiffness and acoustic loading on flow-induced vibration of a single-layer vocal fold model. Journal of Sound and Vibration. 2009;322:299–313. doi: 10.1016/j.jsv.2008.11.009. [DOI] [PMC free article] [PubMed] [Google Scholar]
- Zhao W, Zhang C, Frankel SH, Mongeau L. Computational aeroacoustics of phonation, part I: Computational methods and sound generation mechanisms. Journal of the Acoustical Society of America. 2002;112(5):2134–2146. doi: 10.1121/1.1506693. [DOI] [PubMed] [Google Scholar]


