

Abstract
Herein we report the characterization and optimization of single-step inline enrichment of phosphopeptides directly from small amounts of whole cell and tissue lysates (100 – 500 μg) using a hydroxyapatite (HAP) microcolumn and Multidimensional Protein Identification Technology (MudPIT). In comparison to a triplicate HILIC-IMAC phosphopeptide enrichment study, ~80% of the phosphopeptides identified using HAP-MudPIT were unique. Similarly, analysis of the consensus phosphorylation motifs between the two enrichment methods illustrates the complementarity of calcium-and iron-based enrichment methods and the higher sensitivity and selectivity of HAP-MudPIT for acidic motifs. We demonstrate how the identification of more multiply phosphorylated peptides from HAP-MudPIT can be used to quantify phosphorylation cooperativity. Through optimization of HAP-MudPIT on a whole cell lysate we routinely achieved identification and quantification of ca. 1000 phosphopeptides from a ~1 hr enrichment and 12 hr MudPIT analysis on small quantities of material. Finally, we applied this optimized method to identify phosphorylation sites from a mass-limited mouse brain region, the amygdala (200 – 500 μg), identifying up to 4000 phosphopeptides per run.
Keywords: Hydroxyapatite, MudPIT, phosphopeptide enrichment, whole cell lysate, mouse amygdala, phosphorylation cooperativity
Regulation of the phosphorylation state of proteins is involved in many essential biochemical cellular processes and diseases.1 Mass spectrometry (MS) has recently proven indispensable for global mapping of phosphorylation sites in cells and tissues2, 3 Through MS-based proteomics experiments, the estimated percentage of proteins phosphorylated in the human cell under normal physiological conditions has increased from 30% to 70%4, 5 and a total of 8283 human phosphoproteins have been catalogued.6 Similarly, the combination of phosphopeptide enrichment with various isotopic labeling strategies allows for the quantitative analysis of protein phosphorylation states by MS7–11 and determination of direct and down-stream targets of influential kinases.12–15 Recently new methods have been introduced for large-scale measurement of phosphorylation site occupancy.5, 16–18
Analysis of phosphorylated proteins is challenging since they are often of low abundance and modifications are often non-stoichiometric. Two-step chromatographic enrichment of phosphopeptides has proven to be the most comprehensive strategy for MS-based analysis of phosphorylation sites.19, 20 Common drawbacks however are the need for large amounts of protein mass and irreproducibility between analyses.20 Phosphopeptide enrichment and analysis methods that minimize sample transfers and improve sensitivity will be highly beneficial for quantitative studies of protein phosphorylation, particularly of mass-limited samples such as mammalian tissue.
Multidimensional Protein Identification Technology (MudPIT) has proven useful for global protein expression and protein complex analysis for multiple reasons; automated fractionation of peptides and remarkable sensitivity of protein identification are two of the most noteworthy. Both of these valuable elements can be primarily attributed to the microcolumn format of MudPIT where samples are directly loaded and transferred on-column.21, 22 This concept was recently confirmed for analysis of phosphorylation where enriched phosphopeptides were directly loaded onto a LC microcolumn. The exclusion of an autosampler provided an approximately 80-fold improvement in sensitivity, facilitating identification of hundreds of phosphopeptides from 1 μg of protein from 10,000 cells.23 We hypothesized that a microcolumn enrichment of phosphopeptides from a complex lysate directly loaded onto a MudPIT microcolumn would have further benefits. Previously, phosphopeptides have been successfully enriched from purified protein complex samples using microcolumns,24–26 but the column lacked the binding capacity to handle a complex lysate. The lack of other phosphopeptide enrichment resins which were both compatible with the high-pressure microcolumn format of MudPIT and capable of enriching phosphopeptides directly from a complex peptide mixture have limited our investigations. We reasoned that hydroxyapatite (HAP) may be a promising solution to these challenges.
HAP is a naturally occurring metal salt with the formula Ca5(PO4)3(OH). HAP crystallizes as a hexagonal close-packed structure orienting calcium ions at the surface in a triangle a few angstroms apart.27 It is present in human bone and tooth enamel and forms biologically-relevant interactions with proteins and phosphoproteins.28 Traditionally, HAP has been used analytically for protein separations.29, 30 The introduction of macroporous ceramic HAP (CHT) by Bio-Rad Laboratories improved mechanical stability and increased surface area 20-fold over microcrystalline HAP, both features beneficial for use of the material in HPLC.31, 32 These same attributes made CHT particularly attractive for inline enrichment of phosphopeptides on a microcolumn for direct transfer to the microcolumns used with MudPIT The high-capacity macroporous structure (25 mg protein per gram resin) made HAP promising for single-step phosphopeptide enrichment from complex biological samples prior to MudPIT. Two recent reports demonstrated phosphopeptide enrichment from protein standards with hydroxyapatite using commercially-available spherical ceramic macroporous hydroxyapatite particles33 and monolith-imbedded hydroxyapatite nanoparticles34 prior to MALDI-TOF. We extended these methodologies to a microcolumn format for inline phosphopeptide enrichment from complex proteome samples prior to MudPIT. In this paper, we describe the optimization of HAP-MudPIT, the characterization of enriched phosphopeptides and motifs in comparison to a common Fe(III)-IMAC method, and the identification and quantification of phosphorylation sites from whole cell and mass-limited tissue lysates.
METHODS AND MATERIALS
Reagents and Chemicals
Unless otherwise noted all chemicals were purchased from Thermo Fisher Scientific (Waltham, MA). Deionized water (18.2 MΩ, Barnstead, Dubuque, IA) was used for all preparations.
PDA cell growth and lysis
Pancreatic ductal adenocarcinoma (PDA) cells were maintained in 10 cm plates and were passaged at least five times in RPMI (PI-89984) supplemented with 2 mM glutamine, 1 mM sodium pyruvate, 100 μM non-essential amino acids, 7.5 × 10⁻⁴ g/mL of sodium bicarbonate, 20% dialyzed FBS (PI-89986) and either heavy arginine (13C6,15N4) and lysine (13C6, 15N2) (608033 and 608041, Sigma, St. Louis, MO) or light arginine and lysine (PI-89987 and PI-89989). SILAC labeled cells were expanded to ~80% confluence and the light cells were treated for 1 hour with 100 nM of Dasatinib and the heavy with vehicle. Heavy and light cells were lysed, quantified, combined (500 μg heavy and 500 μg light), and digested using the PTMScan® Phospho-Tyrosine Mouse mAb (P-Tyr-100) Kit (5636, Cell Signaling Technologies, Beverly, MA). Briefly, cells were lysed by probe sonication in the 9 M Urea lysis buffer provided by the kit. Cells were centrifuged at 20,000 rpm for 15 minutes and the supernatant was isolated. Proteins were reduced with 4.5 mM dithiothreitol and alkylated with 100 mM iodoacetamide. Samples were diluted to a final of 2 M Urea and digested overnight with trypsin (1 enzyme:100 substrate).
Preparation of mouse brain amygdala
C57BL/6J mice were labeled with 15N as previously described.35, 36. Briefly, a female mouse was fed a 15N labeled protein diet starting after weaning, remaining on the 15N protein diet throughout its pregnancy, and while feeding its pups. On postnatal day 45 (p45), the pups were subjected to halothane by inhalation until unresponsive, and whole brain tissue was quickly dissected, frozen with liquid nitrogen, and stored at −80 °C. The 15N enrichment was determined to be 96% using a previously described protocol.37 Unlabeled control C57BL/6J mice were also treated similarly. The amygdala region of brains from these mice was dissected after separating the cerebellum and cortical regions. They were immediately snap-frozen and stored in an identical manner as the 15N labeled brains. All methods involving animals were approved by the Institutional Animal Research Committee (approval #07-0083) and accredited by the American Association for Accreditation of Laboratory Animal Care.
The brain tissues were homogenized in a buffer (1 mg of tissue per 1 mL of buffer) containing 4 mM HEPES, 0.32 M sucrose, and protease and phosphatase inhibitors (Roche, Indianapolis, IN) in a Teflon hand held dounce grinder. After determining the protein concentration with a BCA protein assay (Pierce, Rockford, IL), homogenates from brain were mixed at a 1:1 (wt/wt) ratio with the 15N brain homogenate. In total, this resulted in three 14N /15N amygdala preparations. Each 14N/15N sample was precipitated with methanol-chloroform, primarily to remove phospholipids. The pellets were then solublized in 100 μL 0.2% ProteasMAX and 100 μL 8 M urea, reduced with 5 mM TCEP and alkylated with 10 mM iodoacetamide for 30 minutes at room temperature, respectively. The solutions were diluted 4-fold with 50 mM ammonium bicarbonate, and then digested with trypsin (1:25 enzyme/substrate) overnight at 37 °C.
Microcolumn HAP enrichment
A HAP microcolumn was prepared by first creating a Kasil frit at one end of an undeactivated 250 μm ID/360 μm OD capillary (Agilent Technologies, Inc., Santa Clara, CA). The Kasil frit was prepared by briefly dipping a 20 – 30 cm capillary in well-mixed 300 μL Kasil 1624 (PQ Corporation, Malvern, PA) and 100 μL formamide, curing at 100°C for 4 hrs, and cutting the frit to ~2 mm in length. Ceramic hydroxyapatite (CHT, Type I, 20 μm dia., 600–800 Å pores, Bio-Rad, Hercules, CA, cat #158-2000) was packed in-house from particle slurries in methanol to the desired bed volume (0.5 – 7.5 μL) and length (1 – 15 cm). All buffers and samples were filtered through 0.2 μm membrane filters (PN4454, Pall Life Sciences, Port Washington, NY) and pumped through the microcolumn at 400 psi with a high pressure bomb. The HAP microcolumn was equilibrated using 20 mM Tris pH 7.4 for 15 min. Peptide samples (100 – 500 μg, 100 – 500 μL) were adjusted to pH 7.4 with 0.1 M HCl and enriched for phosphopeptides on the HAP microcolumns (~30 min to 1 hr). The flow-through containing unbound peptides was collected for further analysis in some cases. A MudPIT trapping column was prepared by creating a Kasil frit at one end of an undeactivated 250 μm ID/360 μm OD capillary, then successively packed with 2 cm strong cation exchange particles (Luna SCX, 5 μm dia., 100 Å pores, Phenomenex) and 2 cm reverse phase particles (Aqua C18, 5 m dia., 125 Å pores, Phenomenex). The MudPIT trapping microcolumn was equilibrated using buffer A for 15 min, then connected to the end of the HAP microcolumn using a zero-dead volume union (Upchurch Scientific, Oak Harbor, WA). Enriched phosphopeptides on the HAP microcolumn were transferred to the MudPIT microcolumns using 250 μL 1 M KH2PO4 pH 7.8. The MudPIT microcolumn was washed using buffer A for 15 min to remove any salts remaining on-column from the enrichment.
MudPIT analysis
Capillary columns were prepared in-house for LC-MS/MS analysis from particle slurries in methanol. An analytical RPLC column was generated by pulling a 100 μm ID/360 μm OD capillary (Polymicro Technologies, Inc, Phoenix, AZ) to 5 μm ID tip. Reverse phase particles (Jupiter C18, 4 μm dia., 90 Å pores, Phenomenex, Torrance, CA) were packed directly into the pulled column at 800 psi until 15 cm long. The column was further packed, washed, and equilibrated at 100 bar with buffer B followed by buffer A. MudPIT and analytical columns were assembled using a zero-dead volume union (Upchurch Scientific, Oak Harbor, WA). LC-MS/MS analysis was performed using an Agilent 1200 HPLC pump and Thermo LTQ-Orbitrap XL or Velos using an in-house built electrospray stage. Electrospray was performed directly from the analytical column by applying the ESI voltage at a tee (150 μm ID, Upchurch Scientific) directly downstream of a 1:1000 split flow used to reduce the flow rate to 250 nL/min through the columns. 12-step MudPIT experiments were performed where each step corresponds to 0, 10, 15, 20, 25, 30, 40, 50, 60, 70, 85, and 100% buffer C being run for 5 min at the beginning of a 2 hr gradient. 6-step MudPIT experiments were performed with 0, 10, 20, 30, 50, 100% buffer C. The repetitive 2 hr gradients were from 100 % buffer A to 60% buffer B over 70 min, up to 100% B over 20 min, held at 100% B for 10 min, then back to 100% A for a 10 min column re-equilibration. Buffer A was 5% acetonitrile 0.1% formic acid, B was 80% acetonitrile 0.1% formic acid, and C was 500 mM ammonium acetate. Electrospray directly from the LC column was done at 2.5 kV with an inlet capillary temperature of 250 °C. Precursor scanning in the Orbitrap XL and Velos were performed from 300 – 2000 m/z with the following settings, respectively: 5 × 10⁵ and 1 × 10⁶ target ions, 50 and 25 ms maximum ion injection time, and 1 microscan. Data-dependent acquisition of MS/MS spectra with the LTQ on the Orbitrap XL and Velos were performed with the following settings, respectively: MS/MS on the 8 and 20 most intense ions per precursor scan, 30K automatic gain control target ions, 100 ms and 50 ms maximum injection time, and 1 microscan. Multistage activation fragmentation was performed at 35% normalized collision energy on the precursor and then on the expected neutral loss ions with reduced m/z's of 32.70 (+3 ions), 49.00 (+2), and 98.00 (+1). MSA fragmentation was not performed on mouse brain amygdala samples since higher peptide phosphorylation states complicate quantitation. Dynamic exclusion settings used were as follows: repeat count, 1; repeat duration, 30 second; exclusion list size, 500; and exclusion duration, 60 second.
Protein and phosphopeptide identification, quantification, and phosphorylation analysis were done with Integrated Proteomics Pipeline (IP2, http://www.integratedproteomics.com/). Tandem mass spectra were extracted to MS1 and MS2 files from raw files using RawExtract 1.9.938 and were searched against a non-redundant IPI mouse database with reversed sequences using ProLuCID39 with or without the multistage search option. The search space included all fully- and half-tryptic peptide candidates. The MSA search option in ProLuCID models both precursor fragment ions and neutral loss fragment ions in the XCorr calculation. Fragment ions from the phosphopeptide precursor were modeled with a mass increase of 79.9663 Da to the original peptide sequence for each phosphate present. The neutral loss fragment ions were modeled with a mass shift of −18.0106 from the loss of water from the original peptide sequence after the neutral loss of phosphate in the first activation step of MSA. Carbamidomethylation (+57.02146) of cysteine was considered as a static modification; phosphorylation (+79.9663) on serine, threonine, and tyrosine were considered as variable modifications; heavy lysine (+8.0144) and arginine (+10.0084) were considered as isotopic labels for SILAC PDA samples; and 15N amino acids were considered as isotopic labels for mouse amygdala samples. Peptide candidates were filtered to 0.1% FDR using DTASelect.40, 41 Phosphopeptides were analyzed using Ascore42 and Debunker.43 Phosphopeptides were quantified with Census44 by directing comparing either the SILAC or 15N ratio within a run.
HILIC-IMAC-LC-MS/MS
Peptides were desalted using the 1 g Sep-Pak cartridge (Waters, Milford, MA). Hydrophilic Interaction Chromatography was performed essentially as described by McNulty and Annan using a 4.6 × 250 mm TSKgel Amide-80 5 μm particle column (Tosoh Biosciences, King of Prussia, PA). Briefly, 500 μg of the digested sample was loaded in 90% solvent B (98% acetonitrile with 0.1% TFA) and peptides were eluted with a 75 min gradient using solvent A (98% water with 0.1% TFA) and flow rate of 0.5 mL/min. An inverse gradient of 90% B to 85% B for 5 min was followed by 85% B to 70% B in 65 min and finally a steep gradient to 0% B. 13 fractions were collected where fraction 1 consisted of the first 10 minutes and fractions 2–13 were 5 minutes intervals. These fractions were directly used for IMAC enrichment as described by McNulty and Annan. IMAC enriched peptides were resuspended in 15 μL 0.1% formic acid 5% acetonitrile for LC-MS/MS analysis. Samples were run the same as described in the MudPIT analysis section except (1) HILIC-IMAC fractionated and enriched phosphopeptides were loaded onto the LC column via autosampler instead of by sequential salt elution directly onto the LC column and (2) multistage activation was not employed.
RESULTS AND DISCUSSION
Factors affecting phosphopeptide enrichment selectivity and efficiency
One of the main challenges of single-step enrichment of phosphopeptides is selectively enriching phosphopeptides from a pool of non-phosphorylated peptides which are multiple orders of magnitude more abundant. Acidic non-phosphorylated peptides of higher abundance can significantly affect the enrichment of phosphopeptides. Phosphorylated serine, threonine, and tyrosine complete with the carboxylic acids in glutamate, aspartate, and the C-termini of peptides for binding sites on the enrichment resin. This problem has been primarily addressed by reducing sample complexity prior to Fe(III)-IMAC using Ga(III)-IMAC phosphoprotein enrichment45 and peptide prefractionation by SCX20 or HILIC19. High concentrations of acetonitrile during phosphopeptide enrichment have been shown to increase the degree of ionization of phosphoryl groups more than carboxyl groups, allowing for more selective, and thus efficient, enrichment of phosphopeptides with different Fe(III)-IMAC resins.46 Similarly, modification of enrichment resins with organic acids such as dihydroxybenzoic acid or lactic acid effectively block interactions with the carboxylic acids of non-phosphorylated peptides.47, 48 The efficiency of phosphopeptide enrichment is also dependent on the relative affinities of phosphoryl and carboxyl groups for other metals based on their Lewis acid chemistry. If a phosphopeptide interacts with a resin at a lower concentration due to a stronger affinity, more of that low abundance phosphopeptide will be enriched. Having a greater mass of a phosphopeptide from a higher affinity to the resin directly improves the sensitivity. Fundamentally, this concept can be quantified by comparison of the solubility products (Ksp) of the metal phosphates and metal carbonates. The comparison of metal salt precipitation conditions is quite relevant, as illustrated by methods for calcium49–51 and barium52 phosphopeptide precipitation enrichments. These comparisons can serve as a model of the interactions of metals and peptides during phosphopeptide enrichments. The Ksp of a metal salt, for example calcium phosphate, is a measure of its dissociation to individual ions (equation 1) as the product of the concentrations of the dissociated ions raised to the power of their stoichiometric value (equation 2):
| (1) |
| (2) |
A low Ksp is indicative of low solubility and tight association of the metal and ligand. Thus, a metal with a low metal phosphate Ksp should bind phosphopeptides more tightly and selectively. Table 1 lists the Ksp's of metal phosphates commonly used for phosphopeptide enrichment. Since the metal salts have different stoichiometries dictated by their oxidation states, we performed a calculation to directly compare the affinity of phosphate for the different metals. From the Ksp's, we calculated the minimum concentration of phosphate required to form a precipitate assuming the metals were present in eqimolar amounts. All calculations and further explanations of the different enrichment metals are in the Supporting Material. From these calculations, we found the phosphate concentration required for precipitation with calcium was about 20 times lower than for iron. Thus, a phosphopeptide 20-fold less abundant can be precipitated by calcium, making it at least 20-fold more sensitive for enriching phosphopeptides than iron.
Table 1.
Solubility products of phosphate and carbonate salts of metals commonly used for phosphopeptide enrichment.84, 85
| Metal | Phosphate salt | Ksp | [PO43−] (M) | Carbonate salt | Ksp | [CO32−] (M) | Selectivity |
|---|---|---|---|---|---|---|---|
| Calcium | Ca3(PO4)2 | 2 × 10⁻³³ | 5 × 10⁻¹⁷ | CaCO3 | 3 × 10⁻⁹ | 3 × 10⁻⁹ | 8 × 10⁷ |
| Iron (III) | FePO4•2H2O | 10 × 10−16 | 10 × 10−15 | FeCO3* | 3 × 10⁻¹¹* | 3 × 10⁻¹¹* | 3 × 10⁴* |
| Gallium (III) | GaPO4 | 1 × 10⁻²¹ | 1 × 10⁻²¹ | Ga2(CO3)3 | N/A | - | - |
| Barium | Ba3(PO4)2 | 3 × 10⁻²³ | 6 × 10⁻¹² | BaCO3 | 2 × 10⁻⁹ | 2 × 10⁻⁹ | 8 × 10¹³ |
The calculated phosphate and carbonate concentrations listed are those required for precipitation with the corresponding metal if the metals are assumed to be at a normalized unit molarity of 1 M. Selectivity was calculated by dividing the minimum carbonate concentration for precipitation by the minimum phosphate concentration required for precipitation. All calculations are shown in the Supporting Material.
Since the Ksp for Fe2(CO3)3 was not available we used the Ksp of FeCO3 as an estimate.
While sensitivity alone would account for possible gains from using a calcium-based phosphopeptide enrichment resin, calcium is also more selective for phosphate than carbonate. Table 1 also lists the readily available Ksp's of metal carbonates. We performed the same calculation for calcium carbonate as calcium phosphate to find the minimum carbonate concentration required to form a precipitate. We then used it to calculate the selectivity of phosphate association over carbonate to calcium. We found that the affinity for phosphate to calcium is nearly 100 million times greater than for carbonate. Thus, a phosphopeptide should outcompete it's corresponding unmodified peptide for binding sites on a calcium-based resin even when it is close to 100 million times less abundant. Unfortunately the Ksp for iron (III) carbonate could not be found to calculate it's phosphate:carbonate selectivity for a direct comparison to that of calcium's. Qualitatively iron (III) binds carbonate tightly, as this interaction is used for chelation in Fe(III)-IMAC phosphopeptide enrichment resins. As an estimate, we used the Ksp for iron (II) to calculate the minimum carbonate concentration for precipitation and the selectivity of iron for phosphate over carbonate. From this estimate, the selectivity of calcium for phosphopeptides over unmodified peptides may be more than 1000 times greater than that for iron. Based on this premise we were optimistic that hydroxyapatite could be used for single-step enrichment of phosphopeptides from complex proteomes.
HAP-MudPIT optimization for phosphopeptide analysis
MudPIT is part of a pipeline of sample preparation, clean-up, and protein digestion;53 two-dimensional liquid chromatography (2D-LC) and tandem mass spectrometry (MS/MS);21, 22 and peptide and protein identification and quantitation.39, 44, 54 In order to maximize phosphopeptide identifications, prior to HAP enrichment optimization we optimized key parameters within the pipeline while also integrating proven methods for phosphoproteomics analysis. These included microcolumn SCX fractionation of phosphopeptides, multistage activation MS/MS,55, 56 a multistage activation database search option within ProLuCID, and validation and filtering of confident phosphopeptides and phosphorylation sites for quantitation with Debunker43 and Ascore,42 respectively. We began by optimizing the salt elutions from the SCX resin. Based on results from prefractionation of phosphopeptides on conventional SCX columns,20, 57 we reasoned that the SCX microcolumn fractionation inherent to MudPIT could be optimized to improve sensitivity and maximize their identifications per time. We performed an analysis of a 12-step MudPIT after HAP phosphopeptide enrichment to identify the steps in which phosphopeptides were identified. The results are represented in Figure 1A. To reduce analysis time, we selected the salt elutions that appeared to distribute phosphopeptides more equally throughout the MudPIT steps. The results from this analysis are displayed next to the 12-step MudPIT results in Figure 1A. By reducing the number of MudPIT steps, a greater number of phosphopeptides were identified despite using half the analysis time. We attribute the gain in identifications to more efficient elution of phosphopeptides within single salt steps by minimizing dilution over multiple steps, as was previously shown for unmodified peptides.58
Figure 1.

MudPIT optimization of HAP-enriched phosphopeptides. (A) 500 μg of a whole cell tryptic digest was enriched using a 250 μm × 5 cm in-house packed HAP column. Enriched peptides were transferred to a MudPIT column and analyzed using either a 12 hr 6-step MudPIT (yellow bars) or 24 hr 12-step MudPIT (blue bars). (B) The number of phosphopeptides and phosphoproteins identified with (dark blue bars) and without (red) the MSA search option in ProLuCID. Annotated spectra for the quadruply modified phosphopeptides R.GRLpTPpSPDIIVLpSDNEASpSPR.S with (D) and without (E) the ProLuCID MSA search option.
Sequential CID activation of precursor and phosphate neutral loss product ions, or multistage activation (MSA), has been shown to increase the quantity and intensity of fragment ions that contribute to phosphopeptide sequence information to increase phosphopeptide identifications.55, 56 Thus we employed MSA for identification of phosphopeptides with HAP-MudPIT. We created an option within ProLuCID to search for these fragment ions and compared the results (Figure 1B) with and without the MSA search option . As expected we were able to identify more phosphopeptides (~50%) and phosphoproteins (~25%). These gains can be attributed to the generation and spectral matching of abundant neutral loss fragment ions. An example of this is shown by comparison of Figures 1C and 1D where we annotated a quadruply phosphorylated peptide with and without the neutral loss fragments. We will discuss later how MSA contributes to the identification of phosphopeptides with higher phosphorylation states.
We then investigated two critical parameters which should affect the single-step enrichment of phosphopeptides and the ultimate sensitivity of the HAP-MudPIT method: (1) the HAP to peptide mass ratio for enrichments and (2) the peptide mass requirements for mass spectrometers of different sensitivities. These results are shown in Figure 2. First we determined the optimum HAP to peptide ratio. We found that a HAP resin to peptide mass ratio of 5:1 was optimal: 0.5 mg (1 cm) of HAP packed into a 250 μm ID microcolumn (~0.5 μL bed volume) per 100 μg digest PDA cell lysate. This conclusion is illustrated by the maximum number of phosphopeptide identifications (Figure 2A) and the highest percent phosphopeptides identified within a run (Figure 2B) using 5 cm of HAP (~2.5 μL bed volume) for 500 μg of digested PDA cell lysate. This HAP to peptide ratio created the optimum competitive binding conditions between phosphopeptides and unmodified peptides to the HAP resin. Next we investigated the starting mass requirements for HAP-MudPIT by analyzing different masses of digested cell lysates, again monitoring phosphopeptide identifications and percent phosphopeptides identified. Additionally, we tested both the LTQ-Orbitrap XL and LTQ-Orbitrap Velos to determine if HAP-MudPIT was well matched with the performance characteristics of state-of-the-art mass spectrometers and if similar results were possible with less than 500 μg cell lysate. On both instruments, the highest number of phosphopeptides was still identified with a starting mass of 500 μg of digested PDA cell lysate with comparable results However, using the Orbitrap Velos there were minimal losses in phosphopeptide identifications with less peptide loading mass. This is expected as the Velos has been cited as 5 – 10 times more sensitive.59 Thus, the use of microcolumn HAP with MudPIT yields sensitivities suitable for identification of phosphopeptides from limited sample amounts with the best results using the more sensitive Orbitrap Velos.
Figure 2.

HAP enrichment optimization. Duplicate phosphopeptide enrichments of 500 μg of a whole cell tryptic digest were performed using different 250 μm in-house packed HAP columns of 2.5, 5, 10, and 15 cm in length corresponding to 1.25, 2.5, 5, and 7.5 mg HAP resin, respectively. Enriched peptides were transferred to a MudPIT column and analyzed using a 6-step MudPIT for 12 hrs with a LTQ-Orbitrap XL. The number of unique phosphopeptides identified (A) and the % of peptides identified as phosphopeptides (B) are plotted for these experiments. Single phosphopeptide enrichments of different masses of tryptic digests (100, 250, and 500 μg) were performed using individual 250 μm in-house packed HAP columns. Based on the optimization in (A), for each 100 μg of lysate to be enriched 1 cm (0.5 mg) of HAP resin was packed into the microcolumn. Enriched peptides were transferred to a MudPIT column and analyzed using a 6- step MudPIT for 12 hrs using either a LTQ-Orbitrap XL (orange bars) or LTQ-Orbitrap Velos (blue bars). The number of unique phosphopeptides identified (C) and the % of peptides identified as phosphopeptides (D) are plotted for these experiments.
Characterization of HAP-enriched phosphopeptides and comparison to HILIC-IMAC-enriched phosphopeptides
A timely comparative study of common phosphopeptide isolation methods established that different methods identify different phosphopeptides.60 This has been resonated with numerous studies using various prefractionation methods and resins. Thus, we compared the overlap of phosphopeptides identified among HAP-MudPIT and a common comprehensive method, HILIC-IMAC (Figure 3A). We found we were able to identify a comparable number of phosphopeptides in the same analysis time, with ~80% being complementary to HILIC-IMAC. The same comparative study of common phosphopeptide isolation methods also illustrated that there is a characteristic bias towards enrichment of singly phosphorylated peptides, usually greater than 90% of phosphopeptides identified, with the remaining percentage being mostly doubly phosphorylated.60 The HILIC-IMAC data we acquired showed a similar trend with 92% of phosphopeptides identified being singly phosphorylated. Conversely, the HAP-MudPIT method deviated from this trend. Figure 3B shows the distribution of phosphorylation states for identified phosphopeptides using HAP-MudPIT and HILIC-IMAC. With HAP-MudPIT, we found that around 70% of the phosphopeptides were singly phosphorylated. Phosphopeptides with two (22%), three (7%), and even 4 (2%) phosphorylated residues made up a significant percentage of the population. The number of doubly and triply phosphorylated peptides identified using HAP-MudPIT were more than twice that found using HILIC-IMAC, despite having half as many total phosphopeptide identifications. Further, the identifications of quadruply phosphorylated peptides were exclusive to HAP-MudPIT. Database searches for higher phosphorylation states yielded only false positives, indicating phosphopeptides with phosphorylation states higher than 4 weren't present within the sample, weren't enriched with HAP, or aren't easily identified by MS/MS. A list of all phosphopeptides identified from the two methods and a comparison can be found in the Supporting Information.
Figure 3.
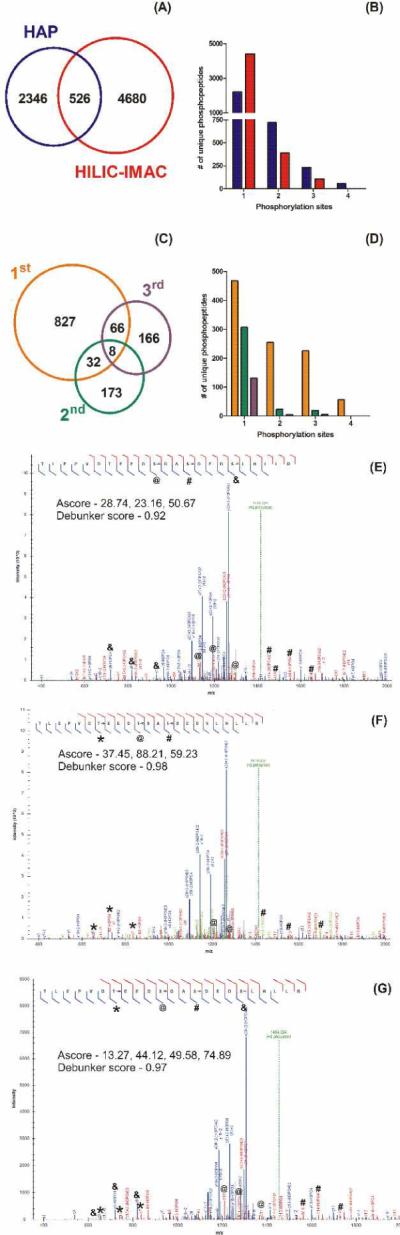
Comparisons of phosphopeptides (A) and the phosphorylation states of phosphopeptides (B) identified using HAP (blue) or HILIC-IMAC (red). Comparisons of the phosphopeptides (C) and the phosphorylation states of phosphopeptides (D) identified from consecutive HAP enrichments (1st enrichment – orange, 2nd – green, and 3rd – purple) from the same sample. Annotated spectra for the triply modified phosphopeptides (E) R.TLEPVDpTEEDpSDApSDEDSLHLLR.A and (F) R.TLEPVDTEEDpSDApSDEDpSLHLLR.A and the quadruply modified (G) R.TLEPVDpTEEDpSDApSDEDpSLHLLR.A.
Within the subpopulation of phosphopeptides which were identified using HAP-MudPIT, we tested whether we were depleting all HAP-binding phosphopeptides from a sample in a single enrichment. Similarly, since phosphopeptides with higher phosphorylation states were isolated we saw the potential for them to out-compete the binding of singly phosphorylated peptides to HAP. To test this, we performed triplicate consecutive enrichments on a single sample and compared the identified phosphopeptides (Figure 3C) and their phosphorylation states (Figure 3D). Indeed, we did find that doubly and triply phosphorylated peptides were almost exclusively isolated and identified from the first enrichment. The small gains in singly phosphorylated peptides identifications from consecutive enrichments indicate that most HAP-binding phosphopeptides, particularly of higher phosphorylation states, were identified within a single enrichment.
These results indicate there are key steps in our HAP-MudPIT analysis that facilitate enrichment and identification of phosphopeptides of higher phosphorylation states. The two main differences between our HAP-MudPIT and HILIC-IMAC analyses are the enrichment resin and the use of MSA. The previous study by Mamone et al. identified peptides with higher phosphorylation states from protein standards using HAP enrichment. Thus, the surface chemistry of HAP must be promoting the enrichment of phosphopeptides with higher phosphorylation states. Cooperative binding is a probable explanation. Phosphopeptides with higher phosphorylation states would be expected to bind more tightly to enrichment resins through cooperative binding. Thus, we rationalize that fixed, angstrom-spaced calcium coordination sites within HAP ceramic particles promotes cooperative binding more than other IMAC phosphopeptide enrichment resins. This is further confirmed by the phosphorylation motifs most strongly enriched by HAP-MudPIT (Table 2) and those unique to HAP-MudPIT (Table 3) that have multiple acidic residues within the motif that can cooperatively bind to calcium in HAP. A similar concept was shown for protein chromatography using HAP where chromatographic retention and selectivity rely on synergistic binding interactions.61
Table 2.
The most highly enriched phosphorylation motifs from HAP-MudPIT and HILIC-IMAC-LC-MS/MS.
| HAP-MudPIT motif | Fold increase | HILIC-IMAC motif | Fold increase |
|---|---|---|---|
| ……sDDE… | 79.93 | ..P.SPt…… | 26.35 |
| …..DsD.D… | 73.05 | …..PsTP…. | 22.44 |
| ……s.DDE.. | 64.80 | …R..SP.P… | 20.9 |
| ……sDED… | 64.17 | ……sEEE… | 13.8 |
| ……sDEE… | 55.15 | …..PsSP…. | 12.25 |
| ……sD.E.E. | 51.26 | …..Rs.SP… | 10.46 |
| ……s.DEE.. | 47.25 | ……tP.K… | 10.16 |
| …..DsE.E… | 47.16 | ….SDsE….. | 9.99 |
| ……sE.E.D. | 45.09 | ……sP.K… | 8.63 |
| ……sE.E.E. | 36.92 | ……sPT…. | 8.35 |
| ……tD.E… | 35.75 | ……sPK…. | 8.2 |
Motifs and fold increases were found using Motif-X.86 Motifs with lower fold increases can be found in the Supporting Material.
Table 3.
Phosphorylation motifs unique to HAP-MudPIT and HILIC-IMAC-LC-MS/MS with fold increases greater than 5.
| HAP-MudPIT motif | Fold increase | HILIC-IMAC motif | Fold increase |
|---|---|---|---|
| ……s.DDE.. | 64.80 | ..P.SPt…… | 26.35 |
| ……s.DEE.. | 47.25 | …..PsTP…. | 22.44 |
| ……tD.E… | 35.75 | ……sEEE… | 13.80 |
| ……s.D.D.. | 16.45 | …..PsSP…. | 12.25 |
| ……sE.D… | 15.38 | ……tP.K… | 10.16 |
| …D..sD….. | 13.49 | ….SDsE….. | 9.99 |
| ……S.D..D. | 13.24 | ……sP.K… | 8.63 |
| …..Ds…E.. | 12.52 | ……sPT…. | 8.35 |
| ……s…E.D | 12.29 | ……sPK…. | 8.2 |
| ……S…D.D | 11.97 | ……tP.P… | 7.84 |
| ……S.E..D. | 9.52 | ….S.tP….. | 7.81 |
| ……S E.E | 9.37 | ……SP…R. | 7.7 |
| ……sP..E.. | 9.27 | ……t.SP… | 6.59 |
| ……S.E..E. | 8.09 | .R.R..s…… | 6.46 |
| ……sPE…. | 7.99 | ……sPS…. | 6.03 |
| ..E…S..E… | 7.64 | ….R.tS….. | 6.03 |
| Average | 18.44 | …SP.t…… | 5.55 |
| Count | 16 | ……s.TP… | 5.11 |
| Average | 9.96 | ||
| Count | 18 | ||
Motifs and fold increases were found using Motif-X.86 All motifs and fold increases represented in Figure 4 can be found in the Supporting Material.
Additionally, with the characteristic enrichment and identification of higher phosphorylation states using HAP, MSA was an important factor for the overall success of the method. Phosphopeptides with higher phosphorylation states can undergo the corresponding number of neutral losses during CID fragmentation. Thus, without MSA the majority of fragmentation energy would contribute to multiple neutral losses of phosphates instead of peptide backbone fragmentation. In Figures 3E–G we show annotated spectra of different phosphorylation combinations on a multiply phosphorylated peptide sequence. The three spectra have nearly all possible b- and y-ions, indicated by the fragmentation annotation on the peptide sequences. Further, the three spectra have confident Ascores and Debunker scores, statistical representations of characteristic site-localizing phosphopeptide identifying fragment ions, respectively. To validate these scores for higher phosphorylation states we found the signature fragment ions for each phosphorylation site annotated in Figure 1D and Figures 3E–G. Thus, the use of MSA facilitated the generation of necessary sequence and phosphorylation site fragment ions for phosphopeptides of higher phosphorylation states enriched by HAP.
HAP-MudPIT facilitated the identification of mostly acidic phosphorylation motifs. We wondered how these motifs compared to another common enrichment method and what biological questions could be best answered with the different methods. As mentioned in the last section, we compared the phosphopeptides identified in our HAP-MudPIT and HILIC-IMAC-LC-MS/MS experiments of PDA cells. We also performed a comparison of the motifs enriched with the two methods to minimize biases due to mass spectrometer sampling. A Venn comparison of the phosphoserine (Figure 4A) and phosphothreonine (Figure 4B) motifs identified using Motif-X for the two enrichment methods were generated. Within the Venn circles we have displayed the number of motifs and the average fold increase of the motifs, a measure of the number of times the motifs were identified relative to how frequently it occurs within the translated genome. A list of the motifs found using each method with their relative fold increase can be referenced in the Supporting Material. Similar to the phosphopeptide comparison, a small percentage of the motifs overlapped between the two methods. Comparison of the fold increases for motifs common between the two methods reveals that HAP-MudPIT is more selective and sensitive for acidic motifs than HILIC-IMAC. That is, the fold increases of acidic motifs from HAP-MudPIT are greater than those from HILIC-IMAC (Table 2). We attribute this to (1) a single-step enrichment instead of a two-step enrichment, (2) the higher affinity and selectivity of phosphate for calcium than iron, and (3) the highly cooperative binding of acidic phosphopeptides to HAP. The qualitative comparison of the most highly enriched motifs for each method highlights the specificity differences between them. A comparison of the motif specificity to each method, shown in Table 3, is more informative. HAP-MudPIT is not only more sensitive for numerous different acidic motifs, illustrated by high fold increases, but also more specific, exemplified by the numerous combinations of acidic residues within the motifs. Considering this specificity and selectivity, HAP-MudPIT should be well-suited for studies involving casein kinase I (CK1) and II (CK2), the primary acidic motif-directed kinases known in the cell.62–64 CK2 has been deemed a master kinase,65 based on its implications in cancer66, 67 and regulation of diverse cellular processes such as development,68 the Hsp90 chaperone system,69, and cell proliferation and survival.70 Thus, the ability to selectively enrich CK2 substrates makes HAP-MudPIT relevant for studies of many different cellular processes and diseases.
Figure 4.

Comparison of statistically-significant (A) serine and (B) threonine phosphorylation motifs identified between HAP and HILIC-IMAC. The number of motifs found specific or common to the two enrichments are listed within the Venn diagrams and the average fold increase of the motif relative to background is listed in parentheses.
Quantitation of higher phosphorylation states facilitates identification of phosphorylation cooperativity
With the more prevalent identification and quantification of phosphopeptides with higher phosphorylation states we considered what implications these measurements may have on phosphoproteomic analysis. Higher phosphorylation states complicate quantification of phosphorylation sites and occupancies since a single site cannot be quantified solely from the phosphopeptide ratio.5 However, the information gained from having ratios for proximal phosphorylation events may help to clarify their relative biological significance and their cooperativity. For example, a bioinformatics analysis inferred phosphorylation cooperativity of proximal phosphorylation sites from large-scale proteomics data sets.71 From the analysis, they hypothesized that coordination and positional dependencies of phosphorylation sites imply cooperativity among them. That is, if one site is only found phosphorylated when other proximal sites are also phosphorylated, it is highly probable that the sites are cooperative. This is not unexpected, since sequential and hierarchical patterns are commonly found among different post-translational modifications.1, 72 With quantitative measurements of multiply phosphorylated peptides, we rationalized that the phosphopeptide ratios could be used to quantify cooperativity of phosphorylation sites. With this concept in mind we looked for cases where specific phosphorylation combinations were identified and quantified. We found phosphopeptides for an important transcription factor, Jun-B, which appear to fit this trend. The known JunB phosphorylation sites are represented in Figure 5A. Figure 5B shows the phosphorylation sites identified along with their corresponding chromatograms, ratios, and Ascores. As illustrated by the phosphorylation site combinations identified, an order of phosphorylation can be inferred, shown as numbered sites in Figure 5B. Similarly, the ratios of phosphopeptides increase steadily from 1.12 to 1.61 to 2.14 for each additional phosphorylation event. A series of increasing ratios implies that each phosphorylation event promoted or amplified the phosphorylation of the next site. A similar concept was used for the determination of phosphorylation cooperativity on a purified protein.73 Thus, methods to improve HAP-MudPIT or more generally isolation and identification of phosphopeptides with higher phosphorylation states may facilitate the global assessment of phosphorylation cooperativity.
Figure 5.

(A) Known phosphorylation sites of JunB transcription factor and the corresponding identified and quantified phosphopeptides. (B) Quantitative representation of the only three phosphopeptides identified for JunB with their ratios and Ascores. Numbers under the phosphorylation sites indicate inferred phosphorylation order.
Identification and quantitation of phosphopeptides from mouse brain amygdala
With the characterization of HAP and optimized conditions for enrichment of phosphopeptides from limited sample amounts, we tested this methodology on a mass-limited sample, mouse brain amygdala. The amygdala is one of the smallest mouse brain regions having a total volume of 1 – 2 mm3, total mass of 5 –15 mg, and a protein mass between 200 μg and 500 μg. Analysis of both transcript and protein levels from the mouse amygdala has furthered the molecular understanding of depression, fear learning, and addiction.74–80 The ability to identify and quantify protein phosphorylation sites between this and other brain regions could open the possibility to screen for phosphorylation changes and directly correlate to neurological phenotypes.
Despite the mass limitations of mouse amygdala, we were able to identify and quantify as many as 4000 phosphopeptides from a single biological analysis. A summary of triplicate biological analyses of mouse brain amygdala with application of different filters for confident identification and quantification of phosphopeptides are shown in Figure 6. The Venn diagrams in Figure 6A and 6C illustrate the overlap of phosphopeptides identified and quantified by triplicate biological analysis from the ProLuCID database search and Census quantification. Upon Ascore correction of phosphorylation sites (Figure 6B), the number of phosphopeptides identified increased from 5439 to 5934, also increasing the overlap in all three runs from 555 to 691. For quantification of phosphopeptides we then used Ascore and Debunker to filter confidently identified phosphopeptides (Debunker > 0.5) and confidently localized site (Ascore > 13). These results are illustrated in Figure 6D. From Census, we quantified a total of 3069 phosphopeptides. With the use of Ascore and Debunker filters a set of ~1700 highly confident identifications and measurements of phosphopeptide ratios were found. HAP-MudPIT demonstrated promising numbers of identified and quantified phosphopeptides from the mouse amygdala. Further optimization will improve the comprehensiveness of mass-limited samples and increase the number of phosphorylation events that can be compared between mouse brain regions and other mass-limited tissue samples.
Figure 6.

Comparison of phosphopeptides from triplicate biological replicate analysis of mouse brain amygdala using HAP-MudPIT. Identified phosphopeptides (A) before and (B) after Ascore phosphorylation site correction. Quantified phosphopeptides (C) before and (D) after Ascore and Debunker filtering using 13 and 0.5, respectively.
CONCLUSIONS
We demonstrated that single-step enrichment using HAP with MudPIT is a sensitive method for identifying phosphopeptides of higher phosphorylation states from complex proteomes. Although the single-step enrichment of HAP-MudPIT efficiently separated phosphopeptides from unmodified peptides, further improvements to the HAP enrichment methodology may improve comprehensiveness. For instance, multiple elutions from enrichment resins and the use of different eluents have been shown to be more efficient, identify unique phosphopeptides, and identify more multiply phosphorylated peptides compared to traditional elution methods.81, 82 Similarly, prefractionation should enhance the comprehensiveness of phosphopeptide identifications and change the selectivity of motifs identified with HAP-MudPIT. Improvements to the comprehensive enrichment of phosphopeptides of higher phosphorylation states may facilitate global analysis of phosphorylation cooperativity. The demonstration of phosphorylation analysis on mouse brain amygdala opens the possibility for many interesting biological studies on this and other mass-limited samples.
Supplementary Material
Figure 7.

We tested, characterized, and optimized single-step inline enrichment of phosphopeptides directly from whole cell and tissue lysates using a hydroxyapatite (HAP) microcolumn and Multi-dimensional Protein Identification Technology (MudPIT). We applied this optimized method to identify phosphorylation sites from mass-limited samples including a mouse brain region, the amygdala (200 – 500 μg), identifying up to 4000 phosphopeptides per run.
ACKNOWLEDGEMENTS
Funding for this research was provided by the National Institute of Health grants DK074798, P41 RR011823, and RC2DA028845; CAPES-Fiocruz 30/2006; and FAPERJ. We thank David Cheresh for the PDA cell line and Dong Wang and Surendra Dasari in David Tabb's Laboratory for SeeMS, a customized software package from ProteoWizard83 to annotate spectra. We thank James J. Moresco, Jeffery N. Savas, and Claire Delahunty for comments on the manuscript.
Footnotes
Supporting Information Available: This material is available free of charge at http://pubs.acs.org.
Raw data files can be found at http://fields.scripps.edu/published/HAP2012/.
References
- 1.Hunter T. The age of crosstalk: phosphorylation, ubiquitination, and beyond. Mol Cell. 2007;28(5):730–8. doi: 10.1016/j.molcel.2007.11.019. [DOI] [PubMed] [Google Scholar]
- 2.Beausoleil SA, Jedrychowski M, Schwartz D, Elias JE, Villen J, Li J, Cohn MA, Cantley LC, Gygi SP. Large-scale characterization of HeLa cell nuclear phosphoproteins. Proc Natl Acad Sci U S A. 2004;101(33):12130–5. doi: 10.1073/pnas.0404720101. [DOI] [PMC free article] [PubMed] [Google Scholar]
- 3.Huttlin EL, Jedrychowski MP, Elias JE, Goswami T, Rad R, Beausoleil SA, Villen J, Haas W, Sowa ME, Gygi SP. A tissue-specific atlas of mouse protein phosphorylation and expression. Cell. 2010;143(7):1174–89. doi: 10.1016/j.cell.2010.12.001. [DOI] [PMC free article] [PubMed] [Google Scholar]
- 4.Cohen P. The Croonian Lecture 1998. Identification of a protein kinase cascade of major importance in insulin signal transduction. Philos Trans R Soc Lond B Biol Sci. 1999;354(1382):485–95. doi: 10.1098/rstb.1999.0399. [DOI] [PMC free article] [PubMed] [Google Scholar]
- 5.Olsen JV, Vermeulen M, Santamaria A, Kumar C, Miller ML, Jensen LJ, Gnad F, Cox J, Jensen TS, Nigg EA, Brunak S, Mann M. Quantitative phosphoproteomics reveals widespread full phosphorylation site occupancy during mitosis. Sci Signal. 2010;3(104):ra3. doi: 10.1126/scisignal.2000475. [DOI] [PubMed] [Google Scholar]
- 6.Gnad F, Gunawardena J, Mann M. PHOSIDA 2011: the posttranslational modification database. Nucleic Acids Res. 2011;39(Database issue):D253–60. doi: 10.1093/nar/gkq1159. [DOI] [PMC free article] [PubMed] [Google Scholar]
- 7.Cantin GT, Venable JD, Cociorva D, Yates JR., 3rd Quantitative phosphoproteomic analysis of the tumor necrosis factor pathway. J Proteome Res. 2006;5(1):127–34. doi: 10.1021/pr050270m. [DOI] [PMC free article] [PubMed] [Google Scholar]
- 8.Liao L, McClatchy DB, Park SK, Xu T, Lu B, Yates JR., 3rd Quantitative analysis of brain nuclear phosphoproteins identifies developmentally regulated phosphorylation events. J Proteome Res. 2008;7(11):4743–55. doi: 10.1021/pr8003198. [DOI] [PMC free article] [PubMed] [Google Scholar]
- 9.Kruger M, Kratchmarova I, Blagoev B, Tseng YH, Kahn CR, Mann M. Dissection of the insulin signaling pathway via quantitative phosphoproteomics. Proc Natl Acad Sci U S A. 2008;105(7):2451–6. doi: 10.1073/pnas.0711713105. [DOI] [PMC free article] [PubMed] [Google Scholar]
- 10.Boersema PJ, Foong LY, Ding VM, Lemeer S, van Breukelen B, Philp R, Boekhorst J, Snel B, den Hertog J, Choo AB, Heck AJ. In-depth qualitative and quantitative profiling of tyrosine phosphorylation using a combination of phosphopeptide immunoaffinity purification and stable isotope dimethyl labeling. Mol Cell Proteomics. 2010;9(1):84–99. doi: 10.1074/mcp.M900291-MCP200. [DOI] [PMC free article] [PubMed] [Google Scholar]
- 11.McClatchy DB, Liao L, Park SK, Xu T, Lu B, Yates JR., Iii Differential proteomic analysis of mammalian tissues using SILAM. PLoS One. 2011;6(1):e16039. doi: 10.1371/journal.pone.0016039. [DOI] [PMC free article] [PubMed] [Google Scholar]
- 12.Hsu PP, Kang SA, Rameseder J, Zhang Y, Ottina KA, Lim D, Peterson TR, Choi Y, Gray NS, Yaffe MB, Marto JA, Sabatini DM. The mTOR-regulated phosphoproteome reveals a mechanism of mTORC1-mediated inhibition of growth factor signaling. Science. 2011;332(6035):1317–22. doi: 10.1126/science.1199498. [DOI] [PMC free article] [PubMed] [Google Scholar]
- 13.Li J, Rix U, Fang B, Bai Y, Edwards A, Colinge J, Bennett KL, Gao J, Song L, Eschrich S, Superti-Furga G, Koomen J, Haura EB. A chemical and phosphoproteomic characterization of dasatinib action in lung cancer. Nat Chem Biol. 2010;6(4):291–9. doi: 10.1038/nchembio.332. [DOI] [PMC free article] [PubMed] [Google Scholar]
- 14.Yu Y, Yoon SO, Poulogiannis G, Yang Q, Ma XM, Villen J, Kubica N, Hoffman GR, Cantley LC, Gygi SP, Blenis J. Phosphoproteomic analysis identifies Grb10 as an mTORC1 substrate that negatively regulates insulin signaling. Science. 2011;332(6035):1322–6. doi: 10.1126/science.1199484. [DOI] [PMC free article] [PubMed] [Google Scholar]
- 15.Sudhir PR, Hsu CL, Wang MJ, Wang YT, Chen YJ, Sung TY, Hsu WL, Yang UC, Chen JY. Phosphoproteomics identifies oncogenic Ras signaling targets and their involvement in lung adenocarcinomas. PLoS One. 2011;6(5):e20199. doi: 10.1371/journal.pone.0020199. [DOI] [PMC free article] [PubMed] [Google Scholar]
- 16.Monetti M, Nagaraj N, Sharma K, Mann M. Large-scale phosphosite quantification in tissues by a spike-in SILAC method. Nat Methods. 2011;8(8):655–8. doi: 10.1038/nmeth.1647. [DOI] [PubMed] [Google Scholar]
- 17.Wu R, Dephoure N, Haas W, Huttlin EL, Zhai B, Sowa ME, Gygi SP. Correct interpretation of comprehensive phosphorylation dynamics requires normalization by protein expression changes. Mol Cell Proteomics. 2011 doi: 10.1074/mcp.M111.009654. [DOI] [PMC free article] [PubMed] [Google Scholar]
- 18.Wu R, Haas W, Dephoure N, Huttlin EL, Zhai B, Sowa ME, Gygi SP. A large-scale method to measure absolute protein phosphorylation stoichiometries. Nat Methods. 2011;8(8):677–83. doi: 10.1038/nmeth.1636. [DOI] [PMC free article] [PubMed] [Google Scholar]
- 19.McNulty DE, Annan RS. Hydrophilic interaction chromatography reduces the complexity of the phosphoproteome and improves global phosphopeptide isolation and detection. Mol Cell Proteomics. 2008;7(5):971–80. doi: 10.1074/mcp.M700543-MCP200. [DOI] [PubMed] [Google Scholar]
- 20.Villen J, Gygi SP. The SCX/IMAC enrichment approach for global phosphorylation analysis by mass spectrometry. Nat Protoc. 2008;3(10):1630–8. doi: 10.1038/nprot.2008.150. [DOI] [PMC free article] [PubMed] [Google Scholar]
- 21.Washburn MP, Wolters D, Yates JR., 3rd Large-scale analysis of the yeast proteome by multidimensional protein identification technology. Nat Biotechnol. 2001;19(3):242–7. doi: 10.1038/85686. [DOI] [PubMed] [Google Scholar]
- 22.Wolters DA, Washburn MP, Yates JR., III An automated multidimensional protein identification technology for shotgun proteomics. Analytical Chemistry. 2001;73(23):5683–5690. doi: 10.1021/ac010617e. [DOI] [PubMed] [Google Scholar]
- 23.Masuda T, Sugiyama N, Tomita M, Ishihama Y. Microscale phosphoproteome analysis of 10,000 cells from human cancer cell lines. Anal Chem. 2011;83(20):7698–703. doi: 10.1021/ac201093g. [DOI] [PubMed] [Google Scholar]
- 24.Cantin GT, Shock TR, Park SK, Madhani HD, Yates JR., 3rd Optimizing TiO2-based phosphopeptide enrichment for automated multidimensional liquid chromatography coupled to tandem mass spectrometry. Anal Chem. 2007;79(12):4666–73. doi: 10.1021/ac0618730. [DOI] [PMC free article] [PubMed] [Google Scholar]
- 25.Xu S, Wong CC, Tong EH, Chung SS, Yates JR, 3rd, Yin Y, Ko BC. Phosphorylation by casein kinase 1 regulates tonicity-induced osmotic response element-binding protein/tonicity enhancer-binding protein nucleocytoplasmic trafficking. J Biol Chem. 2008;283(25):17624–34. doi: 10.1074/jbc.M800281200. [DOI] [PMC free article] [PubMed] [Google Scholar]
- 26.Holinger EP, Old WM, Giddings TH, Jr., Wong C, Yates JR, 3rd, Winey M. Budding yeast centrosome duplication requires stabilization of Spc29 via Mps1-mediated phosphorylation. J Biol Chem. 2009;284(19):12949–55. doi: 10.1074/jbc.M900088200. [DOI] [PMC free article] [PubMed] [Google Scholar]
- 27.Kay MI, Young RA, Posner AS. Crystal Structure of Hydroxyapatite. Nature. 1964;204:1050–2. doi: 10.1038/2041050a0. [DOI] [PubMed] [Google Scholar]
- 28.Boskey AL. Osteopontin and related phosphorylated sialoproteins: effects on mineralization. Ann N Y Acad Sci. 1995;760:249–56. doi: 10.1111/j.1749-6632.1995.tb44635.x. [DOI] [PubMed] [Google Scholar]
- 29.Cummings LJ, Snyder MA, Brisack K. Protein chromatography on hydroxyapatite columns. Methods Enzymol. 2009;463:387–404. doi: 10.1016/S0076-6879(09)63024-X. [DOI] [PubMed] [Google Scholar]
- 30.Schmidt SR, Schweikart F, Andersson ME. Current methods for phosphoprotein isolation and enrichment. J Chromatogr B Analyt Technol Biomed Life Sci. 2007;849(1–2):154–62. doi: 10.1016/j.jchromb.2006.09.016. [DOI] [PubMed] [Google Scholar]
- 31.Kadoya T, Ebihara M, Ishikawa T, Isobe T, Kobayashi A, Kuwahara H, Ogawa T, Okuyama T, Sumita M. A new spherical hydroxyapatite for high performance liquid chromatography of proteins. J. Liq. Chromatogr. 1986;9:3543–3557. [Google Scholar]
- 32.Ichitsuka T, Kawamura K, Ogawa T, Sumita M, Yokoo A. In: Packing material for liquid chromatography. U. States, editor. 1992. [Google Scholar]
- 33.Mamone G, Picariello G, Ferranti P, Addeo F. Hydroxyapatite affinity chromatography for the highly selective enrichment of mono- and multi-phosphorylated peptides in phosphoproteome analysis. Proteomics. 2010;10(3):380–93. doi: 10.1002/pmic.200800710. [DOI] [PubMed] [Google Scholar]
- 34.Krenkova J, Lacher NA, Svec F. Control of selectivity via nanochemistry: monolithic capillary column containing hydroxyapatite nanoparticles for separation of proteins and enrichment of phosphopeptides. Anal Chem. 2010;82(19):8335–41. doi: 10.1021/ac1018815. [DOI] [PubMed] [Google Scholar]
- 35.McClatchy DB, Dong MQ, Wu CC, Venable JD, Yates JR., 3rd 15N metabolic labeling of mammalian tissue with slow protein turnover. J Proteome Res. 2007;6(5):2005–10. doi: 10.1021/pr060599n. [DOI] [PMC free article] [PubMed] [Google Scholar]
- 36.Wu CC, MacCoss MJ, Howell KE, Matthews DE, Yates JR., 3rd Metabolic labeling of mammalian organisms with stable isotopes for quantitative proteomic analysis. Anal Chem. 2004;76(17):4951–9. doi: 10.1021/ac049208j. [DOI] [PubMed] [Google Scholar]
- 37.MacCoss MJ, Wu CC, Matthews DE, Yates JR., 3rd Measurement of the isotope enrichment of stable isotope-labeled proteins using high-resolution mass spectra of peptides. Anal Chem. 2005;77(23):7646–53. doi: 10.1021/ac0508393. [DOI] [PubMed] [Google Scholar]
- 38.McDonald WH, Tabb DL, Sadygov RG, MacCoss MJ, Venable J, Graumann J, Johnson JR, Cociorva D, Yates JR., 3rd MS1, MS2, and SQT-three unified, compact, and easily parsed file formats for the storage of shotgun proteomic spectra and identifications. Rapid Commun Mass Spectrom. 2004;18(18):2162–8. doi: 10.1002/rcm.1603. [DOI] [PubMed] [Google Scholar]
- 39.Xu T, Venable JD, Park SK, Cociorva D, Lu B, Liao L, Wohlschlegel J, Hewel J, Yates JR., 3rd ProLuCID, a fast and sensitive tandem mass spectra-based protein identification program. Mol Cell Proteomics. 2006;5(10):S174. [Google Scholar]
- 40.Cociorva D, D LT, Yates JR. Validation of tandem mass spectrometry database search results using DTASelect. Curr Protoc Bioinformatics. 2007;Chapter 13(Unit 13):4. doi: 10.1002/0471250953.bi1304s16. [DOI] [PubMed] [Google Scholar]
- 41.Tabb DL, McDonald WH, Yates JR., 3rd DTASelect and Contrast: tools for assembling and comparing protein identifications from shotgun proteomics. J Proteome Res. 2002;1(1):21–6. doi: 10.1021/pr015504q. [DOI] [PMC free article] [PubMed] [Google Scholar]
- 42.Beausoleil SA, Villen J, Gerber SA, Rush J, Gygi SP. A probability-based approach for high-throughput protein phosphorylation analysis and site localization. Nat Biotechnol. 2006;24(10):1285–92. doi: 10.1038/nbt1240. [DOI] [PubMed] [Google Scholar]
- 43.Lu B, Ruse C, Xu T, Park SK, Yates J., 3rd Automatic validation of phosphopeptide identifications from tandem mass spectra. Anal Chem. 2007;79(4):1301–10. doi: 10.1021/ac061334v. [DOI] [PMC free article] [PubMed] [Google Scholar]
- 44.Park SK, Venable JD, Xu T, Yates JR., 3rd A quantitative analysis software tool for mass spectrometry-based proteomics. Nat Methods. 2008;5(4):319–22. doi: 10.1038/nmeth.1195. [DOI] [PMC free article] [PubMed] [Google Scholar]
- 45.Cantin GT, Yi W, Lu B, Park SK, Xu T, Lee JD, Yates JR., 3rd Combining protein-based IMAC, peptide-based IMAC, and MudPIT for efficient phosphoproteomic analysis. J Proteome Res. 2008;7(3):1346–51. doi: 10.1021/pr0705441. [DOI] [PubMed] [Google Scholar]
- 46.Ye J, Zhang X, Young C, Zhao X, Hao Q, Cheng L, Jensen ON. Optimized IMAC-IMAC protocol for phosphopeptide recovery from complex biological samples. J Proteome Res. 2010;9(7):3561–73. doi: 10.1021/pr100075x. [DOI] [PubMed] [Google Scholar]
- 47.Larsen MR, Thingholm TE, Jensen ON, Roepstorff P, Jorgensen TJ. Highly selective enrichment of phosphorylated peptides from peptide mixtures using titanium dioxide microcolumns. Mol Cell Proteomics. 2005;4(7):873–86. doi: 10.1074/mcp.T500007-MCP200. [DOI] [PubMed] [Google Scholar]
- 48.Sugiyama N, Masuda T, Shinoda K, Nakamura A, Tomita M, Ishihama Y. Phosphopeptide enrichment by aliphatic hydroxy acid-modified metal oxide chromatography for nano-LC-MS/MS in proteomics applications. Mol Cell Proteomics. 2007;6(6):1103–9. doi: 10.1074/mcp.T600060-MCP200. [DOI] [PubMed] [Google Scholar]
- 49.Reynolds EC, Riley PF, Adamson NJ. A selective precipitation purification procedure for multiple phosphoseryl-containing peptides and methods for their identification. Anal Biochem. 1994;217(2):277–84. doi: 10.1006/abio.1994.1119. [DOI] [PubMed] [Google Scholar]
- 50.Xia Q, Cheng D, Duong DM, Gearing M, Lah JJ, Levey AI, Peng J. Phosphoproteomic analysis of human brain by calcium phosphate precipitation and mass spectrometry. J Proteome Res. 2008;7(7):2845–51. doi: 10.1021/pr8000496. [DOI] [PMC free article] [PubMed] [Google Scholar]
- 51.Zhang X, Ye J, Jensen ON, Roepstorff P. Highly Efficient Phosphopeptide Enrichment by Calcium Phosphate Precipitation Combined with Subsequent IMAC Enrichment. Mol Cell Proteomics. 2007;6(11):2032–42. doi: 10.1074/mcp.M700278-MCP200. [DOI] [PubMed] [Google Scholar]
- 52.Ruse CI, McClatchy DB, Lu B, Cociorva D, Motoyama A, Park SK, Yates JR., 3rd Motif-specific sampling of phosphoproteomes. J Proteome Res. 2008;7(5):2140–50. doi: 10.1021/pr800147u. [DOI] [PMC free article] [PubMed] [Google Scholar]
- 53.Fonslow BR, Yates JR., 3rd . Proteolytic digestion approaches for shotgun proteomics. In: Pawliszyn J, editor. Comprehensive Sampling and Sample Preparation: Analytical Techniques for Scientists. Elsevier Inc; USA: 2012. pp. [a]–[b]. [Google Scholar]
- 54.Eng JK, Mccormack AL, Yates JR. An Approach to Correlate Tandem Mass-Spectral Data of Peptides with Amino-Acid-Sequences in a Protein Database. J Am Soc Mass Spectrom. 1994;5(11):976–989. doi: 10.1016/1044-0305(94)80016-2. [DOI] [PubMed] [Google Scholar]
- 55.Schroeder MJ, Shabanowitz J, Schwartz JC, Hunt DF, Coon JJ. A eutral loss activation method for improved phosphopeptide sequence analysis by quadrupole ion trap mass spectrometry. Anal Chem. 2004;76(13):3590–8. doi: 10.1021/ac0497104. [DOI] [PubMed] [Google Scholar]
- 56.Ulintz PJ, Yocum AK, Bodenmiller B, Aebersold R, Andrews PC, Nesvizhskii AI. Comparison of MS(2)-only, MSA, and MS(2)/MS(3) methodologies for phosphopeptide identification. J Proteome Res. 2009;8(2):887–99. doi: 10.1021/pr800535h. [DOI] [PMC free article] [PubMed] [Google Scholar]
- 57.Alpert AJ, Petritis K, Kangas L, Smith RD, Mechtler K, Mitulovic G, Mohammed S, Heck AJ. Peptide orientation affects selectivity in ion-exchange chromatography. Anal Chem. 2010;82(12):5253–9. doi: 10.1021/ac100651k. [DOI] [PMC free article] [PubMed] [Google Scholar]
- 58.Motoyama A, Venable JD, Ruse CI, Yates JR., 3rd Automated ultra-high-pressure multidimensional protein identification technology (UHP-MudPIT) for improved peptide identification of proteomic samples. Anal Chem. 2006;78(14):5109–18. doi: 10.1021/ac060354u. [DOI] [PubMed] [Google Scholar]
- 59.Olsen JV, Schwartz JC, Griep-Raming J, Nielsen ML, Damoc E, Denisov E, Lange O, Remes P, Taylor D, Splendore M, Wouters ER, Senko M, Makarov A, Mann M, Horning S. A dual pressure linear ion trap Orbitrap instrument with very high sequencing speed. Mol Cell Proteomics. 2009;8(12):2759–69. doi: 10.1074/mcp.M900375-MCP200. [DOI] [PMC free article] [PubMed] [Google Scholar]
- 60.Bodenmiller B, Mueller LN, Mueller M, Domon B, Aebersold R. Reproducible isolation of distinct, overlapping segments of the phosphoproteome. Nat Methods. 2007;4(3):231–7. doi: 10.1038/nmeth1005. [DOI] [PubMed] [Google Scholar]
- 61.Hou Y, Morrison CJ, Cramer SM. Classification of protein binding in hydroxyapatite chromatography: synergistic interactions on the molecular scale. Anal Chem. 2011;83(10):3709–16. doi: 10.1021/ac103336h. [DOI] [PubMed] [Google Scholar]
- 62.Flotow H, Roach PJ. Role of acidic residues as substrate determinants for casein kinase I. J Biol Chem. 1991;266(6):3724–7. [PubMed] [Google Scholar]
- 63.Meggio F, Pinna LA. One-thousand-and-one substrates of protein kinase CK2? FASEB J. 2003;17(3):349–68. doi: 10.1096/fj.02-0473rev. [DOI] [PubMed] [Google Scholar]
- 64.Salvi M, Sarno S, Cesaro L, Nakamura H, Pinna LA. Extraordinary pleiotropy of protein kinase CK2 revealed by weblogo phosphoproteome analysis. Biochim Biophys Acta. 2009;1793(5):847–59. doi: 10.1016/j.bbamcr.2009.01.013. [DOI] [PubMed] [Google Scholar]
- 65.Pinna LA, Allende JE. Protein kinase CK2 in health and disease: Protein kinase CK2: an ugly duckling in the kinome pond. Cell Mol Life Sci. 2009;66(11–12):1795–9. doi: 10.1007/s00018-009-9148-9. [DOI] [PMC free article] [PubMed] [Google Scholar]
- 66.Trembley JH, Wang G, Unger G, Slaton J, Ahmed K. Protein kinase CK2 in health and disease: CK2: a key player in cancer biology. Cell Mol Life Sci. 2009;66(11–12):1858–67. doi: 10.1007/s00018-009-9154-y. [DOI] [PMC free article] [PubMed] [Google Scholar]
- 67.Sarno S, Pinna LA. Protein kinase CK2 as a druggable target. Mol Biosyst. 2008;4(9):889–94. doi: 10.1039/b805534c. [DOI] [PubMed] [Google Scholar]
- 68.Dominguez I, Sonenshein GE, Seldin DC. Protein kinase CK2 in health and disease: CK2 and its role in Wnt and NF-kappaB signaling: linking development and cancer. Cell Mol Life Sci. 2009;66(11–12):1850–7. doi: 10.1007/s00018-009-9153-z. [DOI] [PMC free article] [PubMed] [Google Scholar]
- 69.Miyata Y. Protein kinase CK2 in health and disease: CK2: the kinase controlling the Hsp90 chaperone machinery. Cell Mol Life Sci. 2009;66(11–12):1840–9. doi: 10.1007/s00018-009-9152-0. [DOI] [PMC free article] [PubMed] [Google Scholar]
- 70.St-Denis NA, Litchfield DW. Protein kinase CK2 in health and disease: From birth to death: the role of protein kinase CK2 in the regulation of cell proliferation and survival. Cell Mol Life Sci. 2009;66(11–12):1817–29. doi: 10.1007/s00018-009-9150-2. [DOI] [PMC free article] [PubMed] [Google Scholar]
- 71.Schweiger R, Linial M. Cooperativity within proximal phosphorylation sites is revealed from large-scale proteomics data. Biol Direct. 2010;5:6. doi: 10.1186/1745-6150-5-6. [DOI] [PMC free article] [PubMed] [Google Scholar]
- 72.Young NL, Plazas-Mayorca MD, Garcia BA. Systems-wide proteomic characterization of combinatorial post-translational modification patterns. Expert Rev Proteomics. 2010;7(1):79–92. doi: 10.1586/epr.09.100. [DOI] [PubMed] [Google Scholar]
- 73.Huang G, Chen S, Li S, Cha J, Long C, Li L, He Q, Liu Y. Protein kinase A and casein kinases mediate sequential phosphorylation events in the circadian negative feedback loop. Genes Dev. 2007;21(24):3283–95. doi: 10.1101/gad.1610207. [DOI] [PMC free article] [PubMed] [Google Scholar]
- 74.Becker JA, Befort K, Blad C, Filliol D, Ghate A, Dembele D, Thibault C, Koch M, Muller J, Lardenois A, Poch O, Kieffer BL. Transcriptome analysis identifies genes with enriched expression in the mouse central extended amygdala. Neuroscience. 2008;156(4):950–65. doi: 10.1016/j.neuroscience.2008.07.070. [DOI] [PMC free article] [PubMed] [Google Scholar]
- 75.Ecke LE, Cleck JN, White P, Schug J, Mifflin L, Blendy JA. CREB-mediated alterations in the amygdala transcriptome: coordinated regulation of immune response genes following cocaine. Int J Neuropsychopharmacol. 2011;14(8):1111–26. doi: 10.1017/S1461145710001392. [DOI] [PMC free article] [PubMed] [Google Scholar]
- 76.Lin LC, Lewis DA, Sibille E. A human-mouse conserved sex bias in amygdala gene expression related to circadian clock and energy metabolism. Mol Brain. 2011;4:18. doi: 10.1186/1756-6606-4-18. [DOI] [PMC free article] [PubMed] [Google Scholar]
- 77.Stork O, Stork S, Pape HC, Obata K. Identification of genes expressed in the amygdala during the formation of fear memory. Learn Mem. 2001;8(4):209–19. doi: 10.1101/lm.39401. [DOI] [PMC free article] [PubMed] [Google Scholar]
- 78.Surget A, Wang Y, Leman S, Ibarguen-Vargas Y, Edgar N, Griebel G, Belzung C, Sibille E. Corticolimbic transcriptome changes are state-dependent and region-specific in a rodent model of depression and of antidepressant reversal. Neuropsychopharmacology. 2009;34(6):1363–80. doi: 10.1038/npp.2008.76. [DOI] [PMC free article] [PubMed] [Google Scholar]
- 79.Whittle N, Li L, Chen WQ, Yang JW, Sartori SB, Lubec G, Singewald N. Changes in brain protein expression are linked to magnesium restriction-induced depression-like behavior. Amino Acids. 2011;40(4):1231–48. doi: 10.1007/s00726-010-0758-1. [DOI] [PubMed] [Google Scholar]
- 80.Yang RJ, Mozhui K, Karlsson RM, Cameron HA, Williams RW, Holmes A. Variation in mouse basolateral amygdala volume is associated with differences in stress reactivity and fear learning. Neuropsychopharmacology. 2008;33(11):2595–604. doi: 10.1038/sj.npp.1301665. [DOI] [PubMed] [Google Scholar]
- 81.Kyono Y, Sugiyama N, Imami K, Tomita M, Ishihama Y. Successive and selective release of phosphorylated peptides captured by hydroxy acid-modified metal oxide chromatography. J Proteome Res. 2008;7(10):4585–93. doi: 10.1021/pr800305y. [DOI] [PubMed] [Google Scholar]
- 82.Thingholm TE, Jensen ON, Robinson PJ, Larsen MR. SIMAC (sequential elution from IMAC), a phosphoproteomics strategy for the rapid separation of monophosphorylated from multiply phosphorylated peptides. Mol Cell Proteomics. 2008;7(4):661–71. doi: 10.1074/mcp.M700362-MCP200. [DOI] [PubMed] [Google Scholar]
- 83.Kessner D, Chambers M, Burke R, Agus D, Mallick P. ProteoWizard: open source software for rapid proteomics tools development. Bioinformatics. 2008;24(21):2534–6. doi: 10.1093/bioinformatics/btn323. [DOI] [PMC free article] [PubMed] [Google Scholar]
- 84.CRC Handbook of Chemistry and Physics. Chapman and Hall; Boca Raton, FL: 1999. [Google Scholar]
- 85.Harris DC. Quantitative chemical analysis. 5th ed W.H. Freeman; New York: 1999. p. xix.p. 899.p. 42.p. 34.p. 126. [Google Scholar]
- 86.Schwartz D, Gygi SP. An iterative statistical approach to the identification of protein phosphorylation motifs from large-scale data sets. Nat Biotechnol. 2005;23(11):1391–8. doi: 10.1038/nbt1146. [DOI] [PubMed] [Google Scholar]
Associated Data
This section collects any data citations, data availability statements, or supplementary materials included in this article.