Abstract
OBJECTIVES:
Leptin and adiponectin (APN) are adipokines produced by adipocytes that participate in the modulation of immune and inflammatory responses. In Crohn's disease (CD), fat wrapping surrounding the inflamed intestine produces high levels of leptin and APN. In inflammatory bowel disease (IBD), apoptosis resistance of lamina propria T lymphocytes (LPL-T) is one of the mechanisms that maintains chronic inflammation. We addressed the mechanism by which leptin and APN regulate inflammation and apoptosis in IBD.
METHODS:
Immune cell infiltration, several factors expressed by adipose tissue (AT), and spontaneous release of cytokines by adipocytes were measured. The presence of APN and leptin in intestinal mucosa was detected and their effect on LPL-T apoptosis, signal transducer and activator of transcription 3 (STAT3), Suppressor of Cytokine Signaling 3 (SOCS3), Bcl-2 and Bcl-xL expression, and cytokine production was studied. In addition, the effects of globular and high-molecular-weight (HMW) APN on LPL-T cytokine production and apoptosis were studied.
RESULTS:
Higher levels of several chemokines, cytokines, and growth factors were present in AT near active than near inactive disease. A significantly higher amount of inflammatory infiltrate was present in AT near active CD than near ulcerative colitis, controls, and near the inactive area of CD. There were no changes in the ratios of APN molecular weight in control and IBD adipocyte products. Leptin and APN inhibited anti-CD3-stimulated-LPL-T apoptosis and potentiated STAT3 phosphorylation, Bcl-2, and Bcl-xL expression in IBD and control mucosa. However, SOCS3 expression was suppressed only in IBD. Both globular and HMW APN have similar effects on LPL-T cytokine production and apoptosis. Leptin and APN enhanced interleukin (IL)-10 production by anti-CD3-stimulated LPL-T in IBD only. APN, but not leptin, increased anti-CD3-induced IL-6 levels in LPL-T only in IBD patients. IL-10 exerts its anti-inflammatory activity in the presence of SOCS3 suppression by leptin or APN.
CONCLUSION:
Leptin and APN maintain the inhibition of anti-CD3-stimulated LPL-T apoptosis by enhancing Bcl-2 and Bcl-xL overexpression and promoting STAT3 phosphorylation while suppressing SOCS3.
INTRODUCTION
Resistance of lamina propria T lymphocytes (LPL-T) to apoptosis is one of the key mechanisms that maintains chronic inflammation in inflammatory bowel disease (IBD).1 LPL-T from IBD patients have stronger in vitro proliferative responses to T-cell receptor/CD3 stimulation than those from normal mucosa,2 and they spontaneously proliferate in subjects with Crohn's disease (CD).3 These studies suggest that LPL-T in the mucosa of IBD patients, unlike the LPL-T of normal mucosa, react more strongly to exogenous antigens to which the mucosal T cells are constantly exposed. However, the mechanism of this LPL-T longevity and over-reactivity in IBD is not well established.
Several lines of evidence suggest that cytokines have a central role in the observed abnormal LPL-T function in IBD.4 However, the source of the cytokines responsible for the over-reactivity and longevity of LPL-T is relatively unknown. Several recent clinical and experimental observations point to the mesenteric adipocytes. For example, there is evidence that obesity is associated with a heightened inflammatory response in CD patients.5 Furthermore, intestinal luminal leptin, a cytokine produced by adipocytes, is increased in IBD and can upregulate nuclear factor kappa B expression in colonic epithelial cells.6 CD patients also typically display alterations of mesenteric fat depots, or ‘creeping fat', suggesting that the local adipose tissue (AT) and adipokines may be involved in the pathogenesis of IBD.7 These patients present with a selective enlargement of fat depots around the diseased lymph nodes and intestine, with an estimated >50% of the intestinal surface being covered by AT.8 A recent study demonstrated that fat wrapping is present in 100% of the patients with CD undergoing ileal resection and correlates significantly with the degree of acute and chronic inflammation, and particularly with the extent of transmural inflammation in the form of lymphoid aggregates.9 This peri-intestinal AT is present from the onset of disease and is associated with overexpression of tumor necrosis factor-alpha and leptin.10 Levels of adiponectin (APN), another cytokine produced by adipocytes, are also increased in the fat wrapping surrounding Crohn's lesions.11 Therefore, it is likely that a vicious cycle between AT and immune cells is the critical factor maintaining the sustained and intense intestinal inflammation required for tissue injury in patients with IBD. For example, leptin directly regulates production of several cytokines, particularly from T cells.12 In fact, leptin increases interleukin (IL)-2 and IFNγ production, while decreasing IL-4 levels.12 Therefore, leptin may have an important role in the regulation of the T-helper (Th)1/Th2 balance, which appears to be critical in the pathogenesis of IBD. Furthermore, APN modulates the inflammatory process and thus can also contribute to regulation of chronic intestinal inflammation in IBD. However, unlike leptin, the role of APN in inflammation is not straightforward and several studies report conflicting results, possibly because of its multi-molecular weights. Several investigators have reported that APN has anti-inflammatory effects, including inhibition of tumor necrosis factor-alpha production and activity, inhibition of nuclear factor kappa B activation, and induction of anti-inflammatory cytokines,13 while we14 and others15, 16 have shown that APN also exerts pro-inflammatory effects. In particular, a pro-inflammatory role for APN has been suggested in the context of arthritis by the demonstration that APN selectively induces production of IL-6 and matrix metalloproteinase-1 from synovial fibroblasts.15 Furthermore, in the human colonic epithelial cell line HT-29, APN stimulates proliferation and production of pro-inflammatory cytokines.16
How do adipokines promote LPL-T over-reactivity and longevity in IBD? Signal transducer and activator of transcription 3 (STAT3) and Suppressor of Cytokine Signaling 3 (SOCS3) are not only involved in intestinal inflammation,17 but they are also modulated by adipokines.18 It has been shown that high levels of phosphorylated STAT3, the active form, are present in both CD and ulcerative colitis (UC), but not in healthy intestine.17 Cytokines such as IL-6, IFN-γ, and leptin activate STAT3,19 while APN suppresses STAT3 activation.20 However, IL-10 requires STAT3 activation for its anti-inflammatory properties,21 indicating that STAT3 can be a part of both pro- and anti-inflammatory pathways. Interestingly, STAT3 mediates apoptosis resistance in chronic intestinal inflammation22 by binding to the promoter region of Bcl-xL and thereby enhancing transcription of this protein.23 In this report, we sought to elucidate the mechanism of LPL-T longevity and over-reactivity in IBD and to determine whether leptin and APN exert pro-inflammatory and anti-apoptotic activities on the intestinal LPL-T of patients with IBD. We demonstrate that leptin and APN maintain the pro-inflammatory state and increase apoptosis resistance in the LPL-T of IBD patients, possibly by STAT3 activation and SOCS3 suppression.
METHODS
Patients, sample collection, and chemokine, cytokine, and growth factor expression by AT
Patients with UC and CD were 25–65 years of age (n=12 of each group, six females and six males) and their average body mass index was 19.8 kg/m2. The diagnosis of IBD was based on standard clinical, endoscopic, and histological criteria. All patients had symptomatic active IBD that required surgical treatment. IBD patients were on corticosteroids and/or immunosuppressant medications. Indication for surgery varied from adenocarcinomas for controls to strictures or fistula for CD, and hemicolitis or pancolitis for UC. The use of medication and indication for surgery were recorded. A summary of patient characteristics, medication use, and indications for surgery is shown in Table 1.
Table 1. Demographic details of controls and IBD patients.
| Controls (n=12) | CD (n=12) | UC (n=12) | |
|---|---|---|---|
| Median age±s.d. (years) | 49.6 | 34.9 | 37.8 |
| Gender (female/male) | 6/6 | 6/6 | 6/6 |
| Use of medications (female/male) | |||
| Corticosteroids alone | 0/0 | 2/0 | 0/0 |
| Immunosuppressant alone | 0/0 | 0/2 | 1/0 |
| Combined use of corticosteroids and immunosuppressant | 0/0 | 4/4 | 4/6 |
| Indication for surgery (female/male) | |||
| Adenocarcinoma | 6/6 | 0/0 | 0/0 |
| Stricture | 0/0 | 4/4 | 0/0 |
| Fistula | 0/0 | 2/2 | 0/0 |
| Pancolitis | 0/0 | 0/0 | 4/4 |
| Hemicolitis | 0/0 | 0/0 | 2/2 |
CD, Crohn's disease; IBD, inflammatory bowel disease; UC, ulcerative colitis.
Intestinal mucosa was obtained from the macroscopically involved area and active inflammation was confirmed by histological examination of the involved area. From all IBD subjects, mucosal samples from the macroscopically uninvolved area at the margin of the resected bowel were also collected, and histological examination of these segments confirmed the lack of histological evidence of active inflammation. This study was approved by the institutional review board for safety of human subjects at the University of Illinois at Chicago, Rush University and the University of South Carolina.
In addition to mucosal samples, AT was collected. For more details, see Supplementary Materials online.
LPL-T and adipocyte isolation
For LPL-T and adipocyte isolation, see Supplementary Materials online.
Adipokine, cytokine release, and APN fractionation
Freshly isolated adipocytes were collected. Cell number was normalized by the weight of AT at 1 g/ml/well. Adipocytes were incubated in 24-well plates overnight. To measure IL-6, leptin, and APN production by adipocytes, 4 mg/ml of adipocyte supernatant, taken from each sample, and ELISA kits for IL-6 (BD Bioscience, San Jose, CA), leptin, and APN (eBioscience, San Diego, CA) were used.
To measure IL-6 and IL-10 production by LPL-T, flat-bottomed 96-well plates (Becton-Dickinson, San Jose, CA) were pre-coated with anti-CD3 monoclonal antibody (BD Bioscience) (5 μg/ml) for 2 h at 37°C. The isolated LPL-T (1 × 10⁵) were added to wells in the plate in 100 μl of RPMI 1640 medium supplemented with 2 mM L-glutamine, 100 IU/ml penicillin, and 100 μg/ml streptomycin. Anti-CD3-stimulated cells were incubated overnight in the presence or absence of 20 ng/ml of human recombinant leptin or 2 μg/ml of human recombinant globular APN (Peprotech, Rocky Hill, NJ). LPL-T were collected for further study and their supernatant (2 mg/ml) was used to detect IL-6 and IL-10 levels using ELISA kits from BD Bioscience. The distribution of APN multimeric forms, from mesenteric AT in IBD, was examined in adipocyte-derived products (ADPs) after fractionation as previously described14 using the Hi-Load Superdex Column (GE Healthcare, Uppsala, Sweden) and ELISA technique. The effect of HMW versus LMW and MMW of APN on LPL-T cytokine production and apoptosis was studied in addition to the effect of IL-10 on IL-6 production by LPL-T (see Supplementary Materials and Results online).
APN, leptin, and SOCS3 expression in control and IBD mucosa
For APN, leptin, and SOCS3 expression in control and IBD mucosa, see Supplementary Materials online.
SOCS3 expression by LPL-T in control and IBD mucosa
To detect SOCS3 expression by LPL-T of control and IBD patients, freshly isolated LPL-T (1 × 10⁵) were incubated in 5 μg/ml anti-CD3-pre-coated 96-well plates overnight. Leptin (20 ng/ml) or APN (2 μg/ml) was added and LPL-T were incubated for 1 h at 37°C and 5% CO2. Cells were collected. A proportion of the cells (5 × 10⁴) were fixed by 4% formaldehyde for later use to detect STAT3 and p-STAT3, and the remaining cells were frozen. Quantitative RT-PCR for SOCS3 was performed as previously described4 and normalized by calibrating against the expression of 18S RNA.
STAT3 and p-STAT3 expression by LPL-T
LPL-T (5 × 10⁴), treated with anti-CD3 in the presence or absence of leptin or APN, were fixed to detect STAT3 and p-STAT3 expression using the Raybio ELISA kit (Raybiotech, Norcross, GA) following the manufacturer's instructions.
Evaluation of apoptosis and cell viability
For apoptosis and cell viability detection in LPL-T, see Supplementary Materials online.
Protein extracts and western blot analysis
For protein extracts and western blot analysis, see Supplementary Materials online.
Hematoxylin and eosin staining of AT
To grade immune cell infiltration in the AT of control and IBD patients, the tissue was fixed in 10% buffered formalin overnight and paraffin embedded. Sections were stained with hematoxylin and eosin. The scores for AT immune cell infiltration are as follows: 0=none, 1=mild, 2=moderate, 3=severe immune cell infiltration. Scoring was performed in a blinded manner by a pathologist (RJC).
Immunohistochemistry of APN and leptin in IBD and control mucosa
To detect local APN and leptin presence in mucosa, tissue sections (5 μm) were stained for APN or leptin using goat anti-human APN (10 μg/ml) or leptin (1 μg/ml) antibody (R&D Systems, Minneapolis, MN) and the reaction was developed using diaminobenzidine. Two sets of controls were performed to ensure the specificity of the staining: (1) sections were stained with goat immunoglobulin G; (2) antibodies were pre-incubated with the respective recombinant proteins (10 μg/ml) for 1 h at room temperature before performing the staining procedure.
Statistical analysis
Differences in parameters were examined using factorial ANOVA and Student's T-test by the XLStat software (Addinsoft, Brooklyn, NY, USA).
RESULTS
Chemokine and cytokine expression by AT of CD
To evaluate the extent of AT inflammation in CD, levels of chemokines, cytokines, and growth factors were compared in the AT obtained near the active and inactive areas of the ileum from 12 CD patients (Table 2).
Table 2. Chemokine, cytokine, and growth factor expression by adipose tissue in CD.
| Inactive CD | Active CD | |
|---|---|---|
| (average±STE)a | (average±STE)b | |
| Chemokines | ||
| Eotaxin-2 (CCL24) | 0.77±0.77 | 23.63±2.55 |
| Eotaxin-3 (CCL26) | 1.07±0.58 | 76.57±6.15 |
| Fractalkine (CX3CL1) | 1.47±0.35 | 62.89±6.03 |
| GCP-2 (CXCL6) | 0.00±0.00 | 39.2±2.47 |
| I-309 (CCL1) | 0.17±0.09 | 29.53±2.60 |
| MCP-1 (CCL2) | 0.00±0.00 | 27.38±3.21 |
| MCP-2 (CCL8) | 0.00±0.00 | 18.37±2.23 |
| MCP-4 (CCL13) | 0.00±0.00 | 28.17±1.95 |
| MDC (CCL22) | 0.00±0.00 | 52.67±5.20 |
| MIG (CXCL9) | 0.00±0.00 | 53.9±3.98 |
| MIP-1γ (CCL9) | 0.00±0.00 | 58.8±3.77 |
| MIP-3α (CCL23) | 0.00±0.00 | 66.23±6.99 |
| NAP-2 (CXCL7) | 1.40±1.40 | 107.91±6.35 |
| PARC (CCL18) | 0.00±0.00 | 36.9±7.31 |
| Cytokines | ||
| IL-1α | 0.18±0.10 | 62.39±4.59 |
| IL-1β | 0.61±0.31 | 69.48±2.90 |
| IL-1rα | 0.95±0.12 | 81.84±2.55 |
| IL-2 | 0.63±0.35 | 90.09±4.32 |
| IL-3 | 2.72±0.22 | 104.23±3.24 |
| IL-4 | 0.40±0.40 | 61.69±14.02 |
| IL-5 | 0.03±0.03 | 33.80±4.27 |
| IL-6 | 0.40±0.40 | 190.21±16.57 |
| IL-7 | 0.13±0.13 | 27.02±6.38 |
| IL-10 | 2.11±0.21 | 12.43±1.20 |
| IL-13 | 0.57±0.35 | 7.5±0.45 |
| IL-15 | 0.63±0.38 | 27.27±2.04 |
| IL-16 | 0.07±0.07 | 22.67±1.31 |
| IL-17 | 0.84±0.07 | 65.17±7.20 |
| IFN-γ | 0.00±0.00 | 6.66±0.78 |
| TNF-α | 0.00±0.00 | 20.17±1.16 |
| Growth factors | ||
| Angiogenin | 2.27±0.49 | 54.61±8.38 |
| BMP-6 | 0.40±0.40 | 30.43±6.93 |
| FGF-6 | 2.55±0.84 | 74.67±5.52 |
| FGF-7 | 0.00±0.00 | 39.63±3.58 |
| Flt-3 ligand | 0.57±0.43 | 40.93±5.01 |
| GM-CSF | 0.48±0.37 | 50.62±13.59 |
| MCS-F | 0.00±0.00 | 43.57±4.23 |
| TGF-β | 0.00±0.00 | 2.10±0.09 |
| NT-3 | 0.00±0.00 | 39.28±2.24 |
BMP, bone morphogenetic protein; CD, Crohn's disease; FGF, fibroblast growth factor; GCP-2, granulocyte chemotactic protein-2; IFN, interferon; IL, interleukin; MCP, monocyte chemotactic protein; MCS-F, macrophage colony stimulating factor; MIP, macrophage inflammatory protein; MIG, monokine induced by gamma interferon; NAP-2, neutrophil-activating protein-2; NT-3, neurotrophin-3; PARC, pulmonary and activation-regulated chemokine; STE, standard error; TGF, tumor growth factor; TNF, tumor necrosis factor.
Note: Chemokine, cytokine, and growth factor expression by mesenteric adipose tissue was obtained near active and inactive CD.
Data represent the average of OD readings of spot density.
P<0.001 vs. levels in inactive CD (n=12).
Despite high expression of pro-inflammatory cytokines such as IL-17 and IL-23, there is higher expression of IL-10 in active CD, indicating that creeping fat in an active CD may modulate the inflammatory environment or may be an extension of the mucosal inflammatory milieu.
Adipokine and cytokine release from mesenteric AT in IBD
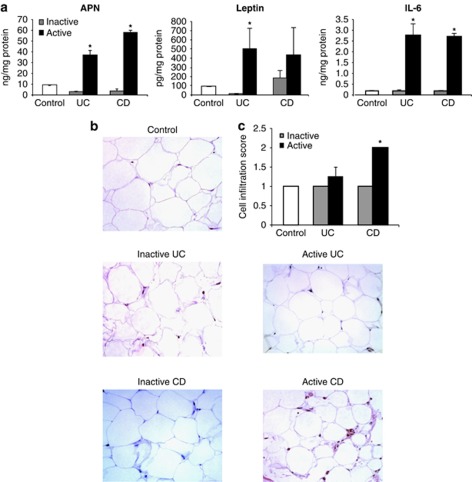
To investigate the production of AT-derived adipokines and cytokines in CD and UC, adipocytes were isolated, cultured overnight, and release of APN, leptin, and IL-6 was measured in the supernatant. As shown in Figure 1a, significantly higher levels of APN and IL-6 were released from adipocytes obtained from active areas of both UC and CD patients compared with adipocytes from inactive sites and controls. A similar finding was observed for leptin in UC patients, whereas leptin release was significantly increased in CD patients compared with controls irrespective of the site of origin of adipocytes. Furthermore, fractionations of APN obtained from ADP were compared to evaluate the relative presence of high- (HMW) vs. moderate- (MMW) and low-molecular-weight (LMW) complexes. As indicated in Supplementary Table 1, the percentage distribution of APN was comparable in each of the samples analyzed.
Figure 1.
Adipose tissue release of adiponectin (APN), leptin, and interleukin (IL)-6, and cell infiltration. (a) Adipocytes, obtained from the mesenteric adipose tissue (AT) adjacent to the active and inactive areas of inflammatory bowel disease (IBD) and control mucosa, were isolated and incubated at 37°C and 5% CO2 overnight. Active and inactive mucosa were obtained from the same patient and confirmed histologically (n=12). Adiponectin, leptin, and IL-6 levels were measured in the supernatant. *P<0.04 vs. levels in inactive areas of IBD. (b) Representative hematoxylin and eosin staining of AT. (c) Immune cell infiltration score in the AT of control and IBD. *P<0.05 vs. levels in the inactive area of Crohn's disease (CD). UC, ulcerative colitis.
Inflammatory infiltrate in AT in IBD
To evaluate adipocyte size and the presence of inflammatory infiltrate, histological analysis of AT obtained from CD, UC, and control subjects was performed. Adipocyte size was comparable in each group of patients and site of origin of AT (Figure 1b). A significantly higher inflammatory infiltrate was present in AT near active CD lesions compared with AT near the inactive segment of the intestine in CD (Figure 1b and c). In contrast, the inflammatory infiltrate of AT from UC patients was comparable to that of control subjects irrespective of the site of origin.
Adipokine expression and presence in control and IBD mucosa
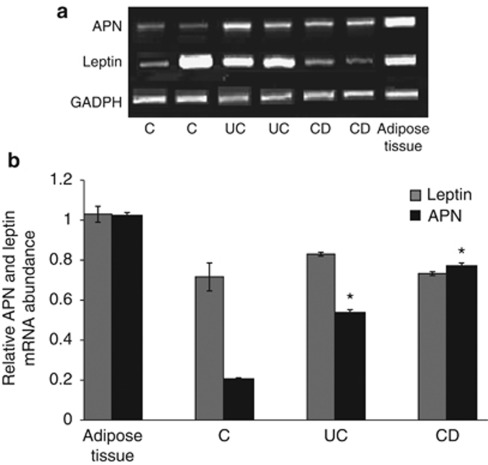
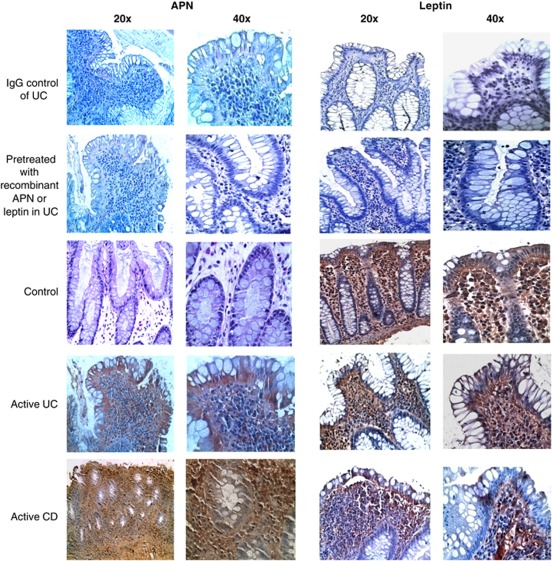
To evaluate whether APN and leptin are expressed in the intestinal mucosa, PCR, quantitative RT-PCR, and immunohistochemical studies were performed. As shown in Figure 2a, mRNA for both APN and leptin was expressed in the mucosa of control and IBD patients. Lower APN mRNA levels were observed in control compared with IBD patients, whereas leptin expression was variable among the groups (Figure 2b). Immunohistochemistry analysis revealed that, at the protein levels, APN was not detectable in control mucosa, whereas leptin was present in the lamina propria and in epithelial cells of control subjects. Both APN and leptin were detectable in mucosa obtained from active CD and UC, with high immune reactivity in the lamina propria (Figure 3). APN and leptin in inactive IBD mucosa have similar patterns of expression and presence as seen in control mucosa (data not shown).
Figure 2.
(a) Representative messenger (m)RNA expression for adiponectin (APN), leptin, and GAPDH in the colonic mucosa of control (C) and active inflammatory bowel disease (IBD). (b) Quantitative reverse transcriptase-polymerase chain reaction for APN and leptin in the control adipose and colonic tissues obtained from active IBD mucosa. *P<0.05 vs. control mucosa (n=12 per group). CD, Crohn's disease; GADPH, glyceraldehyde-3-phosphate dehydrogenase; UC, ulcerative colitis.
Figure 3.
Adiponectin and leptin presence in control and inflammatory bowel disease (IBD) mucosa. Representative immunohistochemistry for adiponectin (APN) and leptin in the colonic mucosa of control and active IBD. CD, Crohn's disease; UC, ulcerative colitis.
Effects of leptin and APN on LPL-T apoptosis
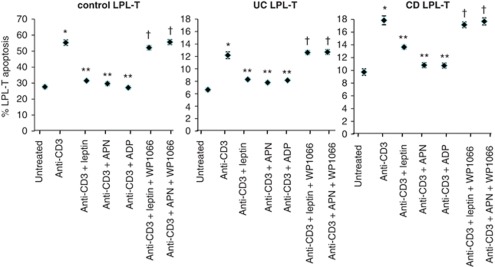
As previously demonstrated,1, 24 high rates of apoptosis were observed in unstimulated LPL-T obtained from control subjects compared with either CD or UC patients. The rate of LPL-T cell apoptosis in controls was 2.5-fold more than that in IBD patients (Figure 4). Stimulation of LPL-T with anti-CD3 significantly increased LPL-T apoptosis in cells obtained from both control subjects and IBD patients. Addition of either leptin or APN significantly reduced the apoptosis rates in anti-CD3-stimulated LPL-T, with comparable effects observed in cells obtained from control and IBD subjects. When mucosal-derived products (MDPs) were evaluated for APN and leptin content, a significant release of APN and leptin from mucosal tissue was observed in cultures of a larger sample (1 cm2) as compared with 2 mm2 sample size. In addition, LPL-T apoptosis was evaluated in different MDP-level treatments (Table 3). Furthermore, STAT3 inhibitor ‘WP 1066' rescued the LPL-T of control and IBD from undergoing apoptosis, suggesting that STAT3 has a direct effect on LPL-T viability (Figure 4). As HMW APN activates nuclear factor kappa B25 and induces IL-6 in human monocytes,26 we studied the effect of HMW on LPL-T apoptosis and IL-6 production in IBD. We found that HMW APN had a similar effect as the recombinant globular APN (Supplementary Table 1). In contrast, MMW and LMW did not have any effect on LPL-T apoptosis (data not shown).
Figure 4.
Effect of leptin, adiponectin (APN), and adipocyte-derived product (ADP), in the presence of CD3 monoclonal antibody stimulation and signal transducer and activator of transcription 3 (STAT3) inhibitor, on lamina propria T lymphocyte (LPL-T) apoptosis. LPL-T were isolated from control and active inflammatory bowel disease (IBD) mucosa. LPL-T were incubated overnight with leptin (20 ng/ml), APN (2 μg/ml), or ADP (4 mg/ml) in a 96-well plate pre-coated with anti-CD3 (2 μg/ml) and STAT3 inhibitor WP1066 (3 μmol/l). LPL-T apoptosis was detected by Annexin-V and propidium iodide using flow cytometry. *P<0.05 vs. untreated LPL-T. **P<0.05 vs. LPL-T treated with anti-CD3, †P<0.05 vs. LPL-T treated with anti-CD3 + leptin or APN (n=12 per group).
Table 3. Mucosal levels of leptin and APN and the effect of different protein concentrations of MDP on LPL-T apoptosis.
| Mucosal area | Local leptin level (ng per mg protein supernatant) | Local APN level (pg per mg protein supernatant) | % LPL-T apoptosis after mAb CD3 and MDP stimulation |
|---|---|---|---|
| 2±0.2 mm2 mucosa (38±1.3 mg weight) | |||
| C | 2.21±0.1 | 3.1±0.8 | 55.7±4.6 |
| UC | 32.8.3±2.7 | 41.2±0.23 | 13.5±1.1 |
| CD | 39.8.1±2.8 | 44.9.1±0.28 | 16.5±1.3 |
| 1±0.15 cm2 mucosa (200±2.4 mg weight) | |||
| C | 12.2±0.9 | 17.3±1.3 | 31.6±3.9a |
| UC | 190±7.9 | 223±7.3 | 7.8±0.8a |
| CD | 220±8.5 | 242±10.6 | 11.3±1.8a |
APN, adiponectin; C, control; CD, Crohn's disease; mAb, monoclonal antibody; LPL-T, lamina propria T lymphocytes; MDP, mucosal-derived product; UC, ulcerative colitis.
Note: Data represent the average of leptin and APN levels in two different mucosal sizes and weights obtained from control and active IBD. Values are average±standard error; n=12.
P<0.05 versus % LPL-T apoptosis stimulated with low protein levels of respective MDP (120 μg/ml).
Effects of leptin, APN, and IL-10 on cytokine release by LPL-T
To characterize the effects of leptin, APN, and IL-10 on cytokine production by LPL-T, levels of IL-6 and IL-10 were measured. For more details, see Supplementary Data online.
Cell survival and anti-apoptotic protein expression by LPL-T
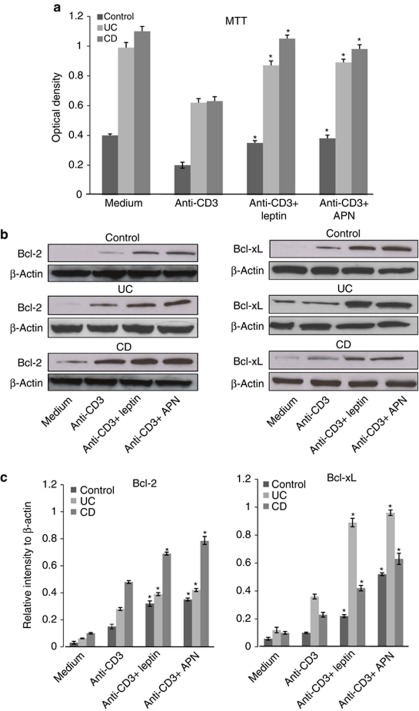
Changes in cytokine production by LPL-T correlate closely with the cell survival effects of the different treatments. Therefore, we studied LPL-T cell viability in culture using the 3-[4,5-dimethylthiazol-2-yl]-2,5-diphenyltetrazolium bromide assay. We found that leptin and APN enhanced the survival rates of anti-CD3-treated LPL-T to levels similar to that observed prior to anti-CD3 treatment in all groups, suggesting that both leptin and APN exert anti-apoptotic activities in individuals with IBD (Figure 5a). In order to study the mechanism that promotes LPL-T apoptosis resistance, the expression of anti-apoptotic proteins Bcl-xL and Bcl-2 was measured. Addition of leptin or APN to anti-CD3-stimulated LPL-T enhanced Bcl-xL and Bcl-2 expression in both control and IBD (Figures 5b and c).
Figure 5.
The effect of leptin and adiponectin (APN) on anti-CD3-stimulated lamina propria T lymphocyte (LPL-T) viability as well as Bcl-2 and Bcl-xL expression. Graphical summaries of 3-[4,5-dimethylthiazol-2-yl]-2,5-diphenyltetrazolium bromide (MTT) assay (a). Representative immunoblots (b) and graphical summaries (c) of the relative intensity of Bcl-2 and Bcl-xL expression by LPL-T. Values are expressed as average±standard error (n=12 for each group). *P<0.05 vs. cells treated with anti-CD3 alone.
Effects of leptin and APN on STAT3, p-STAT3, and SOCS3 expression by LPL-T
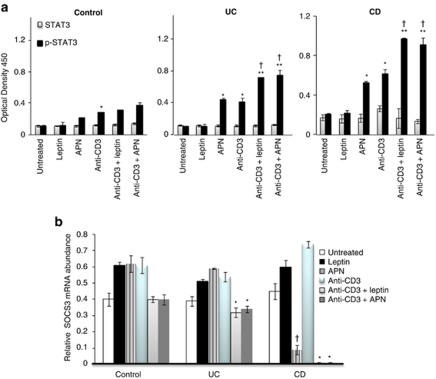
Activation of STAT3 and expression of SOCS3 were evaluated in unstimulated and anti-CD3-stimulated LPL-T in the presence or absence of leptin or APN. As shown in Figure 6a, comparable levels of p-STAT3 were observed in unstimulated LPL-T obtained from control, CD, and UC patients. Addition of APN significantly increased p-STAT3 in cells from UC and CD patients but had no effect on cells from control subjects, whereas leptin did not significantly alter p-STAT3 levels in unstimulated cells from any of the groups. In contrast, both leptin and APN significantly increased p-STAT3 levels in anti-CD3-stimulated cells from control, UC, and CD patients, with a significantly stronger effect observed in cells from IBD patients, particularly CD, compared with control subjects.
Figure 6.
Signal transducer and activator of transcription 3 (STAT3), p-STAT3, and Suppressor of Cytokine Signaling 3 (SOCS3) expression by lamina propria T lymphocytes (LPL-T) treated with different stimuli in control and inflammatory bowel disease (IBD) mucosa. (a) LPL-T were incubated for 1 h with leptin (20 ng/ml) or adiponectin (APN, 2 μg/ml) in a 96-well plate pre-coated with anti-CD3 (2 μg/ml). STAT3 and p-STAT3 expression was determined by enzyme-linked immunosorbent assay. *P<0.05 vs. untreated LPL-T in IBD. **P<0.05 vs. anti-CD3-treated LPL-T. †P<0.05 for p-STAT3 levels in IBD vs. control LPL-T of the respective treatment (n=12 per group). (b) Quantitative reverse transcriptase-polymerase chain reaction (RT-PCR) for SOCS3 expression by LPL-T. Using the same dosages of leptin, APN, and anti-CD3 as previously described, LPL-T were incubated for 1 h with leptin or APN in a 96-well plate pre-incubated with anti-CD3. SOCS3 expression was determined by quantitative RT-PCR. *P<0.05 vs. levels of anti-CD3 treated LPL-T. †P<0.05 vs. levels of untreated LPL-T (n=12 per group).
As shown in Figure 6b, expression of SOCS3 in LPL-T from control subjects was not significantly altered by any of the culture conditions. In contrast, both leptin and APN significantly reduced SOCS3 expression in anti-CD3-stimulated LPL-T from UC and CD patients, with a more marked effect in cells from CD patients. In this latter group, APN also significantly reduced SOCS3 expression in unstimulated LPL-T.
Thus, in agreement with the data on cytokine production, LPL-T from IBD patients appeared to be more susceptible to the effects of leptin and APN on STAT3 activation and SOCS3 expression, compared with cells obtained from control subjects.
DISCUSSION
Creeping fat that surrounds CD lesions is one of the hallmarks of CD. The extent of the creeping fat typically correlates with the severity of intestinal inflammation and tissue injury. This clinical observation suggests an important role for AT in the intestinal inflammatory process in CD. Thus, we first sought to study the chemokine and cytokine expression in AT of active and inactive CD. We found that hypertrophied, inflamed, AT near active CD expresses many chemokines, Th1, and Th2 cytokines, which places the already inflamed mucosa into an additional microenvironment that may potentiate either more inflammatory cascades, by releasing inflammatory chemokines and cytokines, or produce anti-inflammatory factors that counteract the inflammatory condition in the mucosa. It is noteworthy that IL-10 expression is increased in the AT of active CD possibly because of the corticosteroid use of most of the patients.27 In addition, the expression of IL-17 is increased in the active phase of CD, suggesting that the Th-17 cells infiltrate in the AT. Also, the increased expression of IL-23 in active disease further supports that IL-23 either via IL-17 or directly is linked to the presence of Th-17 cells in the creeping fat of CD. The latter interpretation is suggested by the findings of IL-23 as a T-cell-independent inducer of mucosal inflammation.28
We then measured the spontaneous production of leptin, APN, and IL-6 by adipocytes obtained near active IBD and found that these cytokines are produced at higher levels than those produced by adipocytes from the inactive segments of the intestine from IBD patients. Despite higher levels of systemic leptin and APN in healthy women than in healthy men,29 we found insignificant differences in local adipocyte production of leptin and APN in healthy and IBD women vs. male patients (data not shown). This finding suggests that the high levels of local leptin and APN in active IBD are gender independent. However, our findings should be confirmed in a larger sample.
Finally, we assessed immune cell infiltration in AT and found that it is increased significantly near active CD, suggesting that ADP increases the production of chemokines30 that attract more immune cells and therefore participate in the inflammatory milieu near CD. However, immune cell infiltration was not altered in AT near active UC. This observation can be explained by the absence of fat wrapping in UC lesions and the superficial nature of mucosal inflammation in UC. In contrast, the inflammatory process in CD is a transmural one involving the entire thickness of the intestinal wall. This would lead to a close interaction of mesenteric AT with the intestinal infiltrated immune cells and exposure of the surrounding AT to the immune cell-derived chemokines and growth factors, resulting in attraction of more immune cells to the AT and promotion of adipogenesis31 and angiogenesis.
Leptin and APN are expressed and present in IBD mucosa. In contrast to a previous report showing that leptin was absent in normal mucosa,6 we found that leptin was present in epithelial cells and the lamina propria layer in both control and IBD patients. Furthermore, leptin and APN were produced by mucosal IBD. Our finding is supported by a prior study reporting that leptin, secreted by gastric epithelium, can reach the intestine in an active form and has the potential to act on luminal targets.32 However, being more prevalent in IBD mucosa than leptin, APN may have a key role in modulating the local inflammatory environment.
In the present study, we confirmed our prior findings in a dextran sulfate sodium (DSS) animal model of colitis and showed that APN staining distribution was found in active IBD.14 Whether leptin or APN is produced by epithelial cells or taken up by the epithelial cells from the luminal intestinal content remains to be determined.
One of the mechanisms of dysregulated mucosal immune response and ‘over-reactive' mucosal immune cells in IBD is the reduction of LPL-T apoptosis rate.33 Apoptosis helps regulate mucosal lymphocyte population size, terminates the immune response at sites of antigen exposure, and prevents the activation and clonal expansion of potentially self-reactive lymphocytes. We and others have shown that mucosal T cells in IBD are resistant to apoptosis.24, 34 In this report, we show that leptin and APN diminished the apoptosis rate in anti-CD3-stimulated LPL-T of control and IBD patients. Leptin inhibition of LPL-T apoptosis is most likely due to the upregulation of an anti-apoptotic gene such as Bcl-xL.35 As local levels of leptin and APN are elevated in IBD as compared with controls6, 11 and as demonstrated in Table 3, the possible effect of leptin and APN on the apoptosis resistance of LPL-T in IBD is greater than that in control LPL-T. Our data are supported by published reports indicating that leptin exerts anti-apoptotic activities in stress-induced apoptosis in T lymphocytes.35 Similarly, APN reduced the apoptosis rate in anti-CD3-activated LPL-T in both control and IBD samples. This finding is in contrast with the pro-apoptotic and anti-inflammatory activities of APN on endothelial cells.36 However, APN can also mediate anti-apoptotic activity in pancreatic beta cells,37 suggesting that the cell target and the type of inflammatory microenvironment might have a critical role in determining the role of APN as a pro- vs. anti-apoptotic molecule. How do LPL-T evade apoptosis? STAT3 has a role in apoptosis resistance22 and is activated in the LPL-T of IBD patients.17 Hence, we found that inhibiting STAT3 activation increased LPL-T apoptosis, indicating that STAT3 has a crucial role in LPL-T apoptosis resistance that leads to chronic inflammation in IBD. A possible mechanism whereby STAT3 exerts its anti-apoptotic activity is through overexpression of anti-apoptotic proteins such as Bcl-238 and Bcl-xL.39 Hence, we show that Bcl-2 and Bcl-xL expression is enhanced in anti-CD3-stimulated LPL-T that were treated with leptin or APN in control with remarkable expression in IBD.
Neither leptin nor APN increases the IL-6 production in anti-CD3-stimulated LPL-T of control mucosa. In addition, leptin did not enhance the IL-6 production of anti-CD3-stimulated LPL-T of IBD patients, despite IL-6 expression by LPL-T (data not shown), but its presence was sufficient to activate the LPL-T to produce IL-10 that may counteract the inflammatory function of IL-6. On the other hand, APN augmented the production of IL-6 and IL-10 by anti-CD3-stimulated LPL-T in IBD compared with control mucosa, suggesting that activated LPL-T of IBD patients are susceptible to APN activation. The proinflammatory effect of APN on IL-6 production has also been observed in mouse cardiac fibroblasts.18 However, it is important to note that a compensatory anti-inflammatory activity of IL-10 may counteract APN and hence block its bioactivity.
In our study, treatment of anti-CD3 activated STAT3 in the LPL-T of control and IBD mucosa. However, leptin-sensitized anti-CD3 stimulated LPL-T that led to a significant overexpression of p-STAT3 in the LPL-T of control mucosa. In addition, a significant increase in p-STAT3 expression is present in anti-CD3-stimulated LPL-T of UC, suggesting that local leptin is active and could bind to its receptor on LPL-T.
The effect of APN on the transcription factor STAT3 is not well established and several studies have demonstrated conflicting results. For example, APN inhibits p-STAT3 expression in hepatocellular and prostate cancer cell lines20 and thus APN appears to act as a pro-apoptotic molecule. In contrast, we and others found that APN served as a pro-inflammatory cytokine14, 40 and induced STAT3 activation in cardiac fibroblasts.18 In the present study, we found that APN activated STAT3 in the LPL-T of intestinal mucosal T cells in IBD patients independent of anti-CD3 stimulation. APN activates STAT3 in both unstimulated and anti-CD3-stimulated LPL-T cells from IBD patients. Our finding suggests that the LPL-T of IBD patients are sensitized to APN in the absence of a stimulus that leads to STAT3 activation. In contrast to IBD LPL-T cells, APN activates STAT3 in only anti-CD3-stimulated LPL-T in controls. APN may exert its stimulatory effects by activating the APN receptor in T cells.41 Our studies are the first demonstration of such activities in LPL-T.
SOCS3 expression is implicated in inhibiting STAT3 activation. SOCS3 expression by LPL-T was not altered in control mucosa in the presence of anti-CD3, leptin, or APN. However, its expression is reduced in anti-CD3 and leptin or APN-stimulated LPL-T of UC and sharply diminished in CD. Our data suggest that STAT3 is inhibited by SOCS3 in control mucosa, but it is constantly activated in the LPL-T of IBD patients due to the low expression of SOCS3, indicating that anti-CD3-stimulated LPL-T of IBD patients are more sensitive to leptin and APN than those of controls. These findings support the notion that activated LPL-T, in the presence of APN or leptin, evades apoptosis. The low rates of LPL-T apoptosis could be due to STAT3 activation, because activated STAT3 is critical for T-cell proliferation and apoptosis resistance.42 The resistance to apoptosis could be because of the high ratio of anti-apoptotic protein expression to pro-apoptotic protein expression,43 which is one of the immunological manifestations in the LPL-T of patients with active IBD. Moreover, IL-10 exerts its anti-inflammatory effect in the presence of SOCS3 suppression caused by leptin and APN, suggesting that IL-10 may activate SOCS3 or that its bioactivity is not affected by the suppression of SOCS3.44
Furthermore, previous studies have reported that HMW APN may be the active form of APN, as changes in serum HMW APN, but not total APN levels, have been observed following treatment with thiazolidinediones, with an associated improvement in hepatic insulin sensitivity.45 On the other hand, globular APN activates nuclear factor kappa B in vascular endothelial cells,46 suggesting that cleavage of APN at sites of inflammation might facilitate the pro-inflammation properties.47 We found no differences in the ratios of the molecular weights of APN in the mesenteric fat of control and IBD subjects, and HMW is the active form of APN as well as of globular APN, both of which have pro-inflammatory function25 that may lead to LPL-T apoptosis resistance.
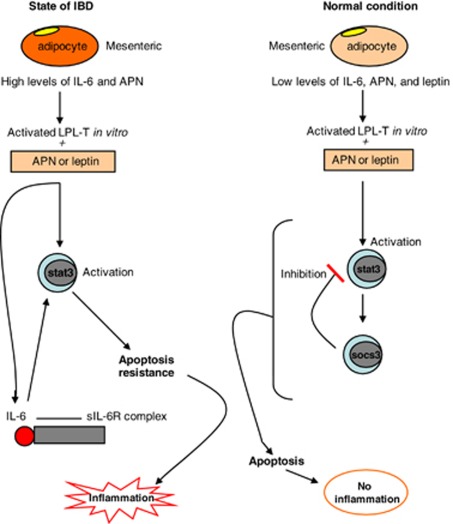
In conclusion, as summarized in Figure 7, our study demonstrates that leptin and APN are present in the intestinal mucosa and are involved in the apoptosis resistance of LPL-T, possibly by constant STAT3 phosphorylation and inhibition of SOCS3 expression. Anti-CD3-stimulated LPL-T from IBD mucosa are more sensitive to APN and leptin to produce cytokines and evade apoptosis than those from control mucosa. Local neutralization of leptin and APN that inhibits STAT3 activation in LPL-T may be a novel therapeutic target for IBD treatment.
Figure 7.
A proposed model for the role of adipokines in inflammatory bowel disease (IBD). Interleukin (IL)-6 and adiponectin (APN) production by adipocytes is increased near active IBD compared with normal mucosa. Anti-CD3-stimulated lamina propria T lymphocytes (LPL-T) of active IBD, in the presence of leptin or APN, activate signal transducer and activator of transcription 3 (STAT3) and induce IL-6 production, which maintains STAT3 activation. In contrast, anti-CD3-activated LPL-T of normal mucosa do not induce IL-6 production, in the presence of leptin or APN, but activate STAT3, where its activity is blunted by Suppressor of Cytokine Signaling 3 (SOCS3) expression leading to STAT3 inhibition. Apoptosis resistance occurred in the LPL-T of IBD patients due to continuing STAT3 activity in the absence of SOCS3, wherein apoptosis occurred in normal mucosa due to the inhibitory effect of SOCS3 on STAT3 in LPL-T.
Study Highlights
Acknowledgments
We thank Gaye Chritmus for editorial assistance and Andrew R. Hall, Dr Delia Daian, Mary Marshalls, Dr Hani Nissan, and Samuel Bracamonte for technical support. The local ethics committee approved the informed consent, specifying that material not needed for diagnostic purposes could be used for research purposes.
Guarantor of the article: Raja Fayad, MD
Specific author contributions: Raja Fayad was involved in developing the study concept and design and writing of the paper; Venkatesh Ponemone and Giamila Fantuzzi assisted in study design; Ali Keshavarzian, Marc I. Brand, Theodore Saclarides, and Herand Abcarian provided material support; Robert J. Cabay, Emma Fletcher, and Bianca Larsen assisted in data analysis and interpretation.
Financial support: This work was supported by the CCFA career development award (to R.F.) and NIH grant DK061483 (to G.F.).
Potential competing interests: None.
Footnotes
Supplementary Information accompanies this paper on the Clinical and Translational Gastroenterology website (http://www.nature.com/ctg)
Supplementary Material
References
- Bu P, Keshavarzian A, Stone DD, et al. Apoptosis: one of the mechanisms that maintains unresponsiveness of the intestinal mucosal immune system. J Immunol. 2001;166:6399–6403. doi: 10.4049/jimmunol.166.10.6399. [DOI] [PubMed] [Google Scholar]
- Qiao L, Golling M, Autschbach F, et al. T cell receptor repertoire and mitotic responses of lamina propria T lymphocytes in inflammatory bowel disease. Clin Exp Immunol. 1994;97:303–308. doi: 10.1111/j.1365-2249.1994.tb06085.x. [DOI] [PMC free article] [PubMed] [Google Scholar]
- Autschbach F, Schurmann G, Qiao L, et al. Cytokine messenger RNA expression and proliferation status of intestinal mononuclear cells in noninflamed gut and Crohn's disease. Virchows Arch. 1995;426:51–60. doi: 10.1007/BF00194698. [DOI] [PubMed] [Google Scholar]
- Liu Z, Geboes K, Colpaert S, et al. IL-15 is highly expressed in inflammatory bowel disease and regulates local T cell-dependent cytokine production. J Immunol. 2000;164:3608–3615. doi: 10.4049/jimmunol.164.7.3608. [DOI] [PubMed] [Google Scholar]
- Blain A, Cattan S, Beaugerie L, et al. Crohn's disease clinical course and severity in obese patients. Clin Nutr. 2002;21:51–57. doi: 10.1054/clnu.2001.0503. [DOI] [PubMed] [Google Scholar]
- Sitaraman S, Liu X, Charrier L, et al. Colonic leptin: source of a novel proinflammatory cytokine involved in IBD. Faseb J. 2004;18:696–698. doi: 10.1096/fj.03-0422fje. [DOI] [PubMed] [Google Scholar]
- Desreumaux P, Ernst O, Geboes K, et al. Inflammatory alterations in mesenteric adipose tissue in Crohn's disease. Gastroenterology. 1999;117:73–81. doi: 10.1016/s0016-5085(99)70552-4. [DOI] [PubMed] [Google Scholar]
- Sheehan AL, Warren BF, Gear MW, et al. Fat-wrapping in Crohn's disease: pathological basis and relevance to surgical practice. Br J Surg. 1992;79:955–958. doi: 10.1002/bjs.1800790934. [DOI] [PubMed] [Google Scholar]
- Borley NR, Mortensen NJ, Jewell DP, et al. The relationship between inflammatory and serosal connective tissue changes in ileal Crohn's disease: evidence for a possible causative link. J Pathol. 2000;190:196–202. doi: 10.1002/(SICI)1096-9896(200002)190:2<196::AID-PATH513>3.0.CO;2-5. [DOI] [PubMed] [Google Scholar]
- Barbier M, Vidal H, Desreumaux P, et al. Overexpression of leptin mRNA in mesenteric adipose tissue in inflammatory bowel diseases. Gastroenterol Clin Biol. 2003;27:987–991. [PubMed] [Google Scholar]
- Yamamoto K, Kiyohara T, Murayama Y, et al. Production of adiponectin, an anti-inflammatory protein, in mesenteric adipose tissue in Crohn's disease. Gut. 2005;54:789–796. doi: 10.1136/gut.2004.046516. [DOI] [PMC free article] [PubMed] [Google Scholar]
- Lord GM, Matarese G, Howard JK, et al. Leptin modulates the T-cell immune response and reverses starvation-induced immunosuppression. Nature. 1998;394:897–901. doi: 10.1038/29795. [DOI] [PubMed] [Google Scholar]
- Fantuzzi G.Adipose tissue, adipokines, and inflammation J Allergy Clin Immunol 2005115911–919.quiz 920. [DOI] [PubMed] [Google Scholar]
- Fayad R, Pini M, Sennello JA, et al. Adiponectin deficiency protects mice from chemically induced colonic inflammation. Gastroenterology. 2007;132:601–614. doi: 10.1053/j.gastro.2006.11.026. [DOI] [PubMed] [Google Scholar]
- Ehling A, Schaffler A, Herfarth H, et al. The potential of adiponectin in driving arthritis. J Immunol. 2006;176:4468–4478. doi: 10.4049/jimmunol.176.7.4468. [DOI] [PubMed] [Google Scholar]
- Ogunwobi OO, Beales IL. Adiponectin stimulates proliferation and cytokine secretion in colonic epithelial cells. Regul Pept. 2006;134:105–113. doi: 10.1016/j.regpep.2006.02.001. [DOI] [PubMed] [Google Scholar]
- Lovato P, Brender C, Agnholt J, et al. Constitutive STAT3 activation in intestinal T cells from patients with Crohn's disease. J Biol Chem. 2003;278:16777–16781. doi: 10.1074/jbc.M207999200. [DOI] [PubMed] [Google Scholar]
- Liao W, Yu C, Wen J, et al. Adiponectin Induces Interleukin-6 Production and Activates STAT3 in Adult Mouse Cardiac Fibroblasts. Biol Cell. 2008;101:263–272. doi: 10.1042/BC20080117. [DOI] [PubMed] [Google Scholar]
- Akira S. IL-6-regulated transcription factors. Int J Biochem Cell Biol. 1997;29:1401–1418. doi: 10.1016/s1357-2725(97)00063-0. [DOI] [PubMed] [Google Scholar]
- Miyazaki T, Bub JD, Uzuki M, et al. Adiponectin activates c-Jun NH(2)-terminal kinase and inhibits signal transducer and activator of transcription 3. Biochem Biophys Res Commun. 2005;333:79–87. doi: 10.1016/j.bbrc.2005.05.076. [DOI] [PubMed] [Google Scholar]
- Riley JK, Takeda K, Akira S, et al. Interleukin-10 receptor signaling through the JAK-STAT pathway. Requirement for two distinct receptor-derived signals for anti-inflammatory action. J Biol Chem. 1999;274:16513–16521. doi: 10.1074/jbc.274.23.16513. [DOI] [PubMed] [Google Scholar]
- Atreya R, Mudter J, Finotto S, et al. Blockade of interleukin 6 trans signaling suppresses T-cell resistance against apoptosis in chronic intestinal inflammation: evidence in crohn disease and experimental colitis in vivo. Nat Med. 2000;6:583–588. doi: 10.1038/75068. [DOI] [PubMed] [Google Scholar]
- Catlett-Falcone R, Landowski TH, Oshiro MM, et al. Constitutive activation of Stat3 signaling confers resistance to apoptosis in human U266 myeloma cells. Immunity. 1999;10:105–115. doi: 10.1016/s1074-7613(00)80011-4. [DOI] [PubMed] [Google Scholar]
- Fayad R, Brand MI, Stone D, et al. Apoptosis resistance in ulcerative colitis: high expression of decoy receptors by lamina propria T cells. Eur J Immunol. 2006;36:2215–2222. doi: 10.1002/eji.200535477. [DOI] [PubMed] [Google Scholar]
- Haugen F, Drevon CA. Activation of nuclear factor-kappaB by high molecular weight and globular adiponectin. Endocrinology. 2007;148:5478–5486. doi: 10.1210/en.2007-0370. [DOI] [PubMed] [Google Scholar]
- Neumeier M, Weigert J, Schaffler A, et al. Different effects of adiponectin isoforms in human monocytic cells. J Leukoc Biol. 2006;79:803–808. doi: 10.1189/jlb.0905521. [DOI] [PubMed] [Google Scholar]
- Schaffler A, Furst A, Buchler C, et al. Secretion of RANTES (CCL5) and interleukin-10 from mesenteric adipose tissue and from creeping fat in Crohn's disease: regulation by steroid treatment. J Gastroenterol Hepatol. 2006;21:1412–1418. doi: 10.1111/j.1440-1746.2006.04300.x. [DOI] [PubMed] [Google Scholar]
- Hue S, Ahern P, Buonocore S, et al. Interleukin-23 drives innate and T cell-mediated intestinal inflammation. J Exp Med. 2006;203:2473–2483. doi: 10.1084/jem.20061099. [DOI] [PMC free article] [PubMed] [Google Scholar]
- Saad MF, Damani S, Gingerich RL, et al. Sexual dimorphism in plasma leptin concentration. J Clin Endocrinol Metab. 1997;82:579–584. doi: 10.1210/jcem.82.2.3739. [DOI] [PubMed] [Google Scholar]
- Rovin BH, Song H. Chemokine induction by the adipocyte-derived cytokine adiponectin. Clin Immunol. 2006;120:99–105. doi: 10.1016/j.clim.2006.01.010. [DOI] [PubMed] [Google Scholar]
- Hemmrich K, Thomas GP, Abberton KM, et al. Monocyte chemoattractant protein-1 and nitric oxide promote adipogenesis in a model that mimics obesity. Obesity (Silver Spring) 2007;15:2951–2957. doi: 10.1038/oby.2007.352. [DOI] [PubMed] [Google Scholar]
- Sobhani I, Buyse M, Goiot H, et al. Vagal stimulation rapidly increases leptin secretion in human stomach. Gastroenterology. 2002;122:259–263. doi: 10.1053/gast.2002.31385. [DOI] [PubMed] [Google Scholar]
- Doering J, Begue B, Lentze MJ, et al. Induction of T lymphocyte apoptosis by sulphasalazine in patients with Crohn's disease. Gut. 2004;53:1632–1638. doi: 10.1136/gut.2003.037911. [DOI] [PMC free article] [PubMed] [Google Scholar]
- Itoh J, de La Motte C, Strong SA, et al. Decreased Bax expression by mucosal T cells favours resistance to apoptosis in Crohn's disease. Gut. 2001;49:35–41. doi: 10.1136/gut.49.1.35. [DOI] [PMC free article] [PubMed] [Google Scholar]
- Fujita Y, Murakami M, Ogawa Y, et al. Leptin inhibits stress-induced apoptosis of T lymphocytes. Clin Exp Immunol. 2002;128:21–26. doi: 10.1046/j.1365-2249.2002.01797.x. [DOI] [PMC free article] [PubMed] [Google Scholar]
- Brakenhielm E, Veitonmaki N, Cao R, et al. Adiponectin-induced antiangiogenesis and antitumor activity involve caspase-mediated endothelial cell apoptosis. Proc Natl Acad Sci USA. 2004;101:2476–2481. doi: 10.1073/pnas.0308671100. [DOI] [PMC free article] [PubMed] [Google Scholar]
- Rakatzi I, Mueller H, Ritzeler O, et al. Adiponectin counteracts cytokine- and fatty acid-induced apoptosis in the pancreatic beta-cell line INS-1. Diabetologia. 2004;47:249–258. doi: 10.1007/s00125-003-1293-3. [DOI] [PubMed] [Google Scholar]
- Lu Y, Fukuyama S, Yoshida R, et al. Loss of SOCS3 gene expression converts STAT3 function from anti-apoptotic to pro-apoptotic. J Biol Chem. 2006;281:36683–36690. doi: 10.1074/jbc.M607374200. [DOI] [PubMed] [Google Scholar]
- Coll ML, Rosen K, Ladeda V, et al. Increased Bcl-xL expression mediates v-Src-induced resistance to anoikis in intestinal epithelial cells. Oncogene. 2002;21:2908–2913. doi: 10.1038/sj.onc.1205388. [DOI] [PubMed] [Google Scholar]
- Lappas M, Permezel M, Rice GE. Leptin and adiponectin stimulate the release of proinflammatory cytokines and prostaglandins from human placenta and maternal adipose tissue via nuclear factor-kappaB, peroxisomal proliferator-activated receptor-gamma and extracellularly regulated kinase 1/2. Endocrinology. 2005;146:3334–3342. doi: 10.1210/en.2005-0406. [DOI] [PubMed] [Google Scholar]
- Alberti L, Gilardini L, Girola A, et al. Adiponectin receptors gene expression in lymphocytes of obese and anorexic patients. Diabetes Obes Metab. 2007;9:344–349. doi: 10.1111/j.1463-1326.2006.00614.x. [DOI] [PubMed] [Google Scholar]
- Shirogane T, Fukada T, Muller JM, et al. Synergistic roles for Pim-1 and c-Myc in STAT3-mediated cell cycle progression and antiapoptosis. Immunity. 1999;11:709–719. doi: 10.1016/s1074-7613(00)80145-4. [DOI] [PubMed] [Google Scholar]
- Ina K, Itoh J, Fukushima K, et al. Resistance of Crohn's disease T cells to multiple apoptotic signals is associated with a Bcl-2/Bax mucosal imbalance. J Immunol. 1999;163:1081–1090. [PubMed] [Google Scholar]
- Croker BA, Krebs DL, Zhang JG, et al. SOCS3 negatively regulates IL-6 signaling in vivo. Nat Immunol. 2003;4:540–545. doi: 10.1038/ni931. [DOI] [PubMed] [Google Scholar]
- Pajvani UB, Hawkins M, Combs TP, et al. Complex distribution, not absolute amount of adiponectin, correlates with thiazolidinedione-mediated improvement in insulin sensitivity. J Biol Chem. 2004;279:12152–12162. doi: 10.1074/jbc.M311113200. [DOI] [PubMed] [Google Scholar]
- Tomizawa A, Hattori Y, Kasai K, et al. Adiponectin induces NF-kappaB activation that leads to suppression of cytokine-induced NF-kappaB activation in vascular endothelial cells: globular adiponectin vs. high molecular weight adiponectin. Diab Vasc Dis Res. 2008;5:123–127. doi: 10.3132/dvdr.2008.020. [DOI] [PubMed] [Google Scholar]
- Hattori Y, Hattori S, Kasai K. Globular adiponectin activates nuclear factor-kappaB in vascular endothelial cells, which in turn induces expression of proinflammatory and adhesion molecule genes. Diabetes Care. 2006;29:139–141. doi: 10.2337/diacare.29.1.139. [DOI] [PubMed] [Google Scholar]
Associated Data
This section collects any data citations, data availability statements, or supplementary materials included in this article.


