Abstract
Non-small cell lung cancers (NSCLC) that express the cell surface adhesion protein E-cadherin may carry a better prognosis than E-cadherin-negative tumors. Here, we found substantial inhibition of anchorage-independent growth in soft agar and cell migration in each of four NSCLC lines stably transfected with E-cadherin. The inhibitory effects were independent of the EGFR and β-catenin/Wnt-signaling pathways. However, E-cadherin expression was associated with an adhesion-dependent reduction in the activity of Rho family proteins, RhoA in two lines and Cdc42 in the other two. The reduction of RhoA activity was dependent on DLC-1 Rho-GAP and p190 Rho-GAP and associated with an increase in a membrane-associated p190 Rho-GAP/p120 Ras-GAP complex. In parental cells with high levels of RhoA-GTP, siRNA-mediated knock-down of RhoA reduced cell migration and agar growth in a manner analogous to E-cadherin. In parental cells with high levels of Cdc42-GTP, transfection of a Cdc42 dominant-negative mutant reduced cell growth and migration similarly to cells expressing E-cadherin. Thus, E-cadherin can negatively regulate cell proliferation and migration in NSCLC by reducing the level of the predominant active form of Rho family protein, RhoA or Cdc42. These proteins can be considered downstream effectors of E-cadherin and might represent therapeutic targets in some NSCLC.
Keywords: E-cadherin, NSCLC, tumorigenesis, cell migration, Rho-family GTPases
Introduction
Lung cancer is the leading cause of cancer-related mortality worldwide and is responsible for more than 150 000 deaths annually in the United States, with a 5-year survival rate of only 15% (Jemal et al., 2008). This cancer consists of two broad groups: non-small cell lung cancers (NSCLC), which account for about 80%, and small-cell lung cancers, representing the remaining 20% (Kris, 2005). Here, we have focused on cell lines derived from NSCLC.
Despite important advances in understanding the molecular pathogenesis of NSCLC, its elucidation remains incomplete. One key finding has been that the epidermal growth factor receptor (EGFR) is somatically mutated in a minority of NSCLC, and treatment with EGFR inhibitors has produced some long-term responses in this group of patients (Sordella et al., 2004). The K-ras gene is mutationally activated in about one-quarter of NSCLC patients (Chong et al., 2007; Riely et al., 2008). These patients appear to be refractory to most chemotherapies, including EGFR inhibitors (Pao et al., 2005).
The adhesion protein E-cadherin is another potentially important molecule for NSCLC (Bremnes et al., 2002b). It is a transmembrane protein, encoded by the CDH1 gene, which is a key component of epithelial cell adherens junctions, and its cell surface expression is reduced in many NSCLC patients (Fei et al., 2002). CDH1 remains intact in the majority of human cancers, but is frequently silenced via promoter hypermethylation and/or overexpression of its transcriptional repressors, such as Snail, Slug and ZEB1 (Yoshiura et al., 1995; Peinado et al., 2004). Slug expression has been inversely correlated with E-cadherin expression in lung adenocarcinoma, which is the most common form of NSCLC, and in several other cancers (Hajra et al., 2002; Shih et al., 2005; Uchkado et al., 2005). Consistent with E-cadherin playing a fundamental role in maintaining intercellular contacts and reducing tumor metastases (Gumbiner, 1996; Witta et al., 2006), its expression in NSCLC has been correlated with a better prognosis and longer overall survival time (Bremnes et al., 2002a; Deeb et al., 2004), although the mechanisms underlying these effects are not clearly understood.
E-cadherin has been reported to attenuate the transformed phenotype in several tumor types, but it has not, to the best of our knowledge, been experimentally evaluated in NSCLC. In other tumors, two principal mechanisms of growth inhibition by E-cadherin have been described. One, which is characteristic of colorectal cancer, is negative regulation of the Wnt pathway by E-cadherin because the cytoplasmic portion of E-cadherin binds and sequesters β-catenin, a component of Wnt signaling when it is present in the nucleus (Gottardi and Gumbiner, 2004; Vincan and Barker, 2008). The other, which has been identified in cell lines from several tumor types, is the ligand-dependent negative regulation of EGFR, and other receptor tyrosine kinases, by E-cadherin, which interferes with ligand-dependent activation of the receptors (Qian et al., 2004; Heijink et al., 2007; Bremm et al., 2008).
In this study, we initially determined that E-cadherin could attenuate abnormal growth properties of human NSCLC cell lines, and then sought to investigate signaling proteins that might be affected by E-cadherin. Although this regulation was not attributable to previously identified mechanisms, we identified Rho family GTPases as key mediators of the abnormal growth properties that are negatively regulated by E-cadherin in NSCLC.
Results
Overexpression of E-cadherin in NSCLC cell lines inhibits anchorage-independent growth and cell migration
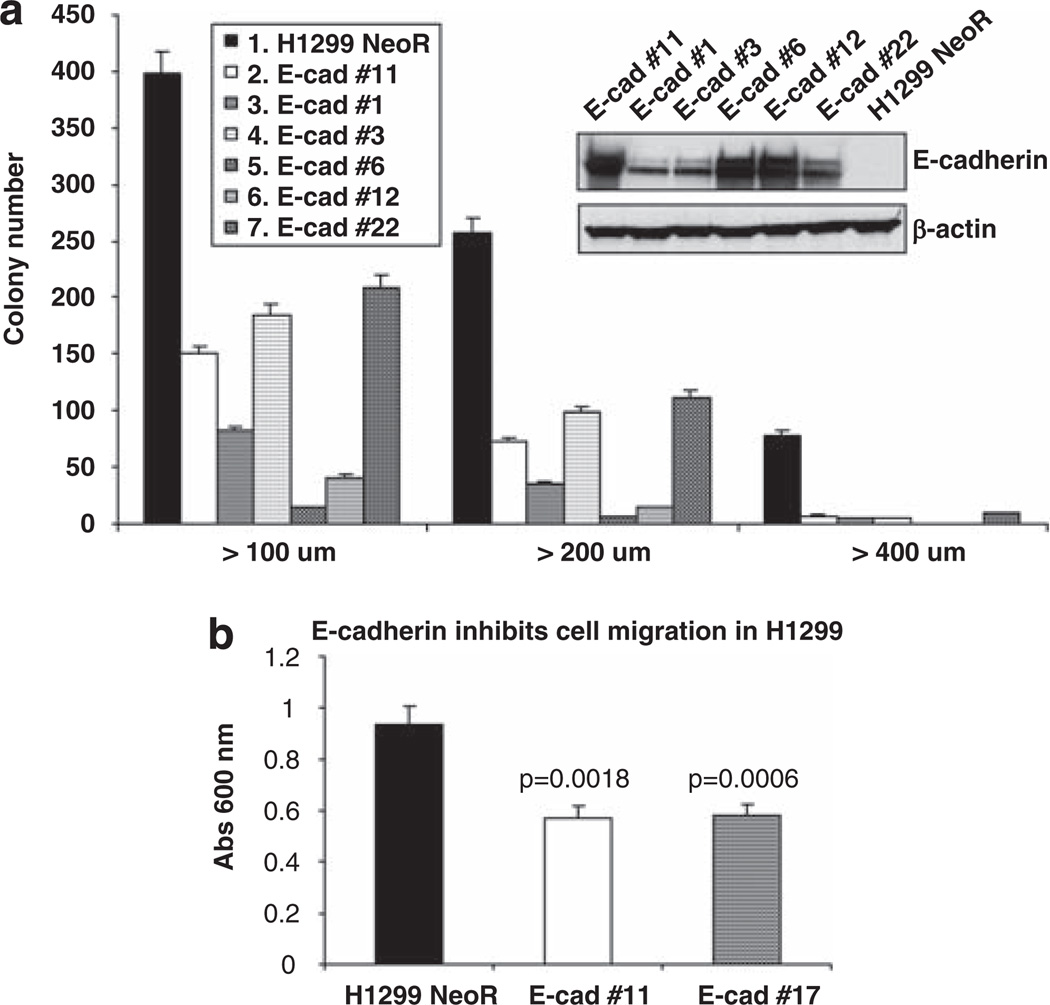
In assessing the ability of E-cadherin to suppress the transformed phenotype in NSCLC, we focused on four NSCLC cell lines: H1299, H1703, H157, which are negative for E-cadherin, and H23, which is weakly positive. The lines were transfected with myc-tagged E-cadherin, and stable clones expressing E-cadherin were assessed for their ability to inhibit anchorage-independent growth and cell migration. In all four lines, stable clones expressing E-cadherin, which was membrane-associated (Supplementary Figure S1), displayed reduced growth in soft agar and cell migration, by transwell and wound healing assays (Figure 1 for H1299; Supplementary Figure S2 for H23, H1703 and H157 (data not shown for wound healing assays)). Although H23 contains an activating K-ras mutation, E-cadherin was as inhibitory in H23 as in the other lines.
Figure 1.
E-cadherin expression in H1299 cells inhibits anchorage-independent growth and cell migration. (a) Anchorage-independent growth assay. H1299 clones, stably expressing E-cadherin, or NeoR control cells were grown in soft agar and analyzed after 3 weeks. The data are the mean number of colonies (± s.d.) > 100 µm, 200 µm, 400 µm in diameter from three independent experiments. The figure inset shows the expression levels of E-cadherin in the stable clones or NeoR control cells, carried out by western blot using anti-E-cadherin antibody; β-actin was used as a protein loading control. (b) Transwell migration assay performed in H1299 clones stably expressing E-cadherin and NeoR control. After overnight incubation, cells that had migrated to the lower surface of the filter were stained, photographed, solubilized and quantified colorimetrically. The data are the mean (± s.d.) of three independent experiments. P-values were calculated between E-cadherin-expressing clones vs NeoR control, using Student’s t-test.
EGFR signaling is not attenuated by E-cadherin in NSCLC cell lines
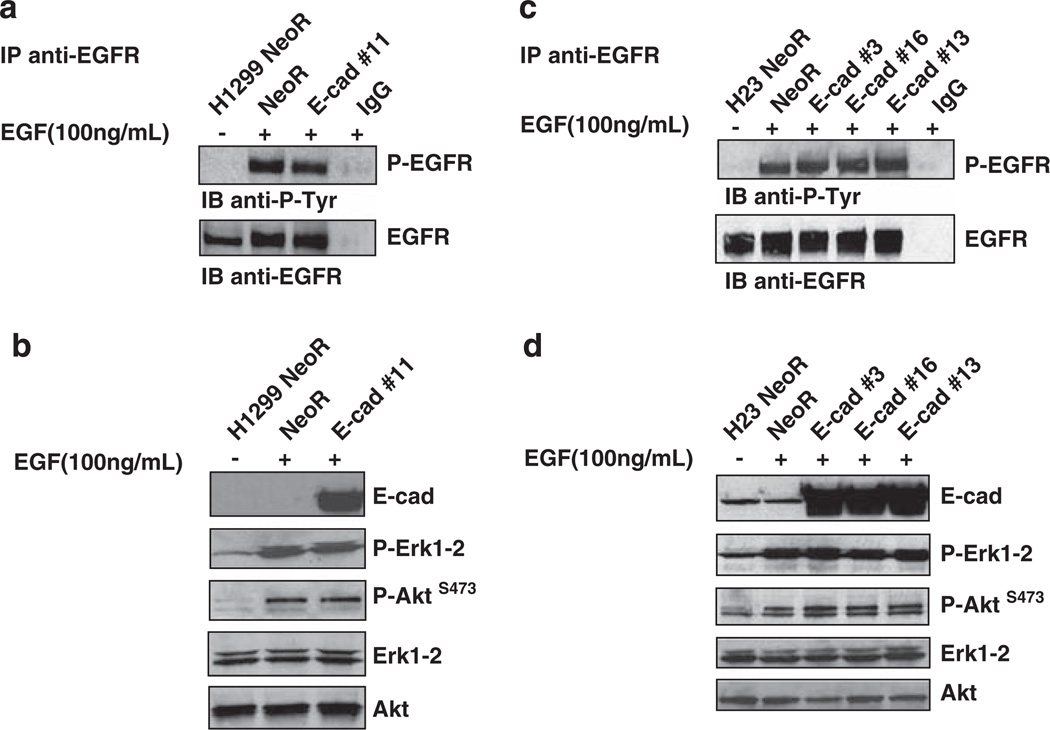
To explore the mechanism responsible for the E-cadherin-dependent growth inhibition in the NSCLC lines, we first considered the possibility that E-cadherin might attenuate EGFR signaling (Qian et al., 2004). Cells stably transfected with E-cadherin or empty vector (NeoR) were treated with EGF at 100 ng/ml for 10 min. However, E-cadherin did not reduce the phosphorylation level of EGFR or the phosphorylation of downstream effectors, such as Erk1-2 and Akt (Figures 2a and b for H1299; Figures 2c and d for H23; Supplementary Figures S3a and b for H1703 and Supplementary Figures S3c and d for H157). These results confirm and extend the findings of Witta et al., (2006), who showed that ligand-dependent phosphorylation of EGFR in H157 cells was not inhibited by E-cadherin. Consistent with H23-expressing mutant K-ras, Erk was constitutively phosphorylated in this line, as phospho-Erk1-2 was not reduced by serum starvation for 16 h, in contrast to the other lines (Figure 2d). We conclude that the inhibition of cell growth induced by E-cadherin can occur without a reduction in Akt or Erk phosphorylation and is not attributable to attenuation of the EGFR-signaling pathway.
Figure 2.
EGFR signaling is not downregulated by E-cadherin in H1299 ad in H23 cells. (a, c) H1299 or H23 clones stably transfected with E-cadherin or empty vector (NeoR) were treated with EGF at 100 ng/ml for 10 min. Tyrosine phosphorylation of immunoprecipitated EGFR was analyzed by western blot using a phosphotyrosine-specific antibody. (b, d) Phosphorylation of Erk1-2 and Akt was analyzed by western blot using anti-phospho-Erk1-2Thr202/Tyr204 and anti-phospho-AktSer473 antibodies, respectively. The levels of total Erk and Akt were used as loading controls.
β-catenin/Wnt signaling is not activated in NSCLC lines
β-catenin non-covalently links E-cadherin to α-catenin, and in addition regulates gene transcription as a component of Wnt signaling (Huber et al., 1996; Molenaar et al., 1996). The Wnt-signaling function of β-catenin is mediated by ‘free’ cytoplasmic β-catenin, which increases the transcription of Wnt/β-catenin target genes (Brembeck et al., 2006) by forming a complex with LEF/TCF (lymphoid enhancer factor/T cell factor; TCF) DNA-binding proteins (Beherens et al., 1996).
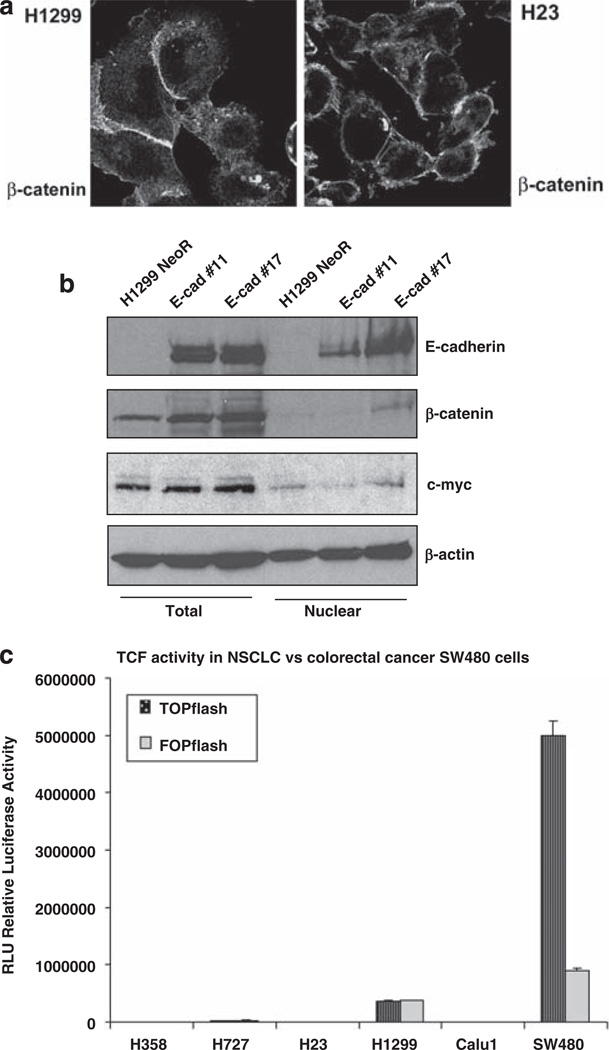
As E-cadherin inhibits growth in colorectal cancer lines mainly by sequestering β-catenin in the cytoplasm and decreasing its nuclear activity (Gottardi et al., 2001), we examined whether the inhibitory effects of E-cadherin in the NSCLC lines might depend on this mechanism. However, in contrast to colorectal cancer lines, β-catenin was not detected in the nucleus in NSCLC cell lines H1299 and H23. Instead, it was mostly present at the cell membrane (Figure 3a). Furthermore, the nuclear fraction of H1299 cellular lysate did not contain detectable levels of β-catenin, and c-myc, an important transcriptional target of Wnt/β-catenin signaling, was not decreased by E-cadherin (Figure 3b).
Figure 3.
Inhibition of cell growth and migration by E-cadherin is not dependent on β-catenin/Wnt-signaling pathway. (a) Subcellular localization of β-catenin was analyzed in H1299 and H23 cells. Immunofluorescent staining was performed using antibodies specific for β-catenin. (b) Nuclear fractionation assay was performed in H1299 cells stably transfected with E-cadherin or empty vector (NeoR). The level of E-cadherin, β-catenin, c-myc and β-actin was measured in the nuclear fraction and in the total extract by western blot. (c) Analysis of β-catenin/TCF-mediated transcriptional activity was performed in the indicated cell lines. The colorectal cell line SW480 was used as positive control. TOPflash or FOPflash luciferase reporter plasmids were co-transfected with Renilla luciferase plasmid to control for the efficiency of transfection. Relative Luciferase Units (RLU) were measured for TOPflash and FOPflash activity. The data are the mean value (± s.d.) of three independent experiments for each cell line.
To extend these negative results to a functional assay of β-catenin/TCF DNA-binding proteins, we analyzed the activity of TCF transcription factors, using TOP-flash/ FOPflash reporter plasmids in NSCLC with different levels of E-cadherin. They included H358 and H727 (which both have high E-cadherin), H23 (low E-cadherin), and H1299 and Calu1 (both negative for E-cadherin). SW480, a colorectal cancer cell line with constitutive Wnt activation, was used as a positive control. Consistent with the lack of nuclear β-catenin, β-catenin/TCF transcriptional activity was minimal in the NSCLC cell lines (Figure 3c), and it was hardly altered by E-cadherin (Supplementary Figure S4). Therefore, the inhibitory effects of E-cadherin are not attributable to inhibition of Wnt/β-catenin/TCF signaling.
E-cadherin inhibits the activity of Rho family proteins
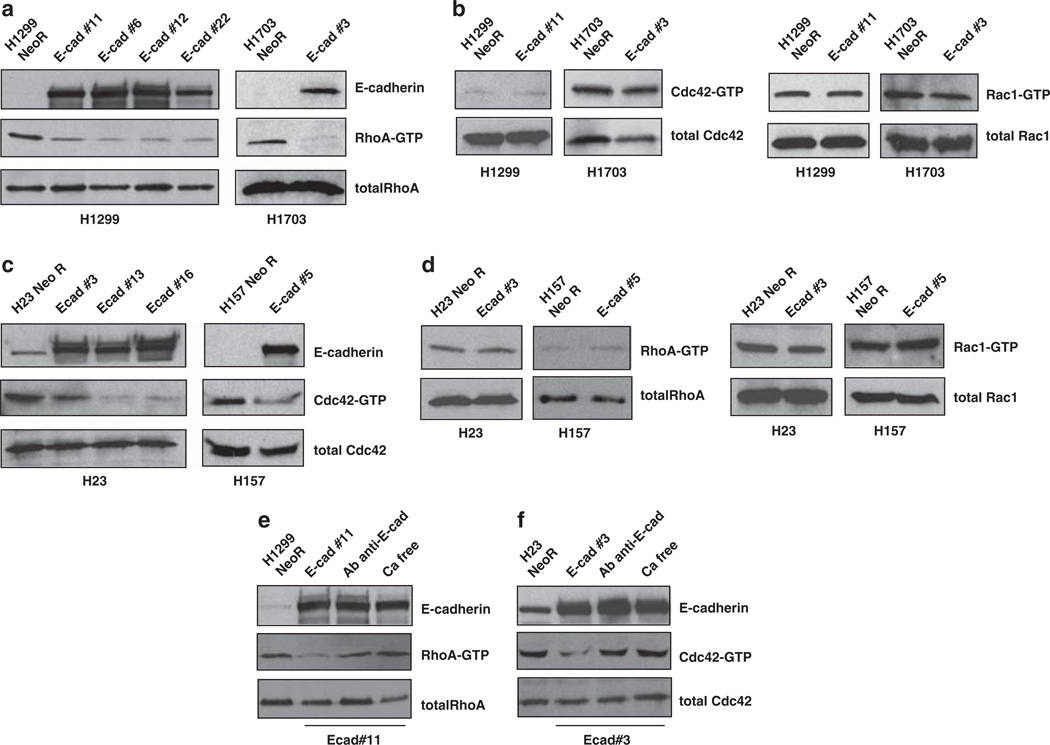
Having excluded the above mechanisms, we assessed the pathways controlled by Rho family of GTPases, which regulate the cytoskeleton and cell adhesion (Bourne et al., 1991; Takai et al., 1995). As with other GTPases, the members of this family, which includes Rho, Cdc42 and Rac, cycle between an active, GTP-bound state and an inactive, GDP-bound state. Rho proteins are important regulators of cadherin-mediated adhesion and are involved in cell migration, cell polarity and wound healing (Takeichi, 1995; Gumbiner, 1996; Fukata et al., 1999). There is also evidence in normal epithelial cells that E-cadherin can negatively regulate RhoA and positively regulate Cdc42 and Rac (Noren et al., 2001). Two of the lines, H1299 and H1703, were found to have relatively high levels of RhoA–GTP, which were reduced in E-cadherin-expressing clones (Figure 4a). In contrast, the low basal levels of Cdc42–GTP and Rac1–GTP were not modified by E-cadherin (Figure 4b). On the other hand, H23 and H157 had relatively high levels of Cdc42–GTP, which were reduced by E-cadherin (Figure 4c), in contrast to RhoA–GTP and Rac1–GTP, which were low in these lines (Figure 4d). To determine if the reduction of RhoA–GTP and Cdc42–GTP required the adhesive activity of E-cadherin, H1299 and H23-expressing E-cadherin were treated with a monoclonal antibody that blocks the adhesive activity of E-cadherin. This treatment or incubation in calcium-free medium (which also inhibits adhesion by E-cadherin) led to an increase in RhoA–GTP for H1299 (Figure 4e) and an increase of Cdc42–GTP for H23 (Figure 4f). Thus, E-cadherin modulated the activity of the most active Rho family member in each line, either RhoA or Cdc42, in an adhesion-dependent manner.
Figure 4.
E-cadherin reduces the activity of Rho family proteins in an adhesion-dependent manner: RhoA in H1299/H1703 and Cdc42 in H23/H157. (a) RhoA-GTP pull-down assay was performed in H1299 and H1703 cells stably transfected with E-cadherin or empty vector (NeoR), using Rhotekin protein agarose beads. Western blot was carried out using anti-RhoA and anti-E-cadherin antibodies. (b) Cdc42–GTP and Rac1–GTP pull-down assays were performed in H1299 and H1703 cells using PAK–PBD protein agarose beads. Western blot was carried out with anti-Cdc42 and anti-Rac1 antibodies. (c) Cdc42–GTP pull-down assay was performed in H23 and H157 cells stably transfected with E-cadherin or empty vector (NeoR). Western blot was carried out using anti-Cdc42 and anti-E-cadherin antibodies. (d) RhoA–GTP and Rac1–GTP pull-down assays were performed in H23 and H157 cells. Total levels of RhoA and Rac1 were detected by western blot with anti-RhoA and anti-Rac1 antibodies. (e, f) RhoA–GTP and Cdc42–GTP assays were measured as above in H1299 (e) and in H23 (f) cells stably transfected with E-cadherin or empty vector (NeoR). The E-cadherin clones were treated overnight with calcium-free medium or an anti-E-cadherin antibody (2 µg/ml) which impairs adhesion by interacting with the extracellular domain of E-cadherin. Western blot was carried out as above.
RhoA–GTP regulates cell growth and migration in H1299 cells
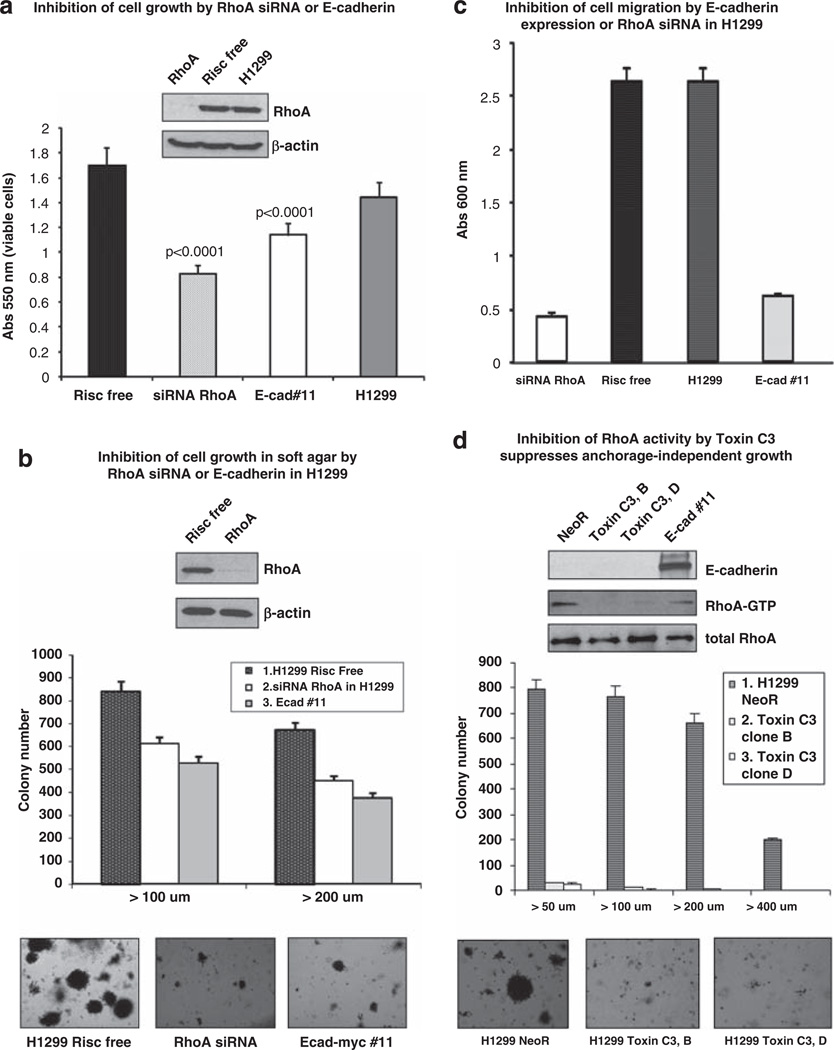
To determine if the alteration in Rho activity induced by E-cadherin might account for at least some of the biological effects of E-cadherin, we focused on H1299. We used several bioassays to compare the inhibition induced by E-cadherin expression with that resulting from reducing RhoA activity in the parental cells. In the first set of experiments, the level of RhoA was reduced by siRNAs against RhoA. In an MTT assay, the siRNA-mediated reduction in growth of parental H1299 cells after 48 h (Figure 5a) and 72 h (data not shown) was about the same as that seen with stable E-cadherin transfectants. Similar results were seen with the soft agar assay (Figure 5b), despite partial re-expression of RhoA by the end of the 2-week experiment (data not shown). In addition to reducing anchorage-independent growth to the same extent as E-cadherin, the colonies that developed with RhoA siRNA were morphologically similar to those induced by E-cadherin, in that both were scattered and less compact than those obtained from Risc-free transfected cells. Comparable strong inhibition was also seen with cell migration in a transwell assay (Figure 5c). Thus, in three different bioassays, reduction in RhoA expression inhibited the biological activity of H1299 cells similarly to that induced by E-cadherin.
Figure 5.
RhoA contributes to cell growth and migration in H1299 cells. (a) The H1299 line was transfected with siRNA specific for RhoA. RISC-free RNA was used as negative control. The figure inset shows the expression level of RhoA using western blot with anti-RhoA antibody; β-actin was used as loading control. MTT assay was performed after 48 h of incubation. The data represent the mean value (± s.d.) of the absorbance at λ = 550 nm, which is proportional to the viable cells. Experiments were done in triplicate. P-values were calculated vs RISC-free control, using Student’s t-test. (b) Anchorage-independent growth assay was performed in H1299 cells transfected with RhoA siRNA or RISC-free or stably-expressing E-cadherin (clone 11). Cells were grown in soft agar and photographed after 2 weeks. The data are the mean number of colonies (± s.d.) > 100 µm, >200 µm of diameter from three independent experiments. (c) Transwell migration assay was performed in H1299 cells transfected with RhoA siRNA or RISC-free or stably expressing E-cadherin, as described for Figure 1. The data are the mean (± s.d.) of three independent experiments. (d) Anchorage-independent growth assay was performed in H1299 cells transfected with C3 exoenzyme (clone b and d) or stably expressing E-cadherin (clone 11). Cells were grown in soft agar and photographed after 2 weeks. The quantitative data are the mean number of colonies (± s.d.) > 50 µm, > 100 µm, > 200 µm, >400 µm in diameter from three independent experiments. RhoA–GTP pull-down assay was performed using Rhotekin protein agarose beads. The inhibition of RhoA activity by C3 exoenzyme in H1299 cells was compared with H1299 stably expressing E-cadherin. Western blot was carried out using anti-RhoA and anti-E-cadherin antibodies.
We also reduced the activity of RhoA in H1299 cells via expression of a C3 exoenzyme, a bacterial ADP-ribosyltransferases that selectively inactivates Rho GTPases without altering their level of expression (Aktories et al., 2004). In H1299 clones stably expressing C3 exoenzyme, RhoA–GTP was suppressed as expected, and the clones displayed a remarkable reduction in anchorage-independent growth compared to a clone with the empty vector control (Figure 5d). These data further support the conclusion that RhoA–GTP makes an important contribution to the regulation of cell proliferation in the H1299 cell line.
P190 Rho–GAP and DLC-1 regulate RhoA–GTP in E-cadherin-expressing cells
Given the role of RhoA–GTP and its regulation by E-cadherin, we initiated a preliminary analysis of what might account for the E-cadherin-dependent regulation. RhoA can be activated by guanine nucleotide exchange factors that are specific for Rho (Rho–GEFs), of which there are many, and inactivated by GTPase-activating proteins that are specific for Rho (Rho–GAPs), of which there are several (Ridley, 2004; Tcherkezian and Lamarche-Vane, 2007). RhoA–GTP is also regulated by Rho GDI (GDP Dissociation Inhibitor), which inhibits dissociation of GDP from Rho proteins, preventing their activation (Tang et al., 2008).
To identify RhoA GEFs whose level of expression in H1299 cells might be modulated by E-cadherin, we carried out a microarray analysis in cells transiently transfected with E-cadherin or empty vector. The following Rho–GEFs were found to be expressed: GEF2, GEF7, GEF10, GEF12/LARG and GEF18, but their level was not altered by E-cadherin. Although most of these Rho–GEFs were expressed at low levels, LARG (leukemia-associated Rho–GEF) was expressed at higher levels. To test whether it might be an important contributor to the RhoA–GTP level in the parental H1299 cells, LARG was knocked-down by siRNA. However, LARG was not a major regulator of RhoA–GTP in H1299 under our growth conditions, as there was no change in the level of RhoA–GTP, although the knock-down was substantial (data not shown). Thus, we did not identify a specific RhoA GEF whose activity was critical to the RhoA–GTP in the cells.
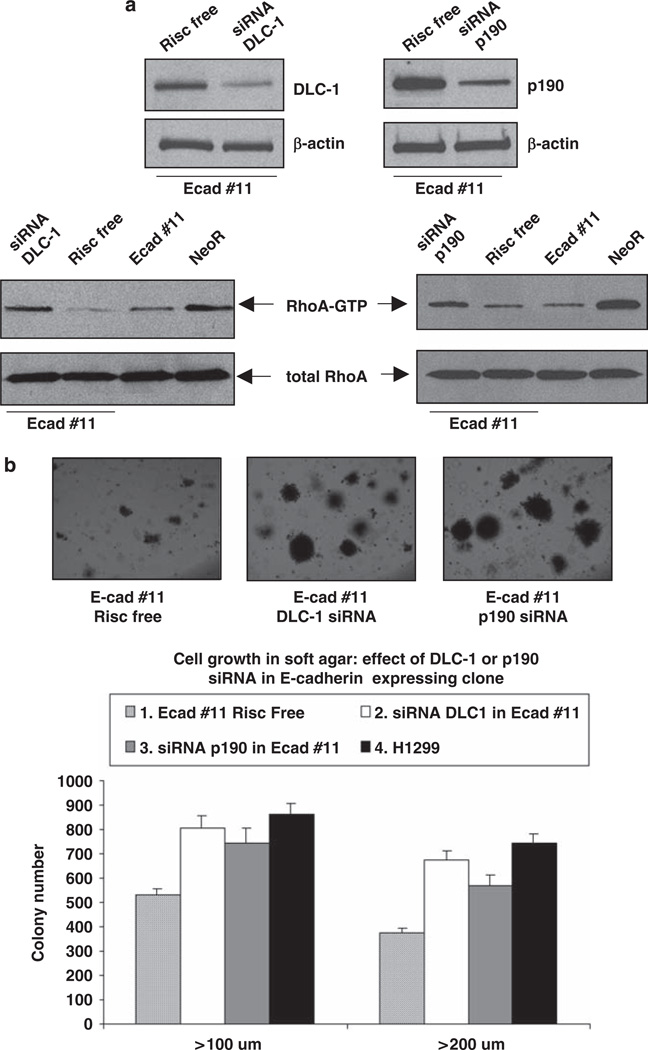
We also assessed the potential importance of two widely expressed Rho–GAPs, DLC-1 and p190 Rho–GAP (p190), which reduce Rho–GTP (Ridley, 2004; Durkin et al., 2007; Qian et al., 2007), by determining whether their downregulation in H1299 cells stably expressing E-cadherin would lead to an increase in RhoA–GTP. Exposure of the E-cadherin-transfected cells to siRNAs specific for DLC-1 or p190 was associated with a substantial increase in RhoA–GTP and a concomitant increase in anchorage-independent growth in soft agar assay (Figures 6a and b). Therefore, the low RhoA–GTP levels induced by E-cadherin depend both on p190 and DLC-1.
Figure 6.
Reduction in Rho–GAP activity attributable to DLC-1 or p190 increases cell growth in H1299 cells stably expressing E-cadherin. (a) H1299 cells stably expressing E-cadherin (clone #11) were transfected with DLC-1 or p190 Rho–GAP siRNA. RISC-free RNA was used as negative control. The level of DLC-1 and p190 was measured by western blot; β-actin was used as loading control. RhoA–GTP pull-down assay was performed using Rhotekin protein agarose beads. Western blot was carried out using anti-RhoA antibody. (b) Anchorage-independent growth assay was performed in H1299 cells stably expressing E-cadherin (clone #11) or transfected with DLC-1 or p190 Rho–GAP siRNA. RISC-free RNA was used as negative control. Cells were grown in soft agar and photographed after 2 weeks. The data are the mean number of colonies (± s.d.) > 100 µm, > 200 µm of diameter from three independent experiments.
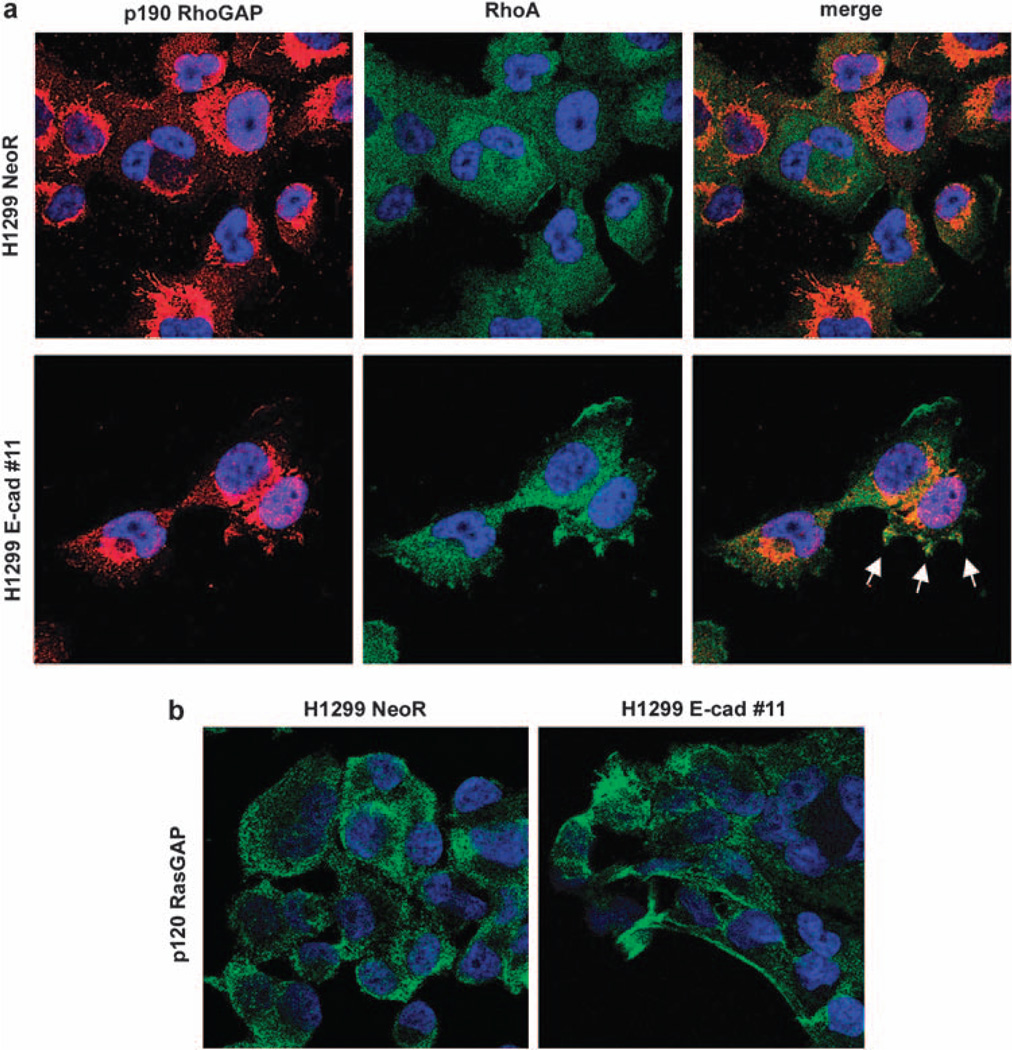
p190 can be predominantly cytoplasmic or associated with the cell membrane, where its inactivation of RhoA is more efficient. The membrane association of p190 is usually mediated by its non-covalent binding to p120 Ras–GAP (p120), which depends on tyrosine-phosphorylation of p190 (Hu and Settleman, 1997; Roof et al., 1998). When extracts from H1299 cells were studied by immunoprecipitation and western blot, a p120/p190 complex was identified in the presence or absence of E-cadherin, but the degree of p190 tyrosine-phosphorylation was not influenced by E-cadherin (Supplementary Figures S5a and b). However, H1299 cells expressing E-cadherin had greater colocalization between RhoA and p190 at the plasma membrane, compared with H1299 cells transfected with the empty vector (Figure 7a). Furthermore, there was a similar E-cadherin-dependent difference in the plasma membrane association with p120 (Figure 7b). These results are consistent with the conclusion that E-cadherin has induced membrane localization of p120/p190 complex.
Figure 7.
E-cadherin expression increases cell membrane localization of p190, p120 and RhoA. (a) Colocalization between RhoA and p190 at the plasma membrane was analyzed by immunofluorescence microscopy in E-cadherin expressing clone and compared with NeoR cells, using antibodies specific for p190 or RhoA. Nuclei were stained with DAPI solution. (b) Subcellular localization of p120 was analyzed by immunofluorescence microscopy in H1299 clone stably expressing E-cadherin. NeoR cells were used as control.
Cdc42 is an important regulator of cell growth and migration in H23 cells
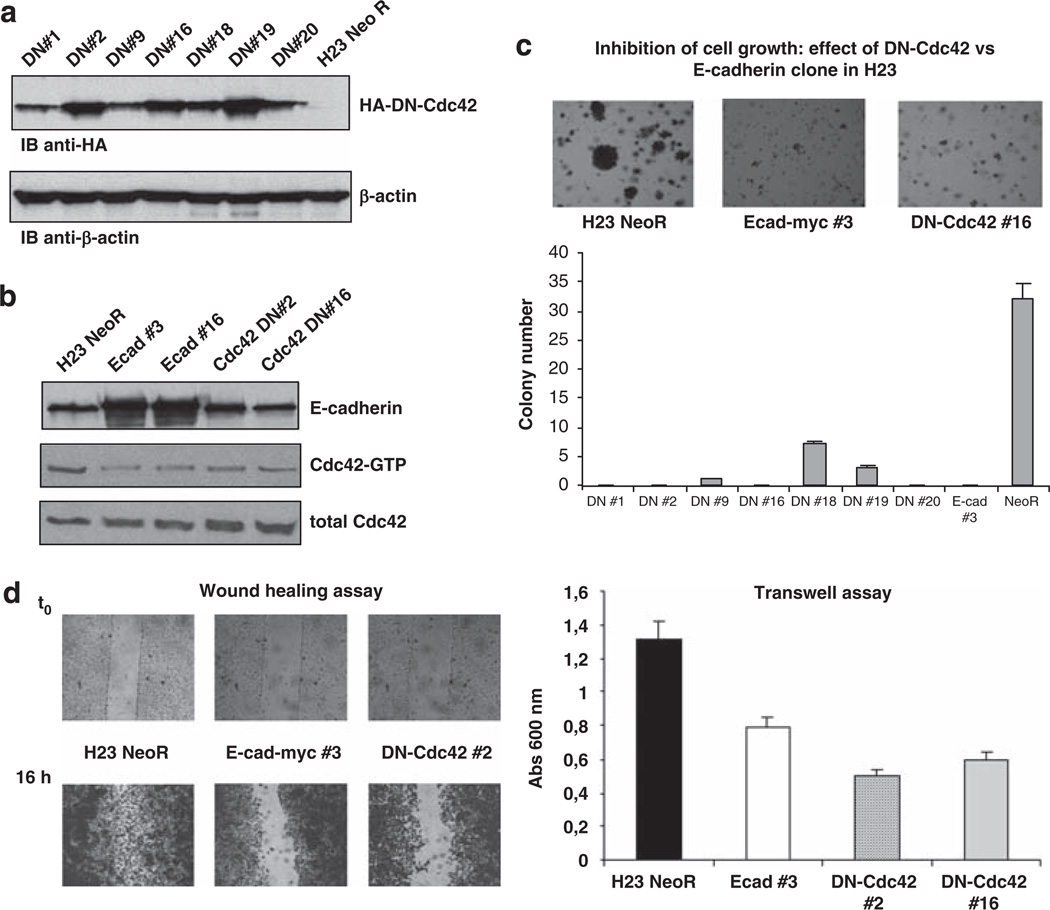
As noted earlier, Cdc42–GTP levels were reduced by E-cadherin expression in the H23 line. To analyze the biological importance of Cdc42 in H23, we used a dominant inhibitory Cdc42 mutant (Cdc42T17N), which preferentially binds GDP and inhibits the activation of endogenous Cdc42 by titrating out its GEFs (Fukata et al., 1999). Parental H23 cells were transfected with HA-tagged dominant-negative Cdc42 (HA-DN-Cdc42) or empty vector (NeoR), stable clones were selected after G418 treatment, and expression of the exogenous protein was confirmed by western blot (Figure 8a). Using a pull-down assay, we observed downmodulation of Cdc42–GTP in the stable clones expressing HA-DN–Cdc42 that was similar to Cdc42–GTP in H23 clones expressing E-cadherin (Figure 8b). As with H23 cells expressing E-cadherin, there was a remarkable reduction in anchorage-independent growth for the stable clones expressing HA-DN–Cdc42, compared with NeoR cells, and a good correlation between the level of expression of HA-DN–Cdc42 and the degree of inhibition (Figure 8c). The stable clones expressing HA-DN–Cdc42 also had an analogous reduction in cell migration, as determined by wound-healing and transwell assays (Figure 8d).
Figure 8.
Dominant-negative Cdc42 (DN-Cdc42) suppresses anchorage-independent growth and cell migration in H23 cells. (a) Analysis of the expression of HA-DN–Cdc42 in H23 stable clones or NeoR control cells was carried out by western blot using anti-HA and anti-β-actin antibodies; β-actin was used as loading control. (b, c, d) In H23 cells stably expressing HA-DN–Cdc42, E-cadherin or NeoR, Cdc42–GTP (b) was measured by pull-down assay performed. Western blot was carried out with anti-E-cadherin and anti-Cdc42 antibodies. Cells were grown in soft agar and photographed after 2 weeks (c). The quantitative data are the mean number of colonies (± s.d.) > 100 µm of diameter from three independent experiments. Cell migration was analyzed by wound healing and transwell assays (d). For wound healing assay, cells were seeded in 12-well plates and incubated overnight at 37 °C to generate confluent cultures. The migration of the cells at the edge of the scratch was monitored at time 0 (t0) and 16 h later, when cells were stained and photographed. Transwell assay was performed as in Figure 1. These data are the mean (± s.d.) of three independent experiments.
Discussion
E-cadherin is a tumor suppressor that can inhibit cell migration, invasion and anchorage-independent growth, and its expression level is reduced in all histological types of lung cancer (Bohm et al., 1994; Toyoyama et al., 1999; Pirinen et al., 2001). In particular, expression of the E-cadherin/α-catenin complex is reduced in poorly differentiated carcinomas, whereas no alterations are observed in highly differentiated carcinomas. Here, we have found that the re-expression of E-cadherin in each of four NSCLC lines in which endogenous E-cadherin had been downregulated induced a profound inhibition of anchorage-independent growth and cell migration. Our findings further show that E-cadherin-dependent inhibition of cell growth and migration resulted from reduced activity of specific members of the Rho family proteins, particularly RhoA and Cdc42. The regulation of RhoA was shown to depend on two Rho–GAPs, DLC-1 and p190.
We analyzed the possible effects of E-cadherin on other signaling pathways, especially EGFR and the Wnt/β-catenin pathways, as E-cadherin has been shown in other systems to negatively regulate these pathways, and EGFR may have a crucial role in some cases of lung cancer. However, the EGFR pathway was not inhibited by E-cadherin in the NSCLC lines. We also addressed the possibility that E-cadherin might inhibit the phosphorylation of EGFR on Tyr 845, which is known to mediate the activation of STAT5b, leading to induction of Erk-independent DNA synthesis (Olayioye et al., 1999; Boerner et al., 2005; Perrais et al., 2007). However, we did not find a reduction in the level of phospho-Tyr 845 of EGFR or phospho-Tyr 694 of STAT5 (data not shown).
Furthermore, EGFR was not constitutively active in the absence of exogenous ligand, which implies that these cells do not secrete an EGFR ligand. The absence of an EGFR autocrine loop and a concomitant low basal EGFR activity might contribute to the reported resistance of these lines to the treatment with EGFR inhibitors (Witta et al., 2006). In fact, several studies have noted the importance of activating mutations in the intracellular domain of EGFR in determining the sensitivity to EGFR inhibitors (Sordella et al., 2004; Capuzzo et al., 2005).
The role of β-catenin as activator of Wnt signaling has been described in colorectal cancer and hepatocellular carcinoma (Lee et al., 2006; Fodde and Brabletz, 2007; Hlubek et al., 2007). In addition, experimental over-expression of Wnt1 can promote tumor progression in NSCLC cells (Huang et al., 2008). However, our results indicate that the canonical Wnt/β-catenin-signaling pathway is not activated in the NSCLC lines we examined, despite their low levels of E-cadherin. An apparently similar situation has been described in breast cancer, where downregulation of E-cadherin does not usually lead to upregulation of the WNT/β-catenin pathway (van de Wetering et al., 2001; Jeanes et al., 2008).
Cdc42 and Rac1 have been reported to regulate E-cadherin-dependent cellular adhesion through IQGAP1, which interacts with β-catenin, dissociating α-catenin from the cadherin–catenin complex (Fukata et al., 2003), whereas RhoA can regulate E-cadherin-dependent adherens junctions indirectly by acting on the cytoskeleton (Fukata et al., 1999). Our data suggest that this regulation can be bidirectional and that E-cadherin inhibits the activity of small GTPases at least in part through Rho–GAP proteins, as the inhibitory effects of E-cadherin could be attenuated by knocking down DLC-1 or p190. In a previous report, E-cadherin was shown in MDCK cells to reduce the levels of active RhoA and increase those of Cdc42 and Rac1 (Noren et al., 2001); the reduction of RhoA was shown in Chinese Hamster ovary cells to depend on cadherin inducing more phosphorylation of p190, leading to formation of a p120/p190 complex at the plasma membrane (Noren et al., 2003). The results observed here with Cdc42 are opposite to those reported in MDCK, perhaps because we have examined tumor cell lines. By contrast, our results with RhoA appear to parallel most of the previous biochemical results. However, in H1299, the main mechanism of p190 translocation appears to result from an E-cadherin-dependent increase in p120 membrane association, as similar levels of the p120/p190 complex and of p190 phosphotyrosine were seen in cells lacking E-cadherin. The mechanism by which E-cadherin induced the increased membrane association of p120 has not been determined. We did not identify complex formation between E-cadherin and p120 or p190, nor did we identify a complex of p120 with Annexin A6, which in other systems can induce membrane association of p120 (Grewal and Enrich, 2006) (data not shown). A recent report has found that p120ctn, which binds E-cadherin, can form a complex with p190 in a melanoma cell line that overexpresses E-cadherin (Molina-Ortiz et al., 2009). However, we did not identify such a complex in the NSCLC-expressing E-cadherin (data not shown).
Our findings may have therapeutic implications by highlighting the importance of Rho family members as potentially important targets for treatment in NSCLC. Previous studies have considered the potential importance of inducing re-expression of E-cadherin (Witta et al., 2006). The fact that E-cadherin is usually silenced epigenetically by transcriptional repression, hypermethylation and/or histone deacetylation of the CDH1 promoter (Peinado et al., 2004), increases the theoretical attractiveness of that approach. However, there are no drugs that can specifically induce the re-expression of E-cadherin. Therefore, it is possible that targeting downstream effectors of E-cadherin, such as the Rho GTPases identified here, may represent a rational therapeutic alternative. Although we have identified this mechanism in each of the four NSCLC lines examined, analysis of additional NSCLC lines is required to determine the actual frequency with which E-cadherin may regulate Rho family GTPases.
Materials and methods
Plasmids and chemicals
E-cadherin-myc cDNA, provided by Dr Margaret Wheelock (Kim et al., 2000), was inserted in pCDNA3 vector. The cDNA-encoding HA-tagged dominant-negative Cdc42 (HA-DN–Cdc42), which has a point mutation (T17N), was supplied by Dr Wen Jin Wu (Tu et al., 2002; Shen et al., 2007). The empty vector pCDNA3 (Invitrogen, Carlsbad, CA, USA) was used as control (NeoR). Stable clones were selected after treatment with 0.8 mg/ml of G418 (Invitrogen). Expression vector for C3 exoenzyme was kindly provided by Dr Silvio Gutkind (Hill et al., 1995; Fromm et al., 1997). The monoclonal antibody anti-E-cadherin (SHE78-7), used to block the adhesion junctions (Watabe et al., 1994), was purchased from Calbiochem (San Diego, CA, USA).
TCF/β-catenin activity was measured using the T-cell factor reporter plasmid TOPflash (Upstate Biotechnology, Lake Placid, NY, USA), which contains the TCF-binding site upstream of the thymidine kinase minimal promoter and luciferase open reading frame. The FOPflash plasmid was used as negative control, because it contains mutated TCF-binding sites. Transfection was performed with Lipofectamine 2000 (Invitrogen) according to the manufacturer’s protocol. TOP-flash or FOPflash constructs were co-transfected together with Renilla luciferase plasmid pRL-TK vector (Promega, Madison, WI, USA), to normalize for transfection efficiency. Two days after transfection luciferase activity was measured using the Dual-Luciferase Reporter Assay System (Promega), according to the manufacturer’s instructions.
Cell culture and transfection
Human NSCLC cell lines (H1299, H23, H1703, H157), provided by Dr Curt Harris and Dr Terry Moody (National Cancer Institute) and colorectal cancer cell line (SW480), purchased from ATCC, were cultured in RPMI 1640 medium supplemented with 10% FBS, 50 IU/ml penicillin and 50 µg/ml streptomycin at 37 °C in a humidified 5% CO2 atmosphere. Transfections were carried out using Lipofectamine 2000 (Invitrogen) according to the manufacturer’s instructions. Stable clones, expressing myc-tagged E-cadherin or HA-DN–Cdc42 were selected with G418 (0.8 mg/ml). The expression of HA-tagged DN–Cdc42 proteins was analyzed by western blot, using mouse monoclonal antibodies anti-HA (Covance, Madison, WI, USA).
Transfection with small interfering RNAs (siRNAs), whose sequences are described in the supplementary materials, was performed using Lipofectamine 2000 (Invitrogen) according to the manufacturer’s protocols. Briefly, in a 6-well tissue culture plate, 3 × 10⁵ cells per well were seeded in 2ml antibiotic-free RPMI 1640 medium supplemented with 10% FCS, and on the following day transfected with siRNAs at the final concentration of 100 nm. Cells were harvested 48 h later and the expression level of the protein of interest was analyzed by western blot.
Western blot and immunoprecipitation analysis
Cells were seeded the day before the analysis in 10-cm dishes, washed with cold PBS and lysed with lysis buffer (50mm Tris–HCl, pH 7.4, 150mm NaCl, 1% Triton X-100, 10% glycerol, 2mm sodium orthovanadate, 1mm phenylmethylsulfonylfluoride, 10 µg/ml leupeptin, and 10 µg/ml aprotinin). The lysates were centrifuged at 13 000 r.p.m. for 10 min at 4 °C. Protein concentration was measured using BCA kit (Pierce, Rockford, IL, USA).
For western blot assays, equivalent amounts of proteins were analyzed by SDS–polyacrylamide gel electrophoresis. After electrophoretic separation, the proteins were transferred onto nitrocellulose membrane (Whatman GmbH, Dassel, Germany). After 1 h incubation in blocking solution (5% dried milk in TBS), filters were incubated with the appropriate antibodies specific for: E-cadherin and β-catenin (BD Biosciences Pharmingen, San Jose, CA, USA), c-myc and β-actin (Sigma-Aldrich, St. Louis, MO, USA), all mouse monoclonal antibodies; EGFR (Santa Cruz Biotechnology, Santa Cruz, CA, USA), phospho-Erk1-2Thr202/Tyr204, phospho-AktSer473, Erk1-2 and Akt (Cell Signaling Technology, Danvers, MA, USA), all rabbit polyclonal antibodies. Proteins were visualized with peroxidase-coupled secondary antibody (GE Healthcare, Buckinghamshire, UK), using enhanced chemiluminescence for detection (GE Healthcare).
RhoA Cdc42 and Rac1 pull down assays
RhoA and Cdc42/Rac1 pull-down assays were performed using, respectively, Rho Activation Assay biochem kit or PAK-PBD protein agarose beads (Cytoskeleton Inc., Denver, CO, USA), according to the manufacturer’s instructions. Cells were seeded the day before the analysis, washed with ice cold PBS, and lysed with cell lysis buffer. Lysates were centrifuged at 10 000 r.p.m. for 2 min at 4 °C, and protein concentrations were measured using BCA kit (Pierce). Equal amounts of protein from cell extracts were used for pull-down assays and incubated for 1 h at 4 °C with 15 µl of Rhotekin-RBD or PAK-PBD protein agarose beads. Pellets were washed once with 0.5 ml of washing buffer and eluted with 20 µl of Laemmli buffer (Laemmli, 1970). Samples were then boiled for 5 min at 95 °C, centrifuged at 13 000 r.p.m. for 5 min and analyzed by SDS–polyacrylamide gel electrophoresis. Western blots were then carried out using mouse anti-RhoA monoclonal antibody (Cytoskeleton), rabbit anti-Cdc42 polyclonal antibodies (Santa Cruz Biotechnology), or mouse anti-Rac1 monoclonal antibody (Upstate Biotechonology). The total level of RhoA, Cdc42 and Rac1 was measured by western blot performed on the cell extract.
The following procedures are included in the supplementary materials: immunofluorescence microscopy, siRNA sequences, cell growth and migration assays, immunoprecipitation, nuclear fractionation, statistical analysis.
Supplementary Material
Acknowledgements
We thank Drs Margaret Wheelock, Wen Jin Wu, Dianne Hirsch and Silvio Gutkind for providing plasmids, Drs Curt Harris and Terry Moody for providing NSCLC cell lines, Dr Cynthia Masison and Mike Radanovich for technical assistance and Dr Giovanna Tosato for helpful discussions. This research has been supported by the Intramural Research Program of the National Institutes of Health, National Cancer Institute, Center for Cancer Research.
Footnotes
Conflict of interest
The authors declare no conflict of interest.
Supplementary Information accompanies the paper on the Oncogene website (http://www.nature.com/onc)
References
- Aktories K, Wilde C, Vogelsgesang M. Rho-modifying C3-like ADP-ribosyltransferases. Rev Physiol Biochem Pharmacol. 2004;152:1–22. doi: 10.1007/s10254-004-0034-4. [DOI] [PubMed] [Google Scholar]
- Beherens J, von Kries JP, Kühl M, Bruhn L, Wedlich D, Grosschedl R, et al. Functional interaction of beta-catenin with the transcription factor LEF-1. Nature. 1996;382:638–642. doi: 10.1038/382638a0. [DOI] [PubMed] [Google Scholar]
- Boerner JL, Biscardi JS, Silva CM, Parsons SJ. Transactivating agonists of the EGF receptor require Tyr 845 phosphorylation for induction of DNA synthesis. Mol Carcinog. 2005;44:262–273. doi: 10.1002/mc.20138. [DOI] [PubMed] [Google Scholar]
- Bohm M, Totzeck B, Birchmeier W, Wieland I. Differences of E-cadherin expression levels and patterns in primary and metastatic human lung cancer. Clin Exp Metastasis. 1994;12:55–62. doi: 10.1007/BF01784334. [DOI] [PubMed] [Google Scholar]
- Bourne HR, Sanders DA, McCormick F. The GTPases superfamily: conserved structure and molecular mechanism. Nature. 1991;349:117–127. doi: 10.1038/349117a0. [DOI] [PubMed] [Google Scholar]
- Brembeck F, RosarioM, Birchmeier W. Balancing cell adhesion and Wnt signaling, the key role of beta-catenin. Curr Opin Genetics Dev. 2006;16:51–59. doi: 10.1016/j.gde.2005.12.007. [DOI] [PubMed] [Google Scholar]
- Bremm A, Walch A, Fuchs M, Mages J, Duyster J, Keller G, et al. Enhanced activation of epidermal growth factor receptor caused by tumor-derived E-cadherin mutations. Cancer Res. 2008;68:707–714. doi: 10.1158/0008-5472.CAN-07-1588. [DOI] [PubMed] [Google Scholar]
- Bremnes RM, Veve R, Gabrielson E, Hirsch FR, Baron A, Bemis L, et al. High-throughput tissue microarray analysis used to evaluate biology and prognostic significance of the E-cadherin pathway in non-small-cell lung cancer. J Clin Oncol. 2002a;20:2417–2428. doi: 10.1200/JCO.2002.08.159. [DOI] [PubMed] [Google Scholar]
- Bremnes RM, Veve R, Hirsch FR, Franklin WA. The E-cadherin cell-cell adhesion complex and lung cancer invasion, metastasis, and prognosis. Lung Cancer. 2002b;36:115–124. doi: 10.1016/s0169-5002(01)00471-8. [DOI] [PubMed] [Google Scholar]
- Capuzzo F, Hirsch FR, Rossi E, Bartolini S, Ceresoli GL, Bemis L, et al. Epidermal growth factor receptor gene and protein and gefitinib sensitivity in Non-small cell lung cancer. J Natl Cancer Inst. 2005;97:743–655. doi: 10.1093/jnci/dji112. [DOI] [PubMed] [Google Scholar]
- Chong IW, Chang MY, Sheu CC, Wang CY, Hwang JJ, Huang MS, et al. Detection of activated K-ras in non-small cell lung cancer by membrane array: a comparison with direct sequencing. Oncol Report. 2007;18:17–24. [PubMed] [Google Scholar]
- Deeb G, Wang J, Ramnath N, Slocum H, Wiseman S, Beck A, et al. Altered E-cadherin and epidermal growth factor receptor expressions are associated with patient survival in lung cancer: a study utilizing high-density tissue microarray and immunohistochemistry. Modern Pathol. 2004;17:430–439. doi: 10.1038/modpathol.3800041. [DOI] [PubMed] [Google Scholar]
- Durkin ME, Yuan BZ, Zhou X, Zimonjic DB, Lowy DR, Thorgeirsson SS, et al. DLC-1 a Rho GTPase-activating protein and tumour suppressor. J Cell Mol Med. 2007;11:1185–11207. doi: 10.1111/j.1582-4934.2007.00098.x. [DOI] [PMC free article] [PubMed] [Google Scholar]
- Fei Q, Zhang H, Chen X, Wang JC, Zhang R, Xu W, et al. Defected expression of E-cadherin in non-small cell lung cancer. Lung Cancer. 2002;37:147–152. doi: 10.1016/s0169-5002(02)00077-6. [DOI] [PubMed] [Google Scholar]
- Fodde R, Brabletz T. Wnt/beta-catenin signaling in cancer stemness and malignant behavior. Curr Opin Cell Biol. 2007;19:150–158. doi: 10.1016/j.ceb.2007.02.007. [DOI] [PubMed] [Google Scholar]
- Fromm C, Coso OA, Montaner S, Xu N, Gutkind JS. The small GTP-binding protein Rho links G protein-coupled receptors and Galpha12 to the serum response element and to cellular transformation. Proc Natl Acad Sci USA. 1997;94:10098–10103. doi: 10.1073/pnas.94.19.10098. [DOI] [PMC free article] [PubMed] [Google Scholar]
- Fukata M, Nakagawa M, Kuroda S, Kaibuchi K. Cell adhesion and Rho small GTPases. J Cell Science. 1999;112:4491–4500. doi: 10.1242/jcs.112.24.4491. [DOI] [PubMed] [Google Scholar]
- Fukata M, Nakagawa M, Kaibuchi K. Roles of Rho-family GTPases in cell polarisation and directional migration. Curr Opin Cell Biol. 2003;15:590–597. doi: 10.1016/s0955-0674(03)00097-8. [DOI] [PubMed] [Google Scholar]
- Gottardi CJ, Wong E, Gumbiner BM. E-cadherin suppresses cellular transformation by inhibiting beta-catenin signaling in an adhesion-independent manner. J Cell Biol. 2001;153:1049–1060. doi: 10.1083/jcb.153.5.1049. [DOI] [PMC free article] [PubMed] [Google Scholar]
- Gottardi CJ, Gumbiner BM. Distinct molecular forms of beta-catenin are targeted to adhesive or transcriptional complexes. J Cell Biol. 2004;167:339–349. doi: 10.1083/jcb.200402153. [DOI] [PMC free article] [PubMed] [Google Scholar]
- Grewal T, Enrich C. Molecular mechanisms involved in Ras inactivation: the annexin A6-p120GAP complex. Bioessays. 2006;28:1211–1220. doi: 10.1002/bies.20503. [DOI] [PubMed] [Google Scholar]
- Gumbiner BM. Cell adhesion: the molecular basis of tissue architecture and morphogenesis. Cell. 1996;84:345–357. doi: 10.1016/s0092-8674(00)81279-9. [DOI] [PubMed] [Google Scholar]
- Hajra KM, Chen DY, Fearon ER. The SLUG zinc-finger protein represses E-cadherin in breast cancer. Cancer Res. 2002;62:1613–1618. [PubMed] [Google Scholar]
- Heijink IH, Kies PM, Kauffman HF, Postma DS, van Oosterhout AJ, Vellenga E. Down-regulation of E-cadherin in human bronchial epithelial cells leads to epidermal growth factor receptor-dependent Th2 cell-promoting activity. J Immunol. 2007;178:7678–7685. doi: 10.4049/jimmunol.178.12.7678. [DOI] [PubMed] [Google Scholar]
- Hill CS, Wynne J, Treisman R. The Rho family GTPases RhoA, Rac1, and CDC42Hs regulate transcriptional activation by SRF. Cell. 1995;81:1159–1170. doi: 10.1016/s0092-8674(05)80020-0. [DOI] [PubMed] [Google Scholar]
- Hlubek F, Spaderna S, Schmalhofer O, Jung A, Kirchner T, Brabletz T. Wnt/FZD signaling and colorecteal cancer morphogenesis. Fron Biosci. 2007;12:458–470. doi: 10.2741/2075. [DOI] [PubMed] [Google Scholar]
- Hu KQ, Settleman J. Tandem SH2 binding sites mediate the RasGAP-RhoGAP interaction: a conformational mechanism for SH3 domain regulation. EMBO J. 1997;16:473–483. doi: 10.1093/emboj/16.3.473. [DOI] [PMC free article] [PubMed] [Google Scholar]
- Huang C, Liu D, Ishikawa S, Nakashima T, Makashima N, Yokomise H, et al. Wnt1 overexpression promotes tumour progression in non-small cell lung cancer. Eur J Cancer. 2008;44:2680–2688. doi: 10.1016/j.ejca.2008.08.004. [DOI] [PubMed] [Google Scholar]
- Huber O, Korn R, McLaughlin J, Ohsugi M, Herrmann BG, Kemler R. Nuclear localization of beta-catenin by interaction with transcription factor LEF-1. Mech Dev. 1996;59:3–10. doi: 10.1016/0925-4773(96)00597-7. [DOI] [PubMed] [Google Scholar]
- Jeanes A, Gottardi CJ, Yap AS. Cadherins and cancer: how does cadherin dysfunction promote tumor progression? Oncogene. 2008;27:6920–6929. doi: 10.1038/onc.2008.343. [DOI] [PMC free article] [PubMed] [Google Scholar]
- Jemal A, Siegel R, Ward E, Hao Y, Xu J, Murray T, et al. Cancer Statistics, 2008. Cancer J Clin. 2008;58:70–95. doi: 10.3322/CA.2007.0010. [DOI] [PubMed] [Google Scholar]
- Kim JB, Islam S, Kim YJ, Prudoff RS, Sass KM, Wheelock MJ, et al. N-Cadherin extracellular repeat 4 mediates epithelial to mesenchymal transition and increased motility. J Cell Biol. 2000;151:1193–1206. doi: 10.1083/jcb.151.6.1193. [DOI] [PMC free article] [PubMed] [Google Scholar]
- Kris M. How today’s developments in the treatment of Non-Small Cell Lung Cancer will change tomorrow’s standards of care. Oncologist. 2005;10:23–29. doi: 10.1634/theoncologist.10-90002-23. [DOI] [PubMed] [Google Scholar]
- Laemmli UK. Cleavage of structural proteins during the assembly of the head of bacteriophage T4. Nature. 1970;227:680–685. doi: 10.1038/227680a0. [DOI] [PubMed] [Google Scholar]
- Lee HC, Kim M, Wands JR. Wnt/Frizzled signaling in hepatocellular carcinoma. Front Biosci. 2006;11:1901–1915. doi: 10.2741/1933. [DOI] [PubMed] [Google Scholar]
- Lock JG, Hammond LA, Houghton F, Gleeson PA, Stow JL. E-Cadherin transport from the trans-Golgi network in tubulovesicular carriers is selectively regulated by Golgin-97. Traffic. 2005;6:1142–1156. doi: 10.1111/j.1600-0854.2005.00349.x. [DOI] [PubMed] [Google Scholar]
- Molenaar M, van de Wetering M, Oosterwegel M, Peterson-Maduro J, Godsave S, Korinek V, et al. XTcf-3 transcription factor mediates beta-catenin-induced axis formation in Xenopus embryos. Cell. 1996;86:391–399. doi: 10.1016/s0092-8674(00)80112-9. [DOI] [PubMed] [Google Scholar]
- Molina-Ortiz I, Bartolomé RA, Hernández-Varas P, Colo GP, Teixidó J. Overexpression of E-cadherin on melanoma cells inhibits chemokine-promoted invasion involving p190RhoGAP/p120ctn-dependent inactivation of RhoA. J Biol Chem. 2009;284:15147–15157. doi: 10.1074/jbc.M807834200. [DOI] [PMC free article] [PubMed] [Google Scholar]
- Mosmann T. Rapid colorimetric assay for cellular growth and survival: application to proliferation and cytotoxicity assays. J Immunol Methods. 1983;65:55–63. doi: 10.1016/0022-1759(83)90303-4. [DOI] [PubMed] [Google Scholar]
- Noren NK, Niessen CM, Gumbiner BM, Burridge K. Cadherin engagement regulates Rho family GTPases. J Biol Chem. 2001;276:33305–33308. doi: 10.1074/jbc.C100306200. [DOI] [PubMed] [Google Scholar]
- Noren KN, Arthur WT, Burridge K. Cadherin engagement inhibits RhoA via p190RhoGAP. J Biol Chem. 2003;278:13615–13618. doi: 10.1074/jbc.C200657200. [DOI] [PubMed] [Google Scholar]
- Olayioye MA, Beuvink I, Horsch K, Daly JM, Hynes NE. ErbB receptor-induced activation of stat transcription factors is mediated by Src tyrosine kinases. J Biol Chem. 1999;274:17209–17218. doi: 10.1074/jbc.274.24.17209. [DOI] [PubMed] [Google Scholar]
- Pao W, Wang TY, Riely GJ, Miller VA, Pan Q, Ladanyi M, et al. KRAS mutations and primary resistance of lung adeno-carcinomas to gefitinib or erlotinib. PLoS Med. 2005;2:57–61. doi: 10.1371/journal.pmed.0020017. [DOI] [PMC free article] [PubMed] [Google Scholar]
- Peinado H, Ballestar E, Esteller M, Cano A. Snail mediates E-cadherin repression by the recruitment of the Sin3A/histone deacetylase 1 (HDAC1)/HDAC2 complex. Mol Cell Biol. 2004;24:306–319. doi: 10.1128/MCB.24.1.306-319.2004. [DOI] [PMC free article] [PubMed] [Google Scholar]
- Perrais M, Chen X, Perez-Moreno M, Gumbiner BM. Ecadherin homophilic ligation inhibits cell growth and epidermal growth factor receptor signaling independently of other cell interactions. Mol Biol Cell. 2007;18:2013–2025. doi: 10.1091/mbc.E06-04-0348. [DOI] [PMC free article] [PubMed] [Google Scholar]
- Pirinen RT, Hirvikoski P, Johansson RT, Hollmén S, Kosma VM. Reduced expression of alpha-catenin, beta-catenin, and gamma-catenin is associated with high cell proliferative activity and poor differentiation in non-small cell lung cancer. J Clin Pathol. 2001;54:391–395. doi: 10.1136/jcp.54.5.391. [DOI] [PMC free article] [PubMed] [Google Scholar]
- Qian X, Karpova T, Sheppard AM, McNally J, Lowy DR. E-cadherin-mediated adhesion inhibits ligand-dependent activation of diverse receptor tyrosine kinases. EMBO J. 2004;23:1739–1748. doi: 10.1038/sj.emboj.7600136. [DOI] [PMC free article] [PubMed] [Google Scholar]
- Qian X, Li G, Asmussen HK, Asnaghi L, Vass WC, Braverman R, et al. Oncogenic inhibition by a deleted in liver cancer gene requires cooperation between tensin binding and Rho-specific GTPase-activating protein activities. Proc Natl Acad Sci USA. 2007;104:9012–9017. doi: 10.1073/pnas.0703033104. [DOI] [PMC free article] [PubMed] [Google Scholar]
- Ridley AJ. Rho proteins and cancer. Breast Cancer Res Treat. 2004;84:13–19. doi: 10.1023/B:BREA.0000018423.47497.c6. [DOI] [PubMed] [Google Scholar]
- Riely G, Kris M, Rosenbaum D, Marks J, Li A, Chitale D, et al. Frequency and distinctive spectrum of KRAS mutations in never smokers with lung adenocarcinoma. Clin Cancer Res. 2008;14:5731–5734. doi: 10.1158/1078-0432.CCR-08-0646. [DOI] [PMC free article] [PubMed] [Google Scholar]
- Roof RW, Haskell BD, Dukes BD, Sherman N, Kinter M, Parsons SJ. Phosphotyrosine (p-Tyr)-dependent and -independent mechanisms of p190 RhoGAP-p120 RasGAP interaction: Tyr 1105 of p190, a substrate for c-Src, is the sole p-Tyr mediator of complex formation. Mol Cell Biol. 1998;18:7052–7063. doi: 10.1128/mcb.18.12.7052. [DOI] [PMC free article] [PubMed] [Google Scholar]
- Shen Y, Hirsch DS, Sasiela CA, Wu WJ. Cdc42 regulates E-cadherin ubiquitination and degradation through an epidermal growth factor receptor to Src-mediated pathway. J Biol Chem. 2007;283:5127–5137. doi: 10.1074/jbc.M703300200. [DOI] [PubMed] [Google Scholar]
- Shih JY, Tsai MF, Chang TH, Chang YL, Yuan A, Yu CJ, et al. Transcription repressor slug promotes carcinoma invasion and predicts outcome of patients with lung adenocarcinoma. Clin Cancer Res. 2005;11:8070–8078. doi: 10.1158/1078-0432.CCR-05-0687. [DOI] [PubMed] [Google Scholar]
- Sordella R, Bell DW, Haber D, Settleman J. Gefitinib-sensitizing EGFR mutations in lung cancer activate anti-apoptotic pathways. Science. 2004;305:1163–1167. doi: 10.1126/science.1101637. [DOI] [PubMed] [Google Scholar]
- Takai Y, Sasaki T, Tanaka K, Nakanishi H. Rho as a regulator of the cytoskeleton. Trends Biochem Sci. 1995;20:227–231. doi: 10.1016/s0968-0004(00)89022-2. [DOI] [PubMed] [Google Scholar]
- Takeichi M. Morphogenetic roles of classic cadherins. Curr Opin Cell Biol. 1995;7:619–627. doi: 10.1016/0955-0674(95)80102-2. [DOI] [PubMed] [Google Scholar]
- Tang Y, Olufemi L, Wang M, Nie D. Role of Rho GTPases in breast cancer. Frontiers Biosci. 2008;13:759–776. doi: 10.2741/2718. [DOI] [PubMed] [Google Scholar]
- Tcherkezian J, Lamarche-Vane N. Current knowledge of the large RhoGAP family of proteins. Biol Cell. 2007;99:67–86. doi: 10.1042/BC20060086. [DOI] [PubMed] [Google Scholar]
- Toyoyama H, Nuruki K, Ogawa H, Yanagi M, Matsumoto H, Nishijima H, et al. The reduced expression of e-cadherin, alpha-catenin and gamma-catenin but not beta-catenin in human lung cancer. Oncol Rep. 1999;6:81–85. doi: 10.3892/or.6.1.81. [DOI] [PubMed] [Google Scholar]
- Tu SS, Wu WJ, Yang W, Nolbant P, Hahn K, Cerione RA. Antiapoptotic Cdc42 mutants are potent activators of cellular transformation. Biochemistry. 2002;41:12350–12358. doi: 10.1021/bi026167h. [DOI] [PubMed] [Google Scholar]
- Uchkado Y, Natsugoe S, Okumura H, Setoyama T, Matsumoto M, Ishigami S, et al. Slug expression in the E-cadherin preserved tumors is related to prognosis in patients with esophageal squamous cell carcinoma. Clin Cancer Res. 2005;11:1174–1180. [PubMed] [Google Scholar]
- van de Wetering M, Barker N, Harkes IC, van der Heyden M, Dijk NJ, Hollestelle A, et al. Mutant E-cadherin breast cancer cells do not display constitutive Wnt signaling. Cancer Res. 2001;61:278–284. [PubMed] [Google Scholar]
- Vincan E, Barker N. The upstream components of the Wnt signalling pathway in the dynamic EMT and MET associated with colorectal cancer progression. Clin Exp Metastasis. 2008;25:657–663. doi: 10.1007/s10585-008-9156-4. [DOI] [PubMed] [Google Scholar]
- Watabe M, Nagafuchi A, Tsukita S, Takeichi M. Induction of polarized cell-cell association and retardation of growth by activation of the E-cadherin-catenin adhesion system in a dispersed carcinoma line. J Cell Biol. 1994;127:247–256. doi: 10.1083/jcb.127.1.247. [DOI] [PMC free article] [PubMed] [Google Scholar]
- Witta S, Gemmill RM, Hirsch FR, Coldren CD, Hedman K, Ravdel L, et al. Restoring E-cadherin expression increases sensitivity to epidermal growth factor receptor inhibitors in lung cancer cell lines. Cancer Res. 2006;66:944–950. doi: 10.1158/0008-5472.CAN-05-1988. [DOI] [PubMed] [Google Scholar]
- Yoshiura K, Kanai Y, Ochiai A, Shimoyama Y, Sugimura T, Hirohashi S. Silencing of the E-cadherin invasion-suppressor gene by CpG methylation in human carcinomas. Proc Natl Acad Sci USA. 1995;92:7416–7419. doi: 10.1073/pnas.92.16.7416. [DOI] [PMC free article] [PubMed] [Google Scholar]
Associated Data
This section collects any data citations, data availability statements, or supplementary materials included in this article.


