

Background: IF1 inhibits ATPase activity of mitochondrial FoF1-ATP synthase.
Results: Although IF1 alleviates ischemic injury, the cell can grow normally, manage to maintain ATP levels, and keep mitochondria morphology intact without IF1.
Conclusion: IF1 helps ATP homeostasis, but activated glycolysis can cover deficiency of IF1.
Significance: Integrated regulation of mitochondrial ATP synthesis is crucial for metabolic dynamism.
Keywords: ATP Synthase, ATPases, Bioenergetics, Ischemia, Mitochondria, IF1, Proton Motive Force, Uncoupler
Abstract
FoF1-ATP synthase (FoF1) synthesizes ATP in mitochondria coupled with proton flow driven by the proton motive force (pmf) across membranes. It has been known that isolated IF1, an evolutionarily well conserved mitochondrial protein, can inhibit the ATP hydrolysis activity of FoF1. Here, we generated HeLa cells with permanent IF1 knockdown (IF1-KD cells) and compared their energy metabolism with control cells. Under optimum growth conditions, IF1-KD cells have lower cellular ATP levels and generate a higher pmf and more reactive oxygen species. Nonetheless, IF1-KD cells and control cells show the same rates of cell growth, glucose consumption, and mitochondrial ATP synthesis. Furthermore, contrary to previous reports, the morphology of mitochondria in IF1-KD cells appears to be normal. When cells encounter sudden dissipation of pmf, the cytoplasmic ATP level in IF1-KD cells drops immediately (∼1 min), whereas it remains unchanged in the control cells, indicating occurrence of futile ATP hydrolysis by FoF1 in the absence of IF1. The lowered ATP level in IF1-KD cells then recovers gradually (∼10 min) to the original level by consuming more glucose than control cells. The viability of IF1-KD cells and control cells is the same in the absence of pmf. Thus, IF1 contributes to ATP homeostasis, but its deficiency does not affect the growth and survival of HeLa cells. Only when cells are exposed to chemical ischemia (no glycolysis and no respiration) or high concentrations of reactive oxygen species does IF1 exhibit its ability to alleviate cell injury.
Introduction
FoF1-ATP synthase (FoF1)2 in mitochondria synthesizes ATP coupled with proton flow driven by proton motive force (pmf) across membranes, which is generated by the respiratory chain. Demand for ATP and supply of oxygen and oxidation substrates for the respiratory chain can vary in living cells, and activity of FoF1 must be regulated to meet these situations. When pmf becomes insufficient for ATP synthesis due to ischemia or other reasons, ATP production becomes more dependent on glycolysis. At the same time, however, FoF1 would start to catalyze the back reaction, ATP hydrolysis. Therefore, cells must somehow prevent this futile ATP hydrolysis of FoF1, and IF1 has been proposed to take this task. IF1 was isolated as a protein factor that showed inhibitory effects on the ATP hydrolysis activity of FoF1 (1). It is a nuclear-coded mitochondrial protein and is conserved evolutionarily from yeast to mammals (2–4). IF1 forms a dimer at acidic pH (∼6.7) and exhibits inhibitory effects, but a tetramer form, which is formed at basic pH (∼8.0), cannot interact with FoF1 (5, 6). The crystal structure of the F1 portion of FoF1 with bound IF1 shows that the C-terminal α-helix of IF1 is inserted into the interface between the α- and β-subunits of F1 (7).
Recently, in vivo studies have revealed an important role of IF1 in energy metabolism in living cells. It was found that IF1 is overexpressed in various human cancer cells, and it has been proposed that one role of IF1 is as an additional molecular switch for the metabolic shift from oxidative phosphorylation to glycolysis in tumor cells (8). When cells are deprived of oxygen and glucose, IF1-suppressed cells lose cellular ATP and die more rapidly than control cells, suggesting a role of IF1 in maintaining ATP concentration ([ATP]) in energy crises (9). Several groups reported that IF1 facilitates dimer formation of FoF1 in the inner mitochondrial membranes (10–12) and contributes to cristae formation (9, 13–18). This profound effect of IF1 on mitochondrial morphology remains controversial (19, 20). Reports have indicated that overexpression of IF1 decreased the magnitude of pmf and increased the rate of respiration (9), whereas the opposite results have also been reported (8). Most of previous observations described above were made for the cells in which IF1 knockdown and overexpression are transient, and there remains ambiguity over whether the observed phenomena are only transient, during adaptation to IF1-deficient situations, and not inherent to cells already adapted. Transient knockdown also is inconvenient for observing cells over long periods of time, such as observing cell growth and cell viability. In this report, we generated HeLa cells in which IF1 expression is suppressed permanently (IF1-KD cells) and compared their energy metabolism and cell physiology with control cells. Under optimum growth conditions, even though cellular [ATP] in IF1-KD cells is low and reactive oxygen species (ROS) production is elevated, IF1-KD cells and control cells apparently show the same cell growth, glucose consumption, mitochondrial ATP synthesis, and mitochondria morphology. When pmf is lost, IF1-KD cells maintain cellular [ATP] after recovery from a transient drop by activated levels of glycolysis and show no defect in survival in the absence of pmf. Thus, IF1 contributes to [ATP] homeostasis, but cells can grow and survive without IF1 as long as glucose is available. When both glycolysis and respiration are blocked or high levels of ROS are produced, IF1 helps cells to endure longer.
MATERIALS AND METHODS
Cells and Mitochondria
HeLa cells (from Japanese Collection of Research Bioresources) were grown in DMEM (Nissui Pharmaceutical) supplemented with 10% fetal bovine serum (Invitrogen). For the glucose deprivation experiment, the dialyzed fetal bovine serum (Invitrogen) was supplemented into glucose-free DMEM (Cell Science & Technology Institute). Mitochondrial fractions were prepared as described (21).
Retroviral Gene Transduction
An shRNA-expressing retroviral vector of pSuper.retro.puro (Oligoengine) was used for gene knockdown. The target sequences for shRNA were predicted by an application of iRNAi (mekentosj freeware). The sequence for IF1-KD was 5′-GAGCACAGAGTAGAGA ACAACTGGCAGCT-3′. Preparation and transduction of retroviruses were carried out as described (22).
Electrophoresis
After lysis of the fractions and SDS-PAGE, the gel was blotted with Bjerrum buffer supplemented with 20% ethanol and 0.037% SDS by semi-dry blotter (Bio-Rad) at 12 V for 30 min at room temperature. Antibodies were as follows: anti-α, anti-β, anti-ϵ, and anti-IF1 antibodies were purchased from Molecular Probes (A21350), Molecular Probes (A21351), Abnova (H00000514-M01), and MitoScience (MS506), respectively. For analysis of the native FoF1 complex, clear native polyacrylamide gel electrophoresis was used. Mitochondrial fractions (1 μg/μl proteins) were suspended with a solubilization buffer (50 mm imidazole-HCl, pH 7.0, 50 mm NaCl, 2 mm 6-aminohexanoic acid, 1 mm EDTA, and 3 μg/μl of digitonin) at 4 °C. The suspension was incubated on ice for 10 min and centrifuged at 100,000 × g for 10 min at 4 °C. The supernatant was mixed with 0.1 volume of a loading buffer (50% glycerol and 0.1% Ponceau S). After electrophoresis, the gel was immersed in a denaturation buffer (48 mm Tris base, 39 mm glycine, 20% ethanol, and 1% SDS) for 10 min at room temperature and was subjected to Western blotting.
Assays
Cellular [ATP] was measured as follows. Cells were passaged onto a six-well culture plate and cultivated. After incubation for a day, they were washed by ice-cold phosphate-buffered saline twice and by 500 μl of 0.4 m perchloric acid. The plate was floated on liquid nitrogen, and cells were frozen. After thawing on ice, cells were scraped and centrifuged at 18,000 × g for 10 min at 4 °C. The supernatant (400 μl) was mixed with 40 μl of 4 m K2CO3, and cells were incubated on ice for 10 min. Finally, cells were centrifuged at 18,000 × g for 10 min at 4 °C, and the amount of ATP in the supernatant was measured by luciferase assay. The protein concentration of the lysate was also measured by BCA protein assay (Thermo Scientific). ATP synthesis was measured by MASC (Mitochondrial Activity of Storeptolysin O-permeabilized Cell) assay (22, 23). Briefly, cells were passaged to a 96-well white plate and incubated overnight. The cells were permeabilized by streptolysin O, and their cytosolic components were washed out. Luciferase, luciferin, 0.1 mm ADP, and 10 mm Pi were supplemented, and the reaction was started by addition of 10 mm succinic acid. Luciferin emission was monitored by a luminometer (Berthold Technologies). Glucose consumption by cells was measured as follows. Cells passaged at 7.5 × 10⁴ cells/well of a six-well plate were incubated for 2 days in normal DMEM or DMEM containing 15 μm carbonyl cyanide 3-chlorophenylhydrazone (CCCP). Then, the culture medium was collected to measure the remaining glucose, and the cells were collected to count living cells by trypan blue exclusion assay. Concentration of medium glucose was measured by phenol sulfate method (24).
[ATP] Monitoring
Real-time monitoring of cytoplasmic [ATP] levels was carried out with ATeam (25). Cells were passaged at 7.7 × 10⁴ cells per 3.5-cm glass-bottomed dish within 2 ml of phenol red-free DMEM and were incubated overnight. The next day, 0.5 ml of the culture medium was collected, and 50 μm CCCP, 10 μg/ml oligomycin, and/or 10 mm 2-deoxyglucose were added as indicated. The dishes were set in a micro-chamber (Olympus MI-IBC-IF) on a fluorescent microscope (IX-81 Olympus) and were incubated for 10 min at 37 °C in air containing 5% CO2. FRET signals were measured for 10 min, and then 0.5 ml of the collected medium was added into the dishes. The FRET signals were measured for another 60 min (one frame per min). The measurement was performed with a FRET filter set (XF88-2 Optoscinece), 20× object immersion lens (UPLANSAPO 20XO Olympus; numerical aperture, 0.85), ND12 filter, and 250-ms exposure time, and the images were scanned by a cooled CCD camera (ORCA-R2 Hamamatsu Photonics). All of the data analysis was done by MetaMorph software (Molecular Devices).
Cell Images
To visualize mitochondria, cells were passaged at 7.7 × 10⁴ cells per 3.5-cm glass-bottomed dish and were incubated overnight. The dishes were set in a micro-chamber (Olympus MI-IBC-IF) on a fluorescent microscope (Olympus IX-81) at 37 °C under 5% CO2 in air and tetramethylrhodamine ethyl ester (TMRE) was added at 15 nm (final concentration). After a 20-min incubation, images of cells were recorded, and the fluorescent intensities were obtained. Three independent experiments were carried out, and TMRE intensities of >400 cells were quantitated. The p value between the IF1-KD and the control-treated cells is <0.01. To observe electron microscopic images, cells were grown on plastic dishes and fixed by 2% paraformaldehyde and 2% glutaraldehyde in 0.1 m phosphate buffer (pH 7.4) at room temperature for 30 min. Next, cells were exposed into 2% glutaraldehyde in 0.1 m phosphate buffer (pH 7.4) at 4 °C overnight. The samples were post-fixed with 2% osmium tetroxide in 0.1 m phosphate buffer (pH 7.4) at 4 °C for 1 h. They were anhydrated by ethanol and embedded in Quetol-812 resin at 60 °C for 48 h. They were stained by 2% uranyl acetate at room temperature for 15 min and by lead staining solution at room temperature for 3 min. Electron microscopic images were shot by JEOL JM1200EX at 80 kV.
Cell Viability
In the viability test in CCCP, cells passaged at 1.5 × 10⁵ cells/well of a six-well plate were incubated for 2 days in normal DMEM or DMEM containing 15 μm CCCP. Then, cells were collected, and living cells were counted by trypan blue exclusion assay. In the Paraquat tolerance assay, 5000 cells per well of a 96-well plate were passaged and were incubated overnight. The next day, the media were changed to those with/without paraquat. After incubation for another day, the viable cells were measured by 2-(2-methoxy-4-nitrophenyl)-3-(4-nitrophenyl)-5-(2,4-disulfophenyl)-2H-tetrazolium assay (Cell Counting Kit-8; Dojindo).
RESULTS
Stable Knockdown of IF1
Stable IF1 knockdown HeLa cells (IF1-KD cells) were established by retroviral gene transduction. IF1-KD cells express only a small amount of IF1 in mitochondria, less than ∼10% of control cells, without affecting expression of α-, β-, and ϵ-subunits of FoF1 (Fig. 1A). The content of the FoF1 complex in mitochondria in IF1-KD cells is also similar to that of those in control cells. Under the conditions we tested, the dimer of FoF1 was hardly seen in the blue native gel electrophoresis in either IF1-KD cells or control cells (Fig. 1B). To avoid the possibility that the concentration of detergent (digitonin in our case) was too high to preserve the dimer form, we tested several concentrations of digitonin for solubilization of mitochondria, but the results were the same.
FIGURE 1.
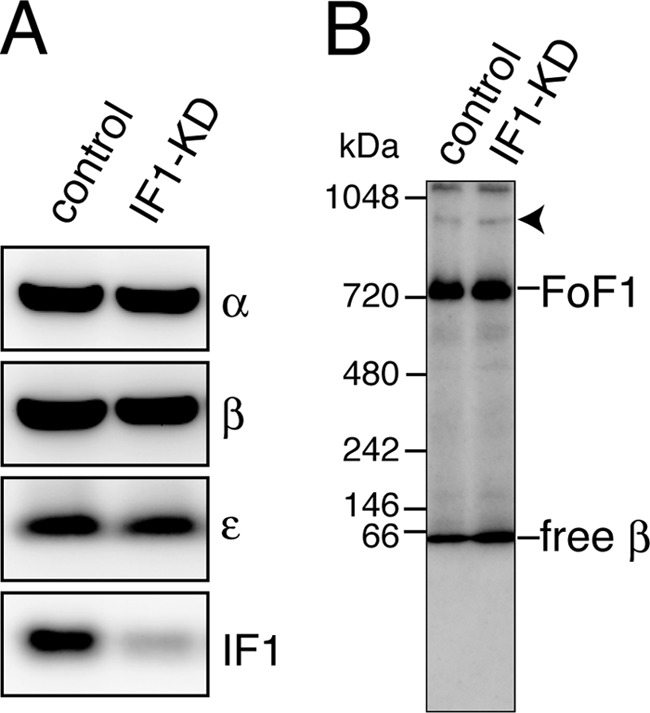
A, the amount of expressed IF1 in mitochondria. B, the amount of assembled FoF1 in mitochondria. Mitochondrial fractions from control and IF1-KD cells were subjected to SDS-PAGE (A) and stained with antibodies against α-, β-, and ϵ-subunits of FoF1 and with anti-IF1 antibody or blue-native PAGE (B) and stained with anti-β-subunit antibody. Arrowhead indicates the position of dimer of FoF1.
Low [ATP], High Δψ, and High ROS in IF1-KD Cells
The amount of ATP in IF1-KD cells per protein was compared with that of the control cells. Because the shapes and sizes of IF1-KD cells are indistinguishable from those of control cells, the values are taken as relative concentrations of cellular ATP. The results show that cellular [ATP] in IF1-KD cells is ∼30% lower than [ATP] in control cells (Fig. 2A). This implies that IF1 is working in control cells to block ATP hydrolysis activity of FoF1 even under optimum growth conditions and that IF1-KD cells are hydrolyzing more ATP. More ATP hydrolysis by FoF1 that accompanies the pumping out of protons from mitochondria should build up a higher pmf. Indeed, when the mitochondrial membrane potential (Δψ), which constitutes pmf together with transmembrane ΔpH, is estimated from TMRE images (see Fig. 3D), it is clear that IF1-KD cells generate a higher Δψ than control cells (Fig. 2B). ROS levels in IF1-KD cells, assessed by dichlorofluorescein, a fluorescent probe for ROS, is two times higher than in control cells (Fig. 2C), probably as a result of higher Δψ.
FIGURE 2.

A, the amounts of ATP contained in IF1-KD and the control cells. The amounts of ATP relative to the amount of total proteins are shown. B, mitochondrial membrane potential (Δψ) estimated from TMRE fluorescence intensities averaged from 400 cells (p < 0.01). C, ROS levels in IF1-KD (n = 24) and control (n = 16) cells estimated from fluorescence intensities of dichlorofluorescein (DCF) (p < 0.01). Experimental details are as described under “Materials and Methods.” The error bars indicate S.D.
FIGURE 3.

A, cell growth of IF1-KD and control cells. Cells were grown in optimum growth conditions (DMEM). Relative cell numbers are plotted. B, ATP synthesis activity of mitochondria in IF1-KD and control cells measured by MASC assay. Synthesized ATP was monitored with luciferase. Oligomycin (oligo) was added for the negative controls. C, typical electron microscopic images of IF1-KD and control cells. The scale bars are 500 nm. D, typical images of IF1-KD and control cells stained with TMRE. The scale bars are 50 μm. Experimental details are as described under “Materials and Methods.”
Normal Growth, ATP Synthesis, and Mitochondria Morphology of IF1-KD Cells
Despite lower [ATP] and higher ROS production, IF1-KD cells can grow at the same rate as control cells (Fig. 3A). Then, the ability of mitochondria to synthesize ATP was compared by MASC assay (see “Materials and Methods”) (22). The results show that mitochondria in IF1-KD cells can synthesize ATP at nearly the same rate as control cells (Fig. 3B), indicating that the ATP synthesis reaction catalyzed by FoF1 is not affected by IF1. The observed ATP synthesis is catalyzed by FoF1 but not by other metabolism because the synthesis is completely inhibited by oligomycin, a specific inhibitor of mitochondrial FoF1. Note that this result cannot exclude the possibility that IF1 plays a role in preventing ATP hydrolysis because the reaction mixtures of the above experiments contain ADP and Pi but very small amounts of ATP. We extensively examined population, shape, and cristae structures of mitochondria in IF1-KD cells in electron micrograph and TMRE images, but we could not find significant differences from those in control cells and found them indistinguishable (Fig. 3, C and D). Also, obvious promotion of autophagy was not observed in IF1-KD cells in image inspections conducted by us and by N. Mizushima and C. Kishi (data not shown). Thus, under the optimum growth conditions, function, and morphology of mitochondria in IF1-KD cells are apparently normal, and cell growth is not affected by the absence of IF1.
Decrease in [ATP] upon Loss of pmf in IF1-KD Cells
IF1 has been assumed to play a role in preventing ATP hydrolysis by FoF1 under conditions where pmf is small or null. Next, to know whether it really happens in living cells, cytoplasmic [ATP] is monitored in real-time with a recently developed ATP-sensing probe, ATeam. ATeam is a protein consisting of three domains: yellow fluorescence protein, a bacterial protein capable of ATP binding, and cyan fluorescence protein. ATP binding to the middle domain induces changes of FRET efficiency between the two fluorescent domains (25). IF1-KD cells and control cells were infected with ATeam-expressing retrovirus, and their stable cell lines were established. Cells were incubated in a micro-chamber on a fluorescent microscope, and after 10 min, CCCP, an uncoupler that dissipates pmf, was added. [ATP] in control cells was apparently unaffected by CCCP and remained constant. On the other hand, [ATP] in IF1-KD cells dropped upon addition of CCCP and recovered to its original level in 10 min (Fig. 4A). This drop is attributed to the ATP hydrolysis promoted by FoF1 in the absence of pmf because it was not observed when oligomycin, a specific inhibitor of FoF1, was included in the solution (Fig. 4B). When the solution contained CCCP and 2-deoxyglucose, which blocks glycolysis, [ATP] in both IF1-KD cells and control cells dropped and never recovered (Fig. 4C). The FRET decrease in IF1-KD cells is roughly 1.5-fold faster than in control cells, giving an approximation that uninhibited FoF1 would be responsible for one third of ATP consumption in IF1-KD cells. All of these results suggest that activated glycolysis is responsible for both the prevention of CCCP-induced drop of [ATP] in control cells and the recovery from CCCP-induced drop of [ATP] in IF1-KD cells.
FIGURE 4.

A–C, change of cytoplasmic [ATP] upon loss of pmf by addition of CCCP. [ATP] was monitored by an ATP-sensing probe, ATeam, in which the yellow fluorescence domain (YFP) comes closer to the cyan fluorescence domain (CFP) when the middle domain binds ATP, causing FRET. Left panels, typical FRET images of cells, representing by ratio of YFP/cyan fluorescence domain (1.6 (blue) to 2.2 (red)); right panels, changes of FRET values averaged from randomly chosen cells. Cell numbers of control and IF1-KD cells used for averaging were 17 and 23 (A), 18 and 13 (B), and 9 and 17 (C). The error bars indicate S.D. Diamonds, IF1-KD cells; squares, control cells. At time zero, CCCP (A; 50 μm), CCCP+oligomycin (B; 10 μg/ml), or CCCP+2-deoxyglucose (C; 10 mm) was added. The scale bar in A is 20 μm.
Activated Glycolysis in IF1-KD Cells in Absence of pmf
Next, we measured glucose consumption in the absence and presence of CCCP. As shown (Fig. 5A), both control and IF1-KD cells consume similar amounts of glucose in the absence of CCCP. The consumption is increased for both cells when CCCP is present, but the extent of increase is much greater for IF1-KD cells than for control cells, reflecting that more glucose would be required to compensate wasteful ATP hydrolysis by uninhibited FoF1 in IF1-KD cells. Given that [ATP] is maintained in IF1-KD cells, IF1-KD cells would be expected to survive well in the presence of CCCP. This is indeed the case; both control and IF1-KD cells hardly die after a 24-h incubation in CCCP (Fig. 5B). Thus, even if dissipation of pmf of mitochondria in IF1-KD cells induces a transient drop of [ATP] and an increase in glucose consumption, IF1-KD cells can still endure pmf-null situations just as well as control cells can.
FIGURE 5.

Shown are glucose consumption (A) and viability of cells (B) cultured in normal DMEM for 48 h in the absence or presence of 15 μm CCCP. Experimental details are as described under “Materials and Methods.”
Death of IF1-KD Cells under Fatal Conditions
The effect of IF1 on cell viability is evident only under fatal conditions where even control cells are dying. When all the energy sources for cells are deprived, that is, glycolysis is blocked by 2-deoxyglucose and respiration by potassium cyanide (KCN), cells cannot make any ATP and start to die. The time course of progression of cell death reveals that IF1-KD cells die at a faster rate than the control cells (Fig. 6A). The difference is not drastic but is still significant. Thus, IF1, in this situation mimicking ischemia, helps cells to survive longer. This observation is consistent with the results of transient IF1 knockdown as reported (9). Another fatal condition is inclusion of paraquat, a poison that catalyzes efficient ROS production in cells. Again, IF1-KD cells are more vulnerable to paraquat (Fig. 6B). Higher background ROS levels in IF1-KD cells (Fig. 2C) may contribute to the higher susceptibility to paraquat.
FIGURE 6.

A, viability of IF1-KD and control cells in 10 mm 2-deoxyglucose and 5 mm KCN (chemical ischemia). Cells were exposed to chemical ischemia for 0, 10, 30, and 120 min, and living cells were counted (n = 6). The double asterisk indicates that the p value is <0.01. B, viability of IF1-KD and control cells under ROS-producing conditions. Cells were cultured in 0, 1, and 5 mm paraquat for 2 days, and living cells were counted (n = 6). The living cell numbers in the absence of paraquat are set at 100%.
DISCUSSION
Cells Grow Normally without IF1
Taking advantage of HeLa cells with permanent IF1 knockdown, we show that IF1-deficient cells can grow at the same rate under optimum growth conditions as control cells. Low cellular [ATP] and high ROS production in IF1-KD cells do not hamper cell growth. It was reported that a mutant Saccharomyces cerevisiae that lacks IF1 can grow at the same rate as wild-type cells (26), suggesting that normal cell growth in the absence of IF1 is common to yeast and mammals. In other words, IF1 is not essential for normal cell growth.
IF1 Does Not Affect Mitochondria Morphology
Previous studies reported that knockdown of IF1 caused stimulation of autophagy, decrease in mitochondrial volume fraction in the cell, and decrease in cristae density in mitochondria (10, 11, 13, 14). However, none of these were observed for IF1-KD cells with certainty in our study. We cultured stable IF1-KD cells for more than one year, but no obvious change of morphology in cellular organelles, including mitochondria, was noticed throughout this period. One possible reason for the different results is that previous works used transient knockdown via RNAi, whereas we used stable, permanent knockdown cells established by retrovirus infection. If the morphological changes in mitochondria are transient ones to respond to new situations where IF1 is no longer available, they would escape our observation. Our observations of mitochondria in IF1-KD HeLa cells are consistent with our recent findings that IF1 knock-out mice have mitochondria with apparently normal morphology.3 In addition, we observed that the amount of FoF1 dimer is the same between control and IF1-KD cells. As reported (19, 20, 27), our observation does not support the indication that IF1 facilitates formation of FoF1 dimer, which then helps cristae formation (9).
IF1 Is Rapidly Recruited upon pmf Loss
The real-time monitoring of cellular [ATP] by a newly developed ATeam unveiled how HeLa cells maintain [ATP] when they are exposed to hypoxic conditions that cause loss of pmf in mitochondria. Upon loss of pmf, [ATP] in IF1-KD cells drops sharply, whereas [ATP] in control cells is apparently unchanged (Fig. 4A). This [ATP] drop in IF1-KD cells is not observed when oligomycin is present (Fig. 4B), ensuring that ATP hydrolysis activity of uninhibited FoF1 without available IF1 is responsible for the drop. In the case of control cells, this means that IF1 in mitochondria immediately prevents FoF1 from performing ATP hydrolysis, which otherwise could occur under conditions where ATP is ample and pmf is poor, and maintains [ATP] without drop. Thus, the rapid action of IF1 during cellular energy crises (e.g. ischemia) is demonstrated for the first time.
IF1-deficient Cells Can Maintain [ATP] after pmf Loss by Glycolysis
[ATP] in IF1-KD cells recovers from the transient drop to original levels 10 min after the pmf loss (Fig. 4A) even though hydrolysis of ATP by uninhibited FoF1 continues. This should be due to elevated glycolysis because glucose consumption by IF1-KD cells increases nearly three times when pmf is lost (Fig. 4D). Similarly, glycolysis in the control cells would be elevated immediately after the pmf loss to produce more ATP to compensate for the loss of the ATP supply from mitochondria. It is not known what signal induces activation of glycolysis in IF1-KD and control cells. It has been well established that key enzymes in the glycolytic pathway can be allosterically activated when [ATP] drops (28). However, control HeLa cells maintain [ATP] without a transient [ATP] drop. We point out an intriguing possibility that the loss of pmf itself triggers activation of glycolysis through a mechanism that is yet unknown.
Acknowledgments
We appreciate critical comments by Drs. N. Mizushima and C. Kishi (Tokyo Medical and Dental University) regarding the inspection of electron microscopic images of mitochondria. We also thank M. Mori for excellent technical assistance and Daniel Xu for critical reading and polishing the manuscript.
This work was supported by the ATP Synthesis Regulation Project (ICORP) by the Japan Science and Technology Agency (to M. Y.).
J. Nakamura, M. Fujikawa, and M. Yoshida, unpublished results.
- FoF1
- FoF1-ATP synthase
- pmf
- proton motive force
- IF1-KD
- IF1 knockdown
- ROS
- reactive oxygen species
- CCCP
- carbonyl cyanide 3-chlorophenylhydrazone
- TMRE
- tetramethylrhodamine ethylester.
REFERENCES
- 1. Pullman M. E., Monroy G. C. (1963) A naturally occurring inhibitor of mitochondrial adenosine triphosphatase. J. Biol. Chem. 238, 3762–3769 [PubMed] [Google Scholar]
- 2. Ichikawa N., Ushida S., Kawabata M., Masazumi Y. (1999) Nucleotide sequence of cDNA coding the mitochondrial precursor protein of the ATPase inhibitor from humans. Biosci. Biotechnol. Biochem. 63, 2225–2227 [DOI] [PubMed] [Google Scholar]
- 3. Ichikawa N., Yoshida Y., Hashimoto T., Ogasawara N., Yoshikawa H., Imamoto F., Tagawa K. (1990) Activation of ATP hydrolysis by an uncoupler in mutant mitochondria lacking an intrinsic ATPase inhibitor in yeast. J. Biol. Chem. 265, 6274–6278 [PubMed] [Google Scholar]
- 4. Yamada E., Ishiguro N., Miyaishi O., Takeuchi A., Nakashima I., Iwata H., Isobe K. (1997) Differential display analysis of murine collagen-induced arthritis: Cloning of the cDNA-encoding murine ATPase inhibitor. Immunology 92, 571–576 [DOI] [PMC free article] [PubMed] [Google Scholar]
- 5. Aggeler R., Coons J., Taylor S. W., Ghosh S. S., Garcia J. J., Capaldi R. A., Marusich M. F. (2002) A functionally active human F1Fo-ATPase can be purified by immunocapture from heart tissue and fibroblast cell lines. Subunit structure and activity studies. J. Biol. Chem. 277, 33906–33912 [DOI] [PubMed] [Google Scholar]
- 6. Cabezon E., Butler P. J., Runswick M. J., Walker J. E. (2000) Modulation of the oligomerization state of the bovine F1-ATPase inhibitor protein, IF1, by pH. J. Biol. Chem. 275, 25460–25464 [DOI] [PubMed] [Google Scholar]
- 7. Cabezón E., Montgomery M. G., Leslie A. G., Walker J. E. (2003) The structure of bovine F1-ATPase in complex with its regulatory protein IF1. Nat. Struct. Biol. 10, 744–750 [DOI] [PubMed] [Google Scholar]
- 8. Sánchez-Cenizo L., Formentini L., Aldea M., Ortega A. D., García-Huerta P., Sánchez-Aragó M., Cuezva J. M. (2010) Up-regulation of the ATPase inhibitory factor 1 (IF1) of the mitochondrial H+-ATP synthase in human tumors mediates the metabolic shift of cancer cells to a Warburg phenotype. J. Biol. Chem. 285, 25308–25313 [DOI] [PMC free article] [PubMed] [Google Scholar]
- 9. Campanella M., Casswell E., Chong S., Farah Z., Wieckowski M. R., Abramov A. Y., Tinker A., Duchen M. R. (2008) Regulation of mitochondrial structure and function by the F1Fo-ATPase inhibitor protein, IF1. Cell Metab. 8, 13–25 [DOI] [PubMed] [Google Scholar]
- 10. Buzhynskyy N., Sens P., Prima V., Sturgis J. N., Scheuring S. (2007) Rows of ATP synthase dimers in native mitochondrial inner membranes. Biophys. J. 93, 2870–2876 [DOI] [PMC free article] [PubMed] [Google Scholar]
- 11. García J. J., Morales-Ríos E., Cortés-Hernandez P., Rodríguez-Zavala J. S. (2006) The inhibitor protein (IF1) promotes dimerization of the mitochondrial F1Fo-ATP synthase. Biochemistry 45, 12695–12703 [DOI] [PubMed] [Google Scholar]
- 12. Strauss M., Hofhaus G., Schröder R. R., Kühlbrandt W. (2008) Dimer ribbons of ATP synthase shape the inner mitochondrial membrane. EMBO J. 27, 1154–1160 [DOI] [PMC free article] [PubMed] [Google Scholar]
- 13. Campanella M., Seraphim A., Abeti R., Casswell E., Echave P., Duchen M. (2009) IF1, the endogenous regulator of the F1Fo-ATP synthase, defines mitochondrial volume fraction in HeLa cells by regulating autophagy. Biochim. Biophys. Acta 1787, 393–401 [DOI] [PubMed] [Google Scholar]
- 14. De los Rios Castillo D., Zarco-Zavala M., Olvera-Sanchez S., Pardo J. P., Juarez O., Martinez F., Mendoza-Hernandez G., García-Trejo J. J., Flores-Herrera O. (2011) Atypical cristae morphology of human syncytiotrophoblast mitochondria: Role for complex V. J. Biol. Chem. 286, 23911–23919 [DOI] [PMC free article] [PubMed] [Google Scholar]
- 15. Giraud M. F., Paumard P., Soubannier V., Vaillier J., Arselin G., Salin B., Schaeffer J., Brèthes D., di Rago J. P., Velours J. (2002) Is there a relationship between the supramolecular organization of the mitochondrial ATP synthase and the formation of cristae? Biochim. Biophys. Acta 1555, 174–180 [DOI] [PubMed] [Google Scholar]
- 16. Minauro-Sanmiguel F., Wilkens S., García J. J. (2005) Structure of dimeric mitochondrial ATP synthase: Novel Fo bridging features and the structural basis of mitochondrial cristae biogenesis. Proc. Natl. Acad. Sci. U.S.A. 102, 12356–12358 [DOI] [PMC free article] [PubMed] [Google Scholar]
- 17. Paumard P., Vaillier J., Coulary B., Schaeffer J., Soubannier V., Mueller D. M., Brèthes D., di Rago J. P., Velours J. (2002) The ATP synthase is involved in generating mitochondrial cristae morphology. EMBO J. 21, 221–230 [DOI] [PMC free article] [PubMed] [Google Scholar]
- 18. Wittig I., Meyer B., Heide H., Steger M., Bleier L., Wumaier Z., Karas M., Schägger H. (2010) Assembly and oligomerization of human ATP synthase lacking mitochondrial subunits a and A6L. Biochim. Biophys. Acta 1797, 1004–1011 [DOI] [PubMed] [Google Scholar]
- 19. Dienhart M., Pfeiffer K., Schagger H., Stuart R. A. (2002) Formation of the yeast F1Fo-ATP synthase dimeric complex does not require the ATPase inhibitor protein, Inh1. J. Biol. Chem. 277, 39289–39295 [DOI] [PubMed] [Google Scholar]
- 20. Tomasetig L., Di Pancrazio F., Harris D. A., Mavelli I., Lippe G. (2002) Dimerization of F1Fo-ATP synthase from bovine heart is independent from the binding of the inhibitor protein IF1. Biochim. Biophys. Acta 1556, 133–141 [DOI] [PubMed] [Google Scholar]
- 21. Pallotti F., Lenaz G. (2007) Isolation and subfractionation of mitochondria from animal cells and tissue culture lines. Methods Cell Biol. 80, 3–44 [DOI] [PubMed] [Google Scholar]
- 22. Fujikawa M., Yoshida M. (2010) A sensitive, simple assay of mitochondrial ATP synthesis of cultured mammalian cells suitable for high-throughput analysis. Biochem. Biophys. Res. Commun. 401, 538–543 [DOI] [PubMed] [Google Scholar]
- 23. Ohsakaya S., Fujikawa M., Hisabori T., Yoshida M. (2011) Knockdown of DAPIT (diabetes-associated protein in insulin-sensitive tissue) results in loss of ATP synthase in mitochondria. J. Biol. Chem. 286, 20292–20296 [DOI] [PMC free article] [PubMed] [Google Scholar]
- 24. Dubois M., Gilles K., Hamilton J. K., Rebers P. A., Smith F. (1951) A colorimetric method for the determination of sugars. Nature 168, 167. [DOI] [PubMed] [Google Scholar]
- 25. Imamura H., Huynh Nhat K., Togawa H., Saito K., Iino R., Kato-Yamada Y., Nagai T., Noji H. (2009) Visualization of ATP levels inside single living cells with fluorescence resonance energy transfer-based genetically encoded indicators. Proc. Natl. Acad. Sci. U.S.A. 106, 15651–15656 [DOI] [PMC free article] [PubMed] [Google Scholar]
- 26. Lu Y. M., Miyazawa K., Yamaguchi K., Nowaki K., Iwatsuki H., Wakamatsu Y., Ichikawa N., Hashimoto T. (2001) Deletion of mitochondrial ATPase inhibitor in the yeast Saccharomyces cerevisiae decreased cellular and mitochondrial ATP levels under non-nutritional conditions and induced a respiration-deficient cell-type. J. Biochem. 130, 873–878 [DOI] [PubMed] [Google Scholar]
- 27. Wittig I., Schägger H. (2008) Structural organization of mitochondrial ATP synthase. Biochim. Biophys. Acta 1777, 592–598 [DOI] [PubMed] [Google Scholar]
- 28. Mansour T. E., Ahlfors C. E. (1968) Studies on heart phosphofructokinase. Some kinetic and physical properties of the crystalline enzyme. J. Biol. Chem. 243, 2523–2533 [PubMed] [Google Scholar]