

Abstract
Disruption of sleep is a frequent complaint among elderly humans and is also evident in aged laboratory rodents. The neurobiological bases of age-related sleep/wake disruption are unknown. Given the critical role of the hypocretins in sleep/wake regulation, we sought to determine whether the wake-promoting effect of hypocretin changes with age in Wistar rats, a strain in which age-related changes in both sleep and hypocretin signaling have been reported. Intracerebroventricular infusions of hypocretin-1 (10 and 30 μg) significantly increased wake time relative to vehicle in both young (3 mos) and old (25 mos) Wistar rats. However, the magnitude and duration of the wake-promoting effect were attenuated with age. An increase of parameters associated with homeostatic sleep recovery after sleep deprivation, including non-rapid eye movement (NR) sleep time, NR delta power, the ratio of NR to rapid eye movement (REM) sleep, and NR consolidation, occurred subsequent to Hcrt-induced waking in young but not old rats. ICV infusions of hypocretin-2 (10 and 30 μg) produced fewer effects in both young and old rats. These data demonstrate that activation of a major sleep/wake regulatory pathway is attenuated in old rats.
1. Introduction
Disruption of sleep is a common complaint among elderly humans [Ballinger 1976; Bliwise, et al., 1992; Karacan, et al., 1976]. While sleep disruption is secondary to medical conditions in a significant portion of the aging population, even healthy aging is associated with reduced consolidation of sleep [Espiritu 2008]. The broad array of ill-effects that are associated with sleep disruption militate for a more thorough understanding of the mechanisms that underlie changes in sleep with aging.
The hypothalamic neuropeptides hypocretin-1 (Hcrt-1) and Hcrt-2 (also known as orexin-A and orexin-B), derived from a common prepro-peptide precursor [de Lecea, et al., 1998; Sakurai, et al., 1998], are key regulators of sleep and wakefulness [Sakurai 2007]. Hcrt-synthesizing cells project broadly to the forebrain and to mid- and hindbrain sites implicated in the regulation of wake and sleep. The Hcrt peptides act through two receptors, Hcrt receptor 1 (HcrtR1) and HcrtR2, to increase the excitability of postsynaptic targets. The importance of Hcrt signaling in maintaining sleep and wake consolidation is demonstrated by the effects of deficiencies in either Hcrt-synthesis or Hcrt receptor signaling. Hcrt-deficient human narcoleptics [Thannickal, et al., 2000], Hcrt cell- [Hara, et al., 2001] and gene [Chemelli, et al., 1999] knockout mice, and HcrtR2-deficient dogs [Lin, et al., 1999] exhibit a profound loss of sleep and wake state continuity (for review see [Sakurai 2007]). Reductions in Hcrt peptide levels and/or Hcrt cell loss has also been documented in a number of other neurological disorders characterized by sleep disruption, including Parkinson’s disease [Drouot, et al., 2003][Fronczek, et al., 2007; Thannickal, et al., 2007], Alzheimer’s disease [Friedman, et al., 2007] and Huntington’s disease [Petersen, et al., 2005][Aziz, et al., 2008]. Accordingly, the emergence of sub-clinical deficits in Hcrt signaling might contribute to the disruption of sleep and wake continuity that is seen with aging. We have previously found that mRNA for the HcrtR2 is significantly reduced in the pons, medulla, thalamus and hippocampus of aged mice [Terao, et al., 2002].
Intracerebroventricular (ICV) administration of Hcrt produces dose-dependent increases in waking and decreases in non-rapid eye movement sleep (NR) and rapid eye movement sleep (REM) [Huang, et al., 2001][Akanmu and Honda, 2005; Bourgin, et al., 2000; Espana, et al., 2001; Fujiki, et al., 2003; Piper, et al., 2000; Vogel, et al., 2002]. The wake-promoting effect of ICV Hcrt may thus be used as an indicator of the function of the Hcrt signaling system. Since we [Terao, et al., 2002] and others [Porkka-Heiskanen, et al., 2004] have observed reductions in Hcrt receptor expression in the aged rodent brain, we hypothesized that aged animals would have a blunted response to the wake-promoting effects of Hcrt peptides. In the current study, we investigated the effects of Hcrt-1 and Hcrt-2 infusion on the sleep-wake patterns of old and young Wistar rats, a strain known to exhibit disruption of sleep with aging [Clement, et al., 2003; Schiffelholz and Lancel, 2001]. Our data confirm the wake-promoting effects of ICV Hcrt in young rats and indicate that this effect of Hcrt-1 infusion on behavioral arousal is significantly blunted in aged Wistar rats.
2. Materials and Methods
2.1. Animals and Surgical Procedures
Thirteen male aged (25 mo, a gift from Roche Palo Alto LLC) and 7 young (3 mo, Charles River, Wilmington, MA) Wistar rats were maintained on a 12/12 LD cycle in a temperature-controlled recording room (23±1°C) with food and water available ad libitum. All experimental procedures complied with institutional animal care and use committee regulations at SRI International and National Institutes of Health guidelines for the care and use of experimental animals.
Animals were implanted for continuous electroencephalograph (EEG) and electromyograph (EMG) recordings. Four stainless steel screws (#000) were screwed into the skull and served as epidural EEG electrodes. Electrodes were placed bilaterally at 1 mm anterior to bregma, 2 mm lateral and 5 mm posterior to bregma, 4 mm lateral. Multistranded twisted stainless steel wire electrodes were sutured bilaterally in the neck muscles for EMG recording. The electrodes were connected to a 6-pin plug (363-plug, Plastics One, Roanoke, VA) and cemented to the skull with dental acrylic. Animals were also implanted with an infusion cannula into the lateral ventricle (with a level skull from bregma: 1.2mm posterior, 2.0 mm lateral and 3.2 mm ventral). Histological examination revealed that the cannulae for 3 aged and 3 young rats were implanted into the parenchyma and missed the lateral ventricle. The data from these rats were not included in the analyses and, consequently, the results reported below are derived from 10 aged rats and 4 young rats.
2.2. Experimental Design and Recording Procedures
For sleep recordings, animals were connected via a cable and a counterbalanced commutator to a Neurodata model 15 data collection system (Grass-Telefactor, West Warwick, RI). Rats were connected to the recording system at least 24 h before recording to allow for acclimation and remained connected throughout the experimental period. EEG and EMG signals were digitized and stored on a computer using VitalRecorder software (Kissei Comtec, Nagano, Japan). Employing a counterbalanced repeated measures design, each rat was infused with 10 and 30 μg of Hcrt-1 and saline vehicle at the beginning of the light period (ZT0). Infusions were performed using an UltraMicroPump II (World Precision Instruments, Sarasota, FL). Following the Hcrt-1 infusions, a second series of infusions for 10 and 30 μg of Hcrt-2 and saline control was performed. Since the rats were connected to the recording system during the infusion, light sedation was induced using 60% CO2/40% O2 to facilitate the introduction of the infusion cannula. A total volume of 0.5 μl was administered over 60 s. The infusion cannula remained inserted in the guide cannula for a minimum of 60 s following the infusion. EEG and EMG were recorded for 24 h after each treatment. A minimum of three days lapsed between infusions.
2.3. Data Analyses
Expert scorers determined states of sleep and wakefulness in 10 s epochs by examining the recordings visually using SleepSign software (Kissei Comtec, Nagano, Japan). Data were analyzed to determine the latency to the first consecutive 60 s of sleep. Hourly percent time in wake (W), REM, and NR and hourly NR:REM ratios were calculated as well as cumulative time in W, NR and REM. Measures of sleep/wake consolidation included hourly average bout duration and the number of bouts for W, NR and REM. A “bout” consisted of a minimum of two consecutive 10 s epochs of a given state and ended with any single epoch of a different state. Spectral analysis of the EEG (0.25–30 Hz) was performed using a fast Fourier transformation. The power in the delta range (0.75–3.75 Hz) during NR (NRD) was calculated from all artifact-free epochs of NR.
2.4 Statistics
For statistical comparisons, sleep latency data were analyzed using one-way repeated-measures ANOVA; all other data were analyzed using two-way repeated-measures ANOVA. Since we predicted a treatment effect that changed over time, we analyzed both the treatment effect (factor A) and time (factor B) within each rat and the time × treatment effect within each rat. When ANOVA indicated statistical significance in a time × treatment interaction, post hoc test (Fisher’s LSD) were performed to determine which groups differed within each hourly interval. When ANOVA indicated statistical significance for either time or overall condition effects, 2-tailed t-tests were performed to determine which conditions differed across the recording period.
3. Results
3.1. Hcrt-1 infusion has a more robust wake-promoting effect in young than old rats
3.1.1. Sleep Latency and Hourly Distribution of Arousal States
3.1.1.1 Latency to Sleep Onset
Latency to sleep onset subsequent to Hcrt-1 infusion was significantly affected by treatment in both young and old rats (F2,9=56.44, p<0.0001 for young and F2,27=6.45, p=0.0051 for old; Figure 1A). While latency to sleep onset was significantly increased by 10 and 30 μg Hcrt-1 infusions relative to vehicle infusion for both young and old rats, the effect was considerably blunted in the old rats compared to the young rats. Latency to sleep onset was significantly shorter for old rats for both the 10 and 30 μg conditions compared to the young rats (F1,12=55.69, P<0.0001 and F1,12=23.47, P=0.0004 respectively; Figure 1A).
Figure 1.
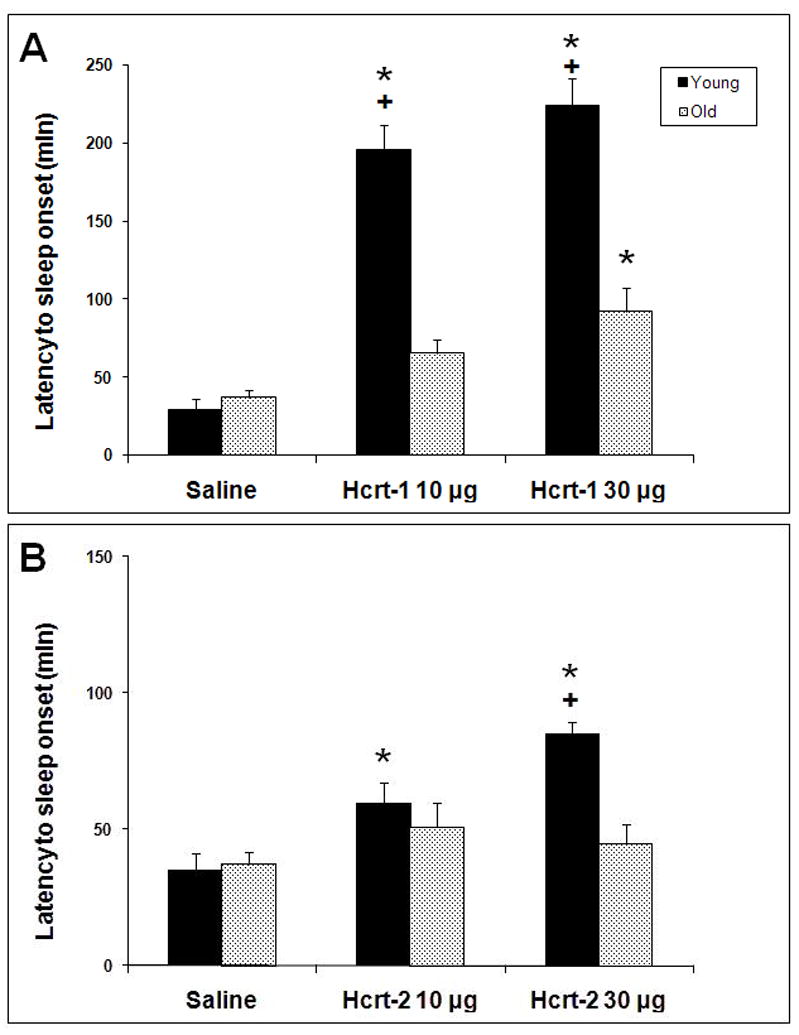
Latency to sleep onset following ICV infusion of saline, 10 μg and 30 μg of Hcrt-1 (top panel) and Hcrt-2 (bottom panel) at ZT0. * = p<0.05 for post-hoc comparison of Hcrt-1 and Hcrt-2 treatments relative to vehicle. + = P<0.05 young vs. old at the same dose.
3.1.1.2. W as a percentage of time
In young rats, a significant time × treatment effect for W as a percentage of time was found following Hcrt-1 ICV infusion (F22,99= 12.24, P<0.0001; Figure 2A). 10 μg Hcrt-1 infusion elevated W during ZT2-ZT4, and 30 μg Hcrt-1 elevated W during ZT2-ZT5 relative to vehicle infusion. An overall condition effect was also found with both 10 and 30 μg conditions producing more W during the light period compared to vehicle (F2,9= 23.69, P=0.0003). However, a period of decreased W was found in both the 10 and 30 μg conditions during ZT8-ZT9 compared to saline.
Figure 2.

Average percent time spent in W, NR and REM in young and old rats following ICV infusions of saline, 10 μg and 30 μg of Hcrt-1. Panel A: W in young rats. Panel B: W in old rats. Panel C: NR in young rats. Panel D: NR in old rats. Panel E: REM in young rats. Panel F: REM in old rats; ANOVA not significant for REM in old rats. + = p<0.05 for 10 μg Hcrt-1 relative to vehicle; * = p<0.05 for 30 μg Hcrt-1 relative to vehicle.
In old rats, a significant time × treatment effect for W was also found after ICV infusion of Hcrt-1 but this effect was more modest than in young rats (F22,297=1.86, P=0.0118; Figure 2B). W was significantly greater for the 10 μg dose only during ZT2, and for the 30 μg dose only during ZT2-ZT3. Thus, the duration of the wake-promoting effect of Hcrt-1 at either 10 or 30 μg was greater in young than old rats. In addition, the decrease in W during the second half of the light period was absent in old rats.
3.1.1.3. NR as a percentage of time
A significant time × treatment effect for NR as a percentage of time was found following ICV Hcrt-1 infusion in young rats (F22,99=14.43, P<0.0001; Figure 2C). Concomitant with increased W, 10 μg Hcrt-1 infusion suppressed NR time during ZT2-ZT4 and 30 μg Hcrt-1 suppressed NR time during ZT2-ZT5 relative to vehicle infusion. An overall condition effect was also found with both 10 and 30 μg conditions producing less NR during the light period compared to vehicle (F2,9= 39.82; P<0.0001). However, a period of increased NR was found following both 10 and 30 μg conditions during the second half of the light period. Infusion of 10 μg Hcrt-1 produced increased NR during ZT6, ZT7 and ZT9 while 30 μg Hcrt-1 produced increased NR during ZT7-ZT9.
In old rats, a significant time × treatment effect for NR was also found after ICV infusion of Hcrt-1 but, as with W, the effect was more modest than in young rats NR (F22,297=2.06, P=0.0039; Figure 2D). NR was significantly reduced relative to vehicle for the 10 μg dose only during ZT2, and for the 30 μg dose only during ZT2-ZT3.
3.1.1.4. REM as a percentage of time
Hcrt-1 strongly suppressed REM in a time-dependent manner in young rats (time × treatment interaction F22,99=4.30, P<0.0001; Figure 2E). Both 10 and 30 μg Hcrt-1 infusion suppressed REM during ZT3-ZT7. An increase in REM was found during ZT8 following the 10 μg dose of Hcrt-1. No significant effects were found for REM time in old rats for either the 10 or 30 μg doses (Figure 2F).
3.1.2. ICV infusion of Hcrt-1 results in homeostatic responses in sleep timing, sleep waveforms and sleep consolidation in young rats
As noted above, Hcrt-1 had an acute wake-promoting effect that was much more robust in young rats relative to old rats. The timing and consolidation of sleep and changes in EEG spectra during NR were also measured and analyzed to determine whether a homeostatic response occurred as a consequence of Hcrt-induced waking.
3.1.2.1. Changes in W, NR and REM in the early light period vs. the late light period
Examination of W and NR as a percentage of each of the first two 6-hr intervals after infusion indicated a contrasting homeostatic response between young and old rats. While ANOVA indicated a significant time × treatment interaction for both W and NR in young rats (F2,9=26.05 P=0.0002 and F2,9=26.13, P=0.0002 respectively; Figure 3A and 3C) and old rats (F2,27=5.48, P=0.0101 and F2,27=5.841, P<0.0078 respectively; Figure 3B and 3D), this effect was blunted in old rats. In young rats, both 10 and 30 μg Hcrt-1 infusion was followed by increased W and decreased NR during the early light period and decreased W and increased NR during the late light period compared to vehicle, presumably representing a compensatory response to the prolonged wakefulness induced by Hcrt-1 infusion. For old rats, the more modest increase in W produced in the 30 μg Hcrt-1 condition during the early light period did not result in a compensatory response in the late light period. NR was decreased relative to saline following both 10 and 30 μg Hcrt-1 infusion in old rats during the early light period but no significant differences were found between conditions during the late light period. No significant differences were found in either young or old rats in W or NR during the subsequent early dark period compared to the late dark period (data not shown).
Figure 3.

6 hour cumulative time spent in W, NR and REM for the first 12 h following ICV infusions of saline, 10 μg and 30 μg of Hcrt-1 at ZT0. * = significantly different for saline, + = late period significantly different from early period for that condition, ▴= young significantly different from old (p < 0.05).
When comparing the effects on young rats to those of old rats, no differences were found in either W or NR in response to saline in either the early or late light periods. The effects of Hcrt-1 infusion, however, were contrasting. In young rats compared to old rats, both 10 and 30 μg Hcrt-1 infusions were followed by more W and less NR during early light period (F2,24=13.66, P=0.0001 and F2,24=15.20, P<0.0001 respectively) and less W and more NR during the late light period (F2,24=8.29, P=0.0018 and F2,24=8.08, P=0.0021, respectively). These data accentuate the extent to which a compensatory rebound during the late light period is found in young rats but is absent in old rats. No significant differences were found between young and old rats in W during the subsequent early dark period or late dark period (data not shown).
REM as a percentage of each of the first two 6-hr intervals after infusion was significantly different in young rats (F2,9= 8.54, P=0.0083; Figure 3E) but not in old rats (F2,27=1.94, P=0.164; Figure 3F). Despite the robust suppression of REM by Hcrt-1 infusion in young rats, REM was not elevated in hrs 7–12 post-infusion. Thus, the homeostatic increase in sleep time secondary to sleep loss was restricted to NR during hrs 7–12 post-infusion and present only in young rats. This dichotomy between NR and REM in young rats was reflected in the REM:NR ratio (Table 1). The REM:NR ratio was significantly modified by treatment (F2,9=4.39, P=0.0466; Table 1) and was significantly decreased during hrs 1–6 relative to vehicle infusion in young rats administered Hcrt-1 at either 10 or 30 μg but not significantly different during hrs 7–12. By contrast, the REM:NR ratio was unaffected by treatment in old rats (Table 1). A strong time effect, however, was found for both young and old rats. All conditions in both groups had increased REM:NR ratios during hrs 7–12 compared to hrs 1–6 (F1,2=61.831, P<0.0001 and F1,2 =74.071, P<0.0001 for young and old, respectively). These data indicate a strong circadian influence on REM expression where more REM is found during the second half of the light period relative to the total time asleep compared to the first half of the light period. This distribution of REM appears to be unaltered by Hcrt-1 infusion.
Table 1.
REM:NR ratio following Hcrt-1 infusion.
| Group | Time Period | Dose of Hcrt-1 (μg) | ||
|---|---|---|---|---|
| 0 | 10 | 30 | ||
| Young | Hrs 1–6 | 0.11±0.015 | 0.02±0.009*+ | 0.03±0.023*+ |
| Hrs 7–12 | 0.17±0.031▴ | 0.18±0.020▴ | 0.14±0.022▴ | |
| Hrs 13–19 | 0.24±0.017 | 0.28±0.024 | 0.27±0.023 | |
| Hrs 19–24 | 0.12±0.030▴ | 0.17±0.016▴ | 0.19±0.020▴ | |
| Old | Hrs 1–6 | 0.13±0.015 | 0.12±0.020 | 0.12±0.025 |
| Hrs 7–12 | 0.20±0.013▴ | 0.21±0.019▴ | 0.21±0.019▴ | |
| Hrs 13–19 | 0.20±0.013 | 0.22±0.019 | 0.25±0.019 | |
| Hrs 19–24 | 0.16±0.014▴ | 0.13±0.014▴ | 0.16±0.015▴ | |
p<0.05 relative to vehicle;
p<0.05 between age groups;
p<0.05 early vs. late light or dark period within age group.
Unlike W and NR, significant differences in REM were found during the subsequent dark period. REM as a percentage of each of the two 6-hr intervals after lights off was significantly influenced by time × treatment interaction in old rats but not in young rats (F2,25= 4.31, P=0.0246 and F2,9=0.13, P=0.884 respectively; data not shown). Old rats had increased REM during hrs 13–18 following 30 μg Hcrt-1 infusion compared to vehicle. For both young and old rats, a strong time effect was found (F1,2 = 41.59, P<0.0001 and F1,2 =32.92, P<0.0001 respectively; data not shown). For young rats, all three conditions had more REM during hrs 13–18 compared to hrs 19–24. For old rats, only the 10 and 30 μg Hcrt-1 infusion conditions had more REM during hrs 13–18 compared to hrs 19–24. This difference in REM amounts during the early dark period compared to the late dark period is accentuated by the REM:NR ratios. For both young and old rats, a significant time effect was found where all conditions in both groups had increased REM:NR ratios during hrs 13–18 compared to hrs 19–24 (F1,2 = 39.837, P<0.0001 and F1,2 =63.501, P<0.0001 respectively; Table 1).
3.1.2.2. NR EEG delta power
Slow oscillations (<5 Hz) predominated during NR in both young and old rats regardless of treatment, as indicated by spectral analysis of the NR EEG subsequent to infusion (Figure 4). While absolute NR delta power was roughly two-fold higher in young rats relative to old rats across all treatments (Figure 4; Figure 5A–B), relative NR delta power (delta power as a percentage of total spectral power) was equivalent between young and old rats following saline and represented ~20–35% of total EEG power (Figure 5C–D). The compensatory increase in NR in young rats during the second half of the light period following Hcrt-1 infusion described above was accompanied by increases in relative NR delta power compared to saline (F22,99= 2.54, P=0.0009). No differences were found in relative NR delta power in old rats (F22,297=0.87, P=0.6394). Relative NR delta power was elevated during ZT7-ZT12 following 30 μg Hcrt-1 and during ZT6, ZT7 and ZT9 following 10 μg Hcrt-1 in young rats compared to saline.
Figure 4.

NR EEG spectra (1–30 Hz) during hrs 1–6 following ICV infusions of saline, 10 μg and 30 μg of Hcrt-1 at ZT0 in young rats (left hand panels) old rats (right hand panel).
Figure 5.

Measures of EEG power in the delta range (0.75–3.75 Hz) during NR sleep following ICV infusions of saline, 10μg and 30μg of Hcrt-1 at ZT0. Panel A: Raw NR delta power in young rats. Panel B: Raw NR delta power in old rats. Panel C: NR delta power as a percentage of total EEG power in young rats. Panel D: NR delta power as a percentage of total EEG power in old rats. Panel E: NR delta power normalized to the average NR delta power after saline infusion in young rats. Panel F: NR delta power normalized to the average NR delta power after saline infusion in old rats. + = p<0.05 for 10 μg Hcrt-1 relative to vehicle; * = p<0.05 for 30 μg Hcrt-1 relative to vehicle.
Significant effects of treatment on absolute NR delta power were found in both young (F22,99=3.22, P=0.0001) and old rats (F22,297=1.83, P=0.0141; Figure 5A–B). Treatment also had significant effects on normalized NR delta power (to the 24 h average following saline in young (F22,99=4.19, P<0.0001) and old rats (F22,297=2.40, P=0.0006; Figure 5E-F). The effects, however, were opposite in young and old rats. In young rats, both absolute and normalized NR delta power was elevated following ICV Hcrt-1 infusion. Following 10 μg Hcrt-1, absolute NR delta power was increased during ZT6-ZT7 and ZT9 while normalized NR delta power was increased during ZT5-ZT9 relative to saline in young rats. ICV infusion of 30 μg Hcrt-1 produced increased absolute and normalized NR delta power during ZT7 and ZT9. Interestingly, 30 μg Hcrt-1 infusion was also followed by decreased absolute and normalized NR delta power during ZT4. In old rats, both absolute and normalized NR delta power were decreased following ICV Hcrt-1 infusion. ICV infusion of 30 μg Hcrt-1 produced decreased absolute NR delta power during ZT1-ZT3 and decreased normalized NR delta power during ZT2-ZT4 relative to saline in old rats. Following ICV infusion of 10 μg Hcrt-1 in old rats, both absolute and normalized NR delta power were decreased during ZT2. No significant effects for either young or old rats were found for any of the measures of NR delta power during the subsequent dark period (ZT13-ZT24).
3.1.2.3. Measures of sleep-wake consolidation
ICV infusion of Hcrt-1 was followed by an initial period of highly consolidated W. In young rats, W bout duration was dramatically increased for the first 3 hours following infusion of both 10 μg and 30 μg Hcrt-1 compared to saline (F22,99=17.50, P<0.0001; Figure 6A). W bout duration in old rats was increased during ZT1-ZT2 following 30 μg Hcrt-1 and during ZT1 following 10 μg Hcrt-1 compared to saline (F22,297 =4.06, P<0.0001; Figure 6B). Concurrently, the hourly number of W bouts was decreased during ZT1-ZT2 by both 10 μg and 30 μg Hcrt-1 in young rats compared to saline (F22,99=2.64, P=0.0006; data not shown). The hourly number of W bouts in old rats was not significantly affected (F22,297=0.84, P=0.6744; data not shown). The differential effect on the number of W bouts between age groups is further illustrated by examination of 6 h cumulative data (Table 2). While no significant difference in the number of W bouts between young and old was found following saline, both 10 μg and 30 μg Hcrt-1 was followed by fewer W bouts in young rats compared to old rats (F1,12=18.81, P=0.001 and F1,12=14.28, P=0.0026, respectively). Additionally, a strong time effect was found for both age groups where young and old rats experienced a greater number of W bouts during the late light period compared to the early light period in all three conditions (for young rats F1,9=80.483, P<0.0001; for old rats F1,27=28.937, P<0.0001).
Figure 6.

Average bout duration (BD) during W, NR and REM in young and old rats. Panel A: WBD in young rats. Panel B: WBD in old rats. Panel C: NRBD in young rats. Panel D: NRBD in old rats. Panel E: RBD in young rats. Panel F: RBD in old rats. + = p<0.05 for 10 μg Hcrt-1 relative to vehicle; * = p<0.05 for 30 μg Hcrt-1 relative to vehicle.
Table 2.
Numbers of W, NR and REM bouts following Hcrt-1 infusion.
| Parameter | Group | Time Period | Dose of Hcrt-1 (μg) | ||
|---|---|---|---|---|---|
| 0 | 10 | 30 | |||
| Number of W bouts | |||||
| Young | Hrs 1–6 | 92.25±4.39 | 73.40±5.13+ | 77.64±4.84+ | |
| Hrs 7–12 | 138.25±10.23▴ | 132.25±11.93▴ | 122±3.24▴ | ||
| Old | Hrs 1–6 | 118.56±7.57 | 110.51±5.03 | 110.6±5.08 | |
| Hrs 7–12 | 138.8±6.50▴ | 126.9±4.23▴ | 131.1±5.29▴ | ||
| Number of NR bouts | |||||
| Young | Hrs 1–6 | 92.5±4.6 | 73.2±4.3+ | 77.4±4.8+ | |
| Hrs 7–12 | 139.0±10.5▴ | 132.8±11.7▴ | 123.0±3.2▴ | ||
| Old | Hrs 1–6 | 118.6±7.5 | 110.3±5.0 | 110.5±5.0 | |
| Hrs 7–12 | 139.6±6.1▴ | 127.7±4.1▴ | 131.4±5.0▴ | ||
| Number of REM bouts | |||||
| Young | Hrs 1–6 | 14.5±2.3+ | 2.0±1.4*+ | 2.3±1.7*+ | |
| Hrs 7–12 | 21.0±4.6+ | 28.0±2.1*+▴ | 20.8±2.9+▴ | ||
| Old | Hrs 1–6 | 24.7±1.8 | 21.1±3.9 | 18.6±4.1 | |
| Hrs 7–12 | 33.4±1.3▴ | 36.8±2.2▴ | 37.5±3.7 | ||
p<0.05 relative to vehicle;
p<0.05 between age groups;
p<0.05 early vs. late light or dark period within age group.
For young rats, the reductions in NR and REM time following Hcrt-1 infusion were manifested through different aspects of sleep consolidation. ICV Hcrt-1 administration decreased hourly NR bout duration for ZT2-ZT5 compared to saline (F22,99=5.16, P<0.0001; Figure 6C) and the hourly number of NR bouts was decreased for ZT2-ZT3 (F22,99=2.80, P=0.002; data not shown). In contrast, REM bout duration was unchanged (F22,99=1.61, P=0.0589; Figure 6E) but the number of REM bouts was significantly decreased by both 10 μg and 30 μg Hcrt-1 infusion for the first 6 h of the light period (F2,9=10.28, P<0.0047; Table 2). Thus, while the decrease in NR occurred primarily by decreased NR bout duration, the robust suppression of REM was due to a decrease in the number of REM bouts.
In old rats, NR bout duration was decreased only following 30 μg Hcrt-1 infusion and only during ZT2-ZT3 (F22,297 =1.635, P=0.038; Figure 6D). No significant effects were found in the hourly number of NR bouts (F22,297 =0.84, P=0.6667; data not shown) or in the 6 h totals of NR bouts (F2,27=0.12, P=0.8851; Table 2). Corresponding with the marked lack of change in REM time described above in old rats, no significant effects were found in either REM bout duration (F22,297 =0.81, P=0.7098; Figure 6F) or in the number of REM bouts (F2,27=3.03, P=0.0651; Table 2). However, in both young and old rats a strong time effect was found for both the number of NR bouts (for young F1,2=83.57, P<0.0001 and for old F1,2=31.39, P<0.0001; Table 2) and the number of REM bouts (for young F1,2=92.02, P<0.0001 and for old F1,2=69.28, P<0.0001; Table 2). For young and old rats, the number of NR and REM bouts was greater during the late light period compared to the early light period, indicating a more fragmented sleep-wake pattern during the late light period.
3.2 Infusion of 10 and 30 μg Hcrt-2 has small effects on sleep parameters
In contrast to Hcrt-1, ICV Hcrt-2 at 10 or 30 μg had a modest effect or no effect on the parameters measured in this study. As seen in Figure 1, Hcrt-2 at 10 and 30 μg increased latency to sleep onset in young rats (F2,6=9.23, P<0.0147) but not in old rats (F2,21=0.968, P=0.3960). This effect in young rats, however, was small relative to Hcrt-1 infusion. Similarly, only small effects on W, NR and REM were found following Hcrt-2 infusion (Figure 7). Following Hcrt-2 ICV infusion in young rats, a significant time × treatment effect was found for W (F22,88= 3.18, P<0.0001), NR (F22,88= 4.25, P<0.0001) and REM (F22,88= 2.18, P=0.0056). W was increased and NR decreased during ZT2 following Hcrt-2 administration for both concentrations compared to vehicle. NR was also significantly increased following Hcrt-2 at 30 μg during ZT3. REM was significantly decreased during ZT3-ZT6 following Hcrt-2 at 30 μg. The strong REM suppression found in young rats following Hcrt-2 at 30 μg during the first half of the light period combined with a modest effect on NR is evident by the significant decrease in REM:NR ratio (F2,8=6.18, P=0.0239; Table 3).
Figure 7.

Average percent time spent in W, NR and REM in young and old rats following ICV infusions of saline, 10 μg and 30 μg of Hcrt-2 at ZT0. Panel A: W in young rats. Panel B: W in old rats. Panel C: NR in young rats. Panel D: NR in old rats. Panel E: REM in young rats. Panel F: REM saline in old rats. + = p<0.05 for 10 μg Hcrt-2 relative to vehicle; * = p<0.05 for 30 μg Hcrt-2 relative to vehicle.
Table 3.
REM:NR ratio following Hcrt-2 infusion.
| Group | Time Period | Dose of Hcrt-2 (μg) | ||
|---|---|---|---|---|
| 0 | 10 | 30 | ||
| Young | Hrs 1–6 | 0.12±0.004 | 0.12±0.014 | 0.02±0.003* |
| Hrs 7–12 | 0.18±0.020▴ | 0.18±0.023▴ | 0.18±0.030▴ | |
| Old | Hrs 1–6 | 0.12±0.019 | 0.11±0.015 | 0.09±0.015 |
| Hrs 7–12 | 0.21±0.023▴ | 0.18±0.023▴ | 0.21±0.030▴ | |
p<0.05 relative to vehicle;
p<0.05 between age groups;
p<0.05 early vs. late light or dark period within age group.
Similarly to Hcrt-1, the decrease in REM following Hcrt-2 infusion at 30 μg occurred primarily through a decrease in the number of REM bouts. The number of REM bouts was significantly decreased by 30 μg Hcrt-2 infusion for the first 6 h of the light period (F2,8=9.14, P<0.0086; Table 4) while REM bout duration was not significantly changed (F2,8=3.17, P=0.0909; data not shown). No other significant effects on measures of sleep-wake consolidation were found following Hcrt-2 infusion. However, strong diurnal effects were found following Hcrt-2 infusion (see Table 3 and Table 4). These diurnal effects parallel those described following Hcrt-1 infusion and appear to be independent of condition.
Table 4.
Numbers of W, NR and REM bouts following Hcrt-2 infusion.
| Parameter | Group | Time Period | Dose of Hcrt-2 (μg) | ||
|---|---|---|---|---|---|
| 0 | 10 | 30 | |||
| Number of W bouts | |||||
| Young | Hrs 1–6 | 120.49±8.60 | 95.68±8.58 | 140.55±15.36 | |
| Hrs 7–12 | 178.0 ±12.20▴ | 148.0±8.83▴ | 173.33±9.45▴ | ||
| Old | Hrs 1–6 | 120.50±10.60 | 110.87±3.68 | 119.67±6.19 | |
| Hrs 7–12 | 156.36±4.91▴ | 154.78±9.79▴ | 141.75±6.28▴ | ||
| Number of NR bouts | |||||
| Young | Hrs 1–6 | 120.74±8.60 | 93.66±8.56 | 140.21±15.36 | |
| Hrs 7–12 | 179.0±12.35▴ | 148.25±8.62▴ | 173.67±9.93▴ | ||
| Old | Hrs 1–6 | 119.24±10.47 | 110.37±3.5 | 118.64±6.11 | |
| Hrs 7–12 | 153.0±4.33▴ | 153.9±10.03▴ | 140.75±6.10▴ | ||
| Number of REM bouts | |||||
| Young | Hrs 1–6 | 17.28±3.83 | 12.76±0.70 | 3.02±0.50*+ | |
| Hrs 7–12 | 18.75±1.89 | 25.0±4.02▴ | 24.67±2.75▴ | ||
| Old | Hrs 1–6 | 16.72±2.61 | 17.03±2.25 | 14.85±2.83 | |
| Hrs 7–12 | 27.50±2.07▴ | 27.18±3.11▴ | 28.25±3.91▴ | ||
p<0.05 relative to vehicle;
p<0.05 between age groups;
p<0.05 early vs. late light or dark period within age group.
4. Discussion
Sleep in the elderly is generally recognized as being of poorer quality than in younger adults [Ballinger 1976; Bliwise, et al., 1992; Karacan, et al., 1976]. Many of the aspects that characterize poor sleep in elderly humans, such as sleep fragmentation, reduced amplitude of the diurnal sleep/wake rhythm, and decrease in delta frequencies in the EEG (for review see [Espiritu 2008]), have been found in studies of aged rats [Li and Satinoff, 1995; Mendelson and Bergmann, 1999a; Mendelson and Bergmann, 1999b; Porkka-Heiskanen, et al., 2004; Rosenberg, et al., 1979; Shiromani, et al., 2000; Tani and Ishihara, 1988; van Gool and Mirmiran, 1983; Witting, et al., 1993; Zepelin, et al., 1972]. As an important arousal state regulator (for review see [Sakurai 2007]), the Hcrt system may underpin some changes in sleep associated with aging. The two Hcrt peptides derived from preprohypocretin (Hcrt-1 and Hcrt-2) are synthesized by a small group of cells in the lateral hypothalamus that project broadly to the cerebral cortex and subcortical wake regulatory areas [Peyron, et al., 1998] where the Hcrt peptides have excitatory effects [Akanmu and Honda, 2005; Bayer, et al., 2001; Bourgin, et al., 2000]. Hcrt peptides are known to induce wakefulness when administered intracerebroventricularly [Akanmu and Honda, 2005; Fujiki, et al., 2003; Piper, et al., 2000]. Here, we have shown that the wake-promoting effect of exogenously administered (ICV) Hcrt-1 is significantly attenuated with aging in a rat strain in which sleep becomes disrupted with age [Kirov and Moyanova, 2002].
In previous studies [Akimoto-Takano, et al., 2005][Takano, et al., 2004], the orexigenic effect of ICV Hcrt (1 and 3 nmol) seen in young Wistar rats is abolished with age (i.e., 25–27 mos; the same age as the old rats used in the current study). In one of those studies [Takano, et al., 2004], Hcrt-2 failed to induce feeding in either young or old rats, similar to our observation that Hcrt-2 fails to increase sleep latency. The current report thus replicates the age-dependent attenuation of Hcrt-1-dependent (likely HcrtR1-dependent) signaling in this rat strain using a distinct experimental endpoint. Furthermore, attenuation of Hcrt-1-dependent signaling with aging is not unique to the Wistar strain. Young (3 or 6 mos) Fischer F344 rats respond to 0.5, 1 or 2 nmol Hcrt-1 when administered intrahypothalamically by increasing food intake within the first hour of administration whereas feeding is markedly attenuated in old F344 rats and not detected until the second hour post-infusion [Kotz, et al., 2005].
Differences in the in vivo effects of ICV administration of Hcrt-1 and Hcrt-2 are often attributed to the relative affinities of these peptides to their receptors. The Hcrts are ligands for the endogenous Hcrt receptors HcrtR1/OX1R and HcrtR2/OX2R. Hcrt-1 is several fold more potent than Hcrt-2 as a ligand for HcrtR1, whereas HcrtR2 is activated by both peptides with roughly equal potency [Sakurai, et al., 1998]. The fact that Hcrt-2 had a blunted wake-promoting effect in this study relative to Hcrt-1 implicates the HcrtR1 in the wake-promoting effect of Hcrt. A more potent wake-promoting effect of Hcrt-1 compared to Hcrt-2 has also been found in young Sprague-Dawley rats (Vogel et al., 2002). Further, Jones et al. (2001) found that increased motor activity following ICV Hcrt-2 administration was blocked by the HcrtR1 antagonist SB-334867. Determination whether the wake-promoting effects of Hcrt-1 are mediated through HcrtR1 could be assessed by pretreatment with HcrtR1 antagonist SB-334867. However, if only an attenuation of the wake-promoting effects of Hcrt-1 were observed, it would be uncertain whether both HcrtR1 and HcrtR2 in the Hcrt-1 effect or whether the blockade of the HcrtR1 was simply incomplete. It is also possible that a difference in the kinetics of the Hcrts in the cerebrospinal fluid (CSF) underlies the difference in effect between the two peptides. It has been reported that ICV administration of Hcrt-1 (10 nmol) results in measurable increases in CSF levels for over 4 h while ICV administration of Hcrt-2 (10 nmol) results in no detectable increase in CSF levels of Hcrt-2 [Yoshida, et al., 2003]. Therefore, the differences in wake-promoting effects between Hcrt-1 and Hcrt-2 may be due to a more rapid degradation of the Hcrt-2 peptide in the CSF. Further studies are needed to determine whether receptor subtype or peptide stability is primarily responsible for the differential effects on wake-promotion by the Hcrt-1 and Hcrt-2 peptides.
The attenuation of Hcrt-1-mediated wakefulness in the current study may be due at least in part to decreased HcrtR expression in the aging Wistar rat brain. As assessed by Western blots, HcrtR1 is expressed at high levels in the hypothalami of young Wistar rats and significantly reduced in old animals (25–27 months) relative to young, while HcrtR2 is expressed at constitutively low levels in both young and old rats and does not decline with age [Takano, et al., 2004]. Reduced HcrtR expression appears to be a generalized phenomenon in aging rodents: HcrtR2 mRNA expression declines in the aging C57BL/6 mouse brain [Terao, et al., 2002]. Whether this phenomenon extends to normally aging humans will require the use of HcrtR-specific positron emission tomography (PET) ligands or post-mortem studies on HcrtR concentration in brain tissues from aging humans.
To the extent that expression of the Fos protein after Hcrt administration is a measure of Hcrt-induced neuronal activation, several regions of the aging rat brain emerge as possible candidate sites where age-related attenuation of Hcrt signaling occurs. Fos expression is elevated in the hypothalamic paraventricular nucleus and the rostral portion of the nucleus of the solitary tract of young and old animals alike 1 h after Hcrt-1 infusion into the lateral [Kotz, et al., 2005]. By contrast, Fos expression is elevated in the lateral hypothalamic/perifornical area, mediodorsal thalamus, bed nucleus of the stria terminalis, nucleus accumbens core and posterior hypothalamus of young rats only [Kotz, et al., 2005]. Because each of these latter areas has been reported to influence sleep and wake and is a target of Hcrt innervation [Peyron, et al., 1998], the loss of cellular activation by Hcrt-1 in any of these nuclei might contribute to aging-related attenuation of the waking response to Hcrt-1. It should also be noted that in aged cats, reduced Hcrt-immunostaining has been found in Hcrt-bearing terminals in the locus coeruleus [Zhang, et al., 2002] and, in aging rats, Hcrt expression is reduced at both the mRNA and peptide levels relative to young rats [Porkka-Heiskanen, et al., 2004]. Collectively, these data suggest several possible neurobiological mechanisms for reduced Hcrt signaling in the aging brain.
Young rats exhibited a constellation of changes resembling the homeostatic response to sleep deprivation after the wake-promoting effect of Hcrt-1 had waned -- increased delta power, increased NR as a percentage of time, and increased sleep bout duration. These data indicate that Hcrt-induced waking incurred a sleep loss that was consequential for subsequent sleep. Old rats failed to exhibit the same constellation of changes in the face of a significant increase in wake time caused by Hcrt-1. However, it cannot be concluded based on this observation that the sleep homeostat is disrupted with age. The fact that the old rats failed to exhibit those changes associated with homeostatic rebound from sleep loss (increased delta, increased NR and increased sleep consolidation) may simply be because the sleep loss incurred by ICV Hcrt-1 in old rats was of insufficient magnitude to induce a homeostatic response. Nonetheless, previous studies have demonstrated that other known neurobiological mediators of homeostatic sleep regulation, including adenosine [Meerlo, et al., 2004; Murillo-Rodriguez, et al., 2004], are disrupted with age in Wistar rats.
Regardless of any possible effects of Hcrt-1 on the sleep homeostat, the attenuation of the wake-promoting effect of Hcrt-1 and the consequent wake fragmentation in aging rats might be expected to exacerbate other age-related sleep deficits. Wake fragmentation prevents the buildup of sleep need that occurs during sustained waking and thus decreases the likelihood that sustained sleep will follow. The current result thus supports a possible role for reduced Hcrt-1 signaling as a source for sleep/wake deficits, particularly state fragmentation, with aging.
Acknowledgments
The authors would like to thank Judith Flores for her outstanding technical assistance during the data collect process for this study. We would also like to thank Daniel Valladao for his assistance with data processing and statistics checking. This work supported by NIH R01 AG02584.
Footnotes
Disclosure Statement
There are no actual or potential conflict of interests for any of the authors. The data contained in this manuscript have not been previously published and have not been submitted elsewhere.
Publisher's Disclaimer: This is a PDF file of an unedited manuscript that has been accepted for publication. As a service to our customers we are providing this early version of the manuscript. The manuscript will undergo copyediting, typesetting, and review of the resulting proof before it is published in its final citable form. Please note that during the production process errors may be discovered which could affect the content, and all legal disclaimers that apply to the journal pertain.
References
- Akanmu MA, Honda K. Selective stimulation of orexin receptor type 2 promotes wakefulness in freely behaving rats. Brain Res. 2005;1048(1–2):138–45. doi: 10.1016/j.brainres.2005.04.064. [DOI] [PubMed] [Google Scholar]
- Akimoto-Takano S, Sakurai C, Kanai S, Hosoya H, Ohta M, Miyasaka K. Differences in the appetite-stimulating effect of orexin, neuropeptide Y and ghrelin among young, adult and old rats. Neuroendocrinology. 2005;82(5–6):256–63. doi: 10.1159/000092754. [DOI] [PubMed] [Google Scholar]
- Aziz A, Fronczek R, Maat-Schieman M, Unmehopa U, Roelandse F, Overeem S, van Duinen S, Lammers GJ, Swaab D, Roos R. Hypocretin and melanin-concentrating hormone in patients with huntington disease. Brain Pathol. 2008 doi: 10.1111/j.1750-3639.2008.00135.x. [DOI] [PMC free article] [PubMed] [Google Scholar]
- Ballinger CB. Subjective sleep disturbance at the menopause. J Psychosom Res. 1976;20(5):509–13. doi: 10.1016/0022-3999(76)90015-5. [DOI] [PubMed] [Google Scholar]
- Bayer L, Eggermann E, Serafin M, Saint-Mleux B, Machard D, Jones B, Muhlethaler M. Orexins (hypocretins) directly excite tuberomammillary neurons. Eur J Neurosci. 2001;14(9):1571–5. doi: 10.1046/j.0953-816x.2001.01777.x. [DOI] [PubMed] [Google Scholar]
- Bliwise DL, King AC, Harris RB, Haskell WL. Prevalence of self-reported poor sleep in a healthy population aged 50–65. Soc Sci Med. 1992;34(1):49–55. doi: 10.1016/0277-9536(92)90066-y. [DOI] [PubMed] [Google Scholar]
- Bourgin P, Huitron-Resendiz S, Spier AD, Fabre V, Morte B, Criado JR, Sutcliffe JG, Henriksen SJ, de Lecea L. Hypocretin-1 modulates rapid eye movement sleep through activation of locus coeruleus neurons. J Neurosci. 2000;20(20):7760–5. doi: 10.1523/JNEUROSCI.20-20-07760.2000. [DOI] [PMC free article] [PubMed] [Google Scholar]
- Chemelli RM, Willie JT, Sinton CM, Elmquist JK, Scammell T, Lee C, Richardson JA, Williams SC, Xiong Y, Kisanuki Y, Fitch TE, Nakazato M, Hammer RE, Saper CB, Yanagisawa M. Narcolepsy in orexin knockout mice: molecular genetics of sleep regulation. Cell. 1999;98(4):437–51. doi: 10.1016/s0092-8674(00)81973-x. [DOI] [PubMed] [Google Scholar]
- Clement P, Gharib A, Cespuglio R, Sarda N. Changes in the sleep-wake cycle architecture and cortical nitric oxide release during ageing in the rat. Neuroscience. 2003;116(3):863–70. doi: 10.1016/s0306-4522(02)00761-3. [DOI] [PubMed] [Google Scholar]
- de Lecea L, Kilduff TS, Peyron C, Gao X, Foye PE, Danielson PE, Fukuhara C, Battenberg EL, Gautvik VT, Bartlett FS, 2nd, Frankel WN, van den Pol AN, Bloom FE, Gautvik KM, Sutcliffe JG. The hypocretins: hypothalamus-specific peptides with neuroexcitatory activity. Proc Natl Acad Sci U S A. 1998;95(1):322–7. doi: 10.1073/pnas.95.1.322. [DOI] [PMC free article] [PubMed] [Google Scholar]
- Drouot X, Moutereau S, Nguyen JP, Lefaucheur JP, Creange A, Remy P, Goldenberg F, d’Ortho MP. Low levels of ventricular CSF orexin/hypocretin in advanced PD. Neurology. 2003;61(4):540–3. doi: 10.1212/01.wnl.0000078194.53210.48. [DOI] [PubMed] [Google Scholar]
- Espana RA, Baldo BA, Kelley AE, Berridge CW. Wake-promoting and sleep-suppressing actions of hypocretin (orexin): basal forebrain sites of action. Neuroscience. 2001;106(4):699–715. doi: 10.1016/s0306-4522(01)00319-0. [DOI] [PubMed] [Google Scholar]
- Espiritu JR. Aging-related sleep changes. Clin Geriatr Med. 2008;24(1):1–14, v. doi: 10.1016/j.cger.2007.08.007. [DOI] [PubMed] [Google Scholar]
- Friedman LF, Zeitzer JM, Lin L, Hoff D, Mignot E, Peskind ER, Yesavage JA. In Alzheimer disease, increased wake fragmentation found in those with lower hypocretin-1. Neurology. 2007;68(10):793–4. doi: 10.1212/01.wnl.0000256731.57544.f9. [DOI] [PubMed] [Google Scholar]
- Fronczek R, Overeem S, Lee SY, Hegeman IM, van Pelt J, van Duinen SG, Lammers GJ, Swaab DF. Hypocretin (orexin) loss in Parkinson’s disease. Brain. 2007;130(Pt 6):1577–85. doi: 10.1093/brain/awm090. [DOI] [PubMed] [Google Scholar]
- Fujiki N, Yoshida Y, Ripley B, Mignot E, Nishino S. Effects of IV and ICV hypocretin-1 (orexin A) in hypocretin receptor-2 gene mutated narcoleptic dogs and IV hypocretin-1 replacement therapy in a hypocretin-ligand-deficient narcoleptic dog. Sleep. 2003;26(8):953–9. doi: 10.1093/sleep/26.8.953. [DOI] [PubMed] [Google Scholar]
- Hara J, Beuckmann CT, Nambu T, Willie JT, Chemelli RM, Sinton CM, Sugiyama F, Yagami K, Goto K, Yanagisawa M, Sakurai T. Genetic ablation of orexin neurons in mice results in narcolepsy, hypophagia, and obesity. Neuron. 2001;30(2):345–54. doi: 10.1016/s0896-6273(01)00293-8. [DOI] [PubMed] [Google Scholar]
- Huang ZL, Qu WM, Li WD, Mochizuki T, Eguchi N, Watanabe T, Urade Y, Hayaishi O. Arousal effect of orexin A depends on activation of the histaminergic system. Proc Natl Acad Sci U S A. 2001;98(17):9965–70. doi: 10.1073/pnas.181330998. [DOI] [PMC free article] [PubMed] [Google Scholar]
- Karacan I, Thornby JI, Anch M, Holzer CE, Warheit GJ, Schwab JJ, Williams RL. Prevalence of sleep disturbance in a primarily urban Florida County. Soc Sci Med. 1976;10(5):239–44. doi: 10.1016/0037-7856(76)90006-8. [DOI] [PubMed] [Google Scholar]
- Kirov R, Moyanova S. Distinct sleep-wake stages in rats depend differentially on age. Neurosci Lett. 2002;322(2):134–6. doi: 10.1016/s0304-3940(02)00096-4. [DOI] [PubMed] [Google Scholar]
- Kotz CM, Mullett MA, Wang C. Diminished feeding responsiveness to orexin A (hypocretin 1) in aged rats is accompanied by decreased neuronal activation. Am J Physiol Regul Integr Comp Physiol. 2005;289(2):R359–R66. doi: 10.1152/ajpregu.00717.2004. [DOI] [PubMed] [Google Scholar]
- Li H, Satinoff E. Changes in circadian rhythms of body temperature and sleep in old rats. Am J Physiol. 1995;269(1 Pt 2):R208–14. doi: 10.1152/ajpregu.1995.269.1.R208. [DOI] [PubMed] [Google Scholar]
- Lin L, Faraco J, Li R, Kadotani H, Rogers W, Lin X, Qiu X, de Jong PJ, Nishino S, Mignot E. The sleep disorder canine narcolepsy is caused by a mutation in the hypocretin (orexin) receptor 2 gene. Cell. 1999;98(3):365–76. doi: 10.1016/s0092-8674(00)81965-0. [DOI] [PubMed] [Google Scholar]
- Meerlo P, Roman V, Farkas E, Keijser JN, Nyakas C, Luiten PG. Ageing-related decline in adenosine A1 receptor binding in the rat brain: an autoradiographic study. J Neurosci Res. 2004;78(5):742–8. doi: 10.1002/jnr.20314. [DOI] [PubMed] [Google Scholar]
- Mendelson WB, Bergmann BM. EEG delta power during sleep in young and old rats. Neurobiol Aging. 1999a;20(6):669–73. doi: 10.1016/s0197-4580(99)00062-7. [DOI] [PubMed] [Google Scholar]
- Mendelson WB, Bergmann BM. Age-related changes in sleep in the rat. Sleep. 1999b;22(2):145–50. doi: 10.1093/sleep/22.2.145. [DOI] [PubMed] [Google Scholar]
- Murillo-Rodriguez E, Blanco-Centurion C, Gerashchenko D, Salin-Pascual RJ, Shiromani PJ. The diurnal rhythm of adenosine levels in the basal forebrain of young and old rats. Neuroscience. 2004;123(2):361–70. doi: 10.1016/j.neuroscience.2003.09.015. [DOI] [PubMed] [Google Scholar]
- Petersen A, Gil J, Maat-Schieman ML, Bjorkqvist M, Tanila H, Araujo IM, Smith R, Popovic N, Wierup N, Norlen P, Li JY, Roos RA, Sundler F, Mulder H, Brundin P. Orexin loss in Huntington’s disease. Hum Mol Genet. 2005;14(1):39–47. doi: 10.1093/hmg/ddi004. [DOI] [PubMed] [Google Scholar]
- Peyron C, Tighe DK, van den Pol AN, de Lecea L, Heller HC, Sutcliffe JG, Kilduff TS. Neurons containing hypocretin (orexin) project to multiple neuronal systems. J Neurosci. 1998;18(23):9996–10015. doi: 10.1523/JNEUROSCI.18-23-09996.1998. [DOI] [PMC free article] [PubMed] [Google Scholar]
- Piper DC, Upton N, Smith MI, Hunter AJ. The novel brain neuropeptide, orexin-A, modulates the sleep-wake cycle of rats. Eur J Neurosci. 2000;12(2):726–30. doi: 10.1046/j.1460-9568.2000.00919.x. [DOI] [PubMed] [Google Scholar]
- Porkka-Heiskanen T, Alanko L, Kalinchuk A, Heiskanen S, Stenberg D. The effect of age on prepro-orexin gene expression and contents of orexin A and B in the rat brain. Neurobiol Aging. 2004;25(2):231–8. doi: 10.1016/s0197-4580(03)00043-5. [DOI] [PubMed] [Google Scholar]
- Rosenberg RS, Zepelin H, Rechtschaffen A. Sleep in young and old rats. J Gerontol. 1979;34(4):525–32. doi: 10.1093/geronj/34.4.525. [DOI] [PubMed] [Google Scholar]
- Sakurai T, Amemiya A, Ishii M, Matsuzaki I, Chemelli RM, Tanaka H, Williams SC, Richardson JA, Kozlowski GP, Wilson S, Arch JR, Buckingham RE, Haynes AC, Carr SA, Annan RS, McNulty DE, Liu WS, Terrett JA, Elshourbagy NA, Bergsma DJ, Yanagisawa M. Orexins and orexin receptors: a family of hypothalamic neuropeptides and G protein-coupled receptors that regulate feeding behavior. Cell. 1998;92(4):573–85. doi: 10.1016/s0092-8674(00)80949-6. [DOI] [PubMed] [Google Scholar]
- Sakurai T. The neural circuit of orexin (hypocretin): maintaining sleep and wakefulness. Nat Rev Neurosci. 2007;8(3):171–81. doi: 10.1038/nrn2092. [DOI] [PubMed] [Google Scholar]
- Schiffelholz T, Lancel M. Sleep changes induced by lipopolysaccharide in the rat are influenced by age. Am J Physiol Regul Integr Comp Physiol. 2001;280(2):R398–403. doi: 10.1152/ajpregu.2001.280.2.R398. [DOI] [PubMed] [Google Scholar]
- Shiromani PJ, Lu J, Wagner D, Thakkar J, Greco MA, Basheer R, Thakkar M. Compensatory sleep response to 12 h wakefulness in young and old rats. Am J Physiol Regul Integr Comp Physiol. 2000;278(1):R125–33. doi: 10.1152/ajpregu.2000.278.1.R125. [DOI] [PubMed] [Google Scholar]
- Takano S, Kanai S, Hosoya H, Ohta M, Uematsu H, Miyasaka K. Orexin-A does not stimulate food intake in old rats. Am J Physiol Gastrointest Liver Physiol. 2004;287(6):G1182–7. doi: 10.1152/ajpgi.00218.2004. [DOI] [PubMed] [Google Scholar]
- Tani Y, Ishihara T. Changes in EEG associated with sleep-awake behavior in young adult versus aged adult Fischer-344 rats. Physiol Behav. 1988;44(3):389–92. doi: 10.1016/0031-9384(88)90042-x. [DOI] [PubMed] [Google Scholar]
- Terao A, Apte-Deshpande A, Morairty S, Freund YR, Kilduff TS. Age-related decline in hypocretin (orexin) receptor 2 messenger RNA levels in the mouse brain. Neurosci Lett. 2002;332(3):190–4. doi: 10.1016/s0304-3940(02)00953-9. [DOI] [PubMed] [Google Scholar]
- Thannickal TC, Moore RY, Nienhuis R, Ramanathan L, Gulyani S, Aldrich M, Cornford M, Siegel JM. Reduced number of hypocretin neurons in human narcolepsy. Neuron. 2000;27(3):469–74. doi: 10.1016/s0896-6273(00)00058-1. [DOI] [PMC free article] [PubMed] [Google Scholar]
- Thannickal TC, Lai YY, Siegel JM. Hypocretin (orexin) cell loss in Parkinson’s disease. Brain. 2007;130(Pt 6):1586–95. doi: 10.1093/brain/awm097. [DOI] [PMC free article] [PubMed] [Google Scholar]
- van Gool WA, Mirmiran M. Age-related changes in the sleep pattern of male adult rats. Brain Res. 1983;279(1–2):394–8. doi: 10.1016/0006-8993(83)90217-2. [DOI] [PubMed] [Google Scholar]
- Vogel V, Sanchez C, Jennum P. EEG measurements by means of radiotelemetry after intracerebroventricular (ICV) cannulation in rodents. J Neurosci Methods. 2002;118(1):89–96. doi: 10.1016/s0165-0270(02)00148-6. [DOI] [PubMed] [Google Scholar]
- Witting W, Mirmiran M, Bos NP, Swaab DF. Effect of light intensity on diurnal sleep-wake distribution in young and old rats. Brain Res Bull. 1993;30(1–2):157–62. doi: 10.1016/0361-9230(93)90053-e. [DOI] [PubMed] [Google Scholar]
- Yoshida Y, Fujiki N, Maki RA, Schwarz D, Nishino S. Differential kinetics of hypocretins in the cerebrospinal fluid after intracerebroventricular administration in rats. Neurosci Lett. 2003;346(3):182–6. doi: 10.1016/s0304-3940(03)00571-8. [DOI] [PubMed] [Google Scholar]
- Zepelin H, Whitehead WE, Rechtschaffen A. Aging and sleep in the albino rat. Behav Biol. 1972;7(7):65–74. doi: 10.1016/s0091-6773(72)80189-5. [DOI] [PubMed] [Google Scholar]
- Zhang JH, Sampogna S, Morales FR, Chase MH. Age-related changes in hypocretin (orexin) immunoreactivity in the cat brainstem. Brain Res. 2002;930(1–2):206–11. doi: 10.1016/s0006-8993(02)02240-0. [DOI] [PubMed] [Google Scholar]