Abstract
It is unknown how central neural activity produces the repetitive termination and restart of periodic breathing (PB). We hypothesized that inspiratory and expiratory neural activities would be greatest during the waxing phase and least during the waning phase. We analyzed diaphragmatic and medullary respiratory neural activities during PB in intact unanesthetized adult cats. Diaphragmatic activity was increased and phasic during the waxing phase and was decreased and tonic during the waning phase. Activity of expiratory (n=21) and inspiratory (n=40) neurons was generally increased and phasic during the waxing phase and was decreased and more tonic during the waning phase. During apneas associated with PB, diaphragmatic activity was silent and most, but not all, inspiratory cells were inactive whereas most expiratory cells decreased activity but remained tonically active. We suggest that reduced strength of reciprocal inhibition, secondary to reduced respiratory drive, allows for simultaneous tonic activity of inspiratory and expiratory neurons of the central pattern generator, ultimately resulting in central apnea.
Keywords: altitude, Cheyne-Stokes respiration, apnea, diaphragm
1.0 Introduction
Periodic breathing is commonly observed in sojourners at high altitudes during sleep and in patients with heart disease or sleep apnea (Berssenbrugge et al., 1983; Dempsey et al., 2010; Khoo et al., 1996; Weil, 2004). This pattern of breathing is characterized by waxing and waning tidal volumes that subsequently terminate in apnea. Understanding the mechanisms responsible for the transition from rhythmic breathing to hypopnea and/or apnea is important for understanding the pathogenesis of central sleep apnea. Indeed, the conditions that negatively affect the apneic threshold (e.g., poikilocapnic hypoxia, reduced cerebral blood flow, etc) and cause breathing to become unstable have been well characterized. Therefore, it is well known what conditions predispose one to ventilatory instability (Dempsey, 2005; Dempsey et al., 2010). Nonetheless, the central respiratory neural events responsible for transduction of the peripheral and central chemoreceptor drives into respiratory motor output that result in periodic breathing are not well characterized.
Central respiratory neural and diaphragmatic activities have been studied independently during periods of increased (hyperventilation) and during periods of decreased (apnea/hypopnea) drive. For example, during increased respiratory drive resulting from poikilocapnic hypoxia, inspiratory and postinspiratory-inspiratory diaphragmatic electromyographic (EMG) activities are increased and phasic (Lovering et al., 2003; Megirian et al., 1980; Smith et al., 1989b). Similarly, neural inspiratory and postinspiratory-inspiratory activities are also increased and phasic (Lovering et al., 2005). Conversely, during reduced respiratory drive resulting from mechanical hyperventilation, EMG activity is either reduced, tonic or absent (Bainton et al., 1978; Orem and Vidruk, 1998). Likewise, inspiratory and expiratory neural activities are also reduced, tonic or absent (Bainton and Kirkwood, 1979; Batsel, 1967; Orem and Vidruk, 1998). Accordingly, during periods of increased respiratory drive, diaphragmatic EMG and neural activities are increased and distinctly phasic, whereas during periods of low respiratory drive myographic and neural activities are reduced, tonic or absent.
Notwithstanding, medullary respiratory neural activity during the spontaneous termination and subsequent restart of breathing that defines periodic breathing is unknown. Understanding this complementary component of respiratory drive and its relationship to the pathophysiology of central apnea may provide a better understanding as to why and how periodic breathing occurs under such a variety of conditions (Dempsey et al., 2010). Thus, the aim of the current study was to determine the activity of the diaphragm and medullary respiratory neurons during periodic breathing in order to define the status of the respiratory system when this peculiar pattern of breathing is produced. Our focus was on breath-by-breath diaphragmatic and respiratory neuronal activity during the transitions from breathing to apnea and back to breathing. Based on previous work by our group and others, we hypothesized that the waxing phase would be the result of reciprocal patterns of activity in which all major categories of inspiratory and expiratory neurons participate with increased discharge rates. Furthermore, we hypothesized that the waning phase would be the result of a central state like that during hypocapnic apnea where all major categories of inspiratory and expiratory neurons are non-reciprocally related.
2.0 Materials and Methods
2.1 Animals
Six adult cats (3.1 – 5.3kg) were prepared for recordings of electroencephalographic (EEG), pontogeniculo-occipital (PGO), diaphragmatic electromyographic (EMG) activity and medullary respiratory neural activity. Tracheal fistulas were created and headcaps containing a connector for electrodes were attached to the animals’ skulls. The headcap contained also standoffs that were used to immobilize the animal’s head during recordings. The animals recovered from surgery for 1 month before experimentation. The Animal Care and Use Committee of Texas Tech University School of Medicine approved all surgical and experimental procedures. A previous publication describes fully the surgical and histological procedures, as well as techniques used for sleep recordings (Lovering et al., 2005).
2.2 Recording procedures and exposure to hypoxia
During recordings, the trachea was intubated with a 4.0 mm endotracheal tube that was attached to a Validyne pneumotachograph. Total dead space of the tracheal tube and pneumotachograph was 8 ml, which is approximately equal to the dead space of the upper airway in cat. Pressure level in the tube was measured using a volumetric pressure transducer. Tidal O2 and CO2 were measured with an O2 analyzer (Beckman OM-11) and infrared CO2 analyzer (Beckman LB-2), respectively. Tidal O2 and CO2 percentages, EEG, EMG and PGO activity, airflow and intratracheal pressures were recorded on paper (Astro-Med 9500) and on magnetic tape. Diaphragmatic activity was amplified with a Grass P511 amplifier set to pass frequencies from 0.3 to 30 kHz. The tape recorder speed was 3 3/4 ips which dependably records action potentials passed through Grass high impedance probes and p511 amplifiers set to pass frequencies between 300 and 10KHz. These recorded signals were then played back at 15 ips and digitized at 20KHz. As can be seen in the figures, these digitization rates provided digital records that allow good qualitative and quantitative discrimination of action potentials. Control conditions were obtained while animals spontaneously breathed room air in Lubbock, Texas (altitude 1000m). Once control conditions were obtained, animals breathed a hypoxic gas mixture (FIO2=0.10 – 0.13 O2 in N2). In this study, CO2 levels were allowed to decrease as a function of ventilation (poikilocapnic hypoxia). The cats breathed hypoxic gas for periods of time sufficient to obtain good recordings of periodic breathing in sleep and/or quiet wakefulness.
2.3 Recordings of medullary respiratory neurons
Medullary respiratory neurons were recorded in all of the cats during control and experimental conditions in 230 sessions over a period of 25 months. Only one penetration with the microelectrode was made during each session. Penetrations were defined by reference to a point on the head-restraint plate. Tungsten microelectrodes (impedances 1–10 MΩ) were used to record single medullary respiratory neurons. The microelectrodes were mounted in a hydraulic microdriver and driven through the cerebellum into the medulla. Signals were led to a high impedance probe (Grass HIP511) and via a preamplifier (Grass P511) to paper and tape recording devices. Cycle-triggered histograms and the signal strength and consistency of the respiratory component of the activity of a cell (η2 value) were determined for each cell during recording sessions. Procedures for constructing cycle-triggered histograms and calculating the η2 value of the activity of a cell have been published (Orem and Dick, 1983). η2 values assigned to cells were determined in NREM sleep during periods of eupnea.
2.4 Data analysis
Diaphragmatic activity, PGO activity, EEG activity and airflow were digitized from analog tape records at 1000 samples·s−1 using a Cambridge Electronic Designs (CED) acquisition board in conjunction with CED Spike2 (v4.10). Respiratory neural activity was digitized at 20000 samples·s−1. Diaphragmatic activity was defined as three separate phases: inspiratory, postinspiratory-inspiratory (first half of expiration) and tonic expiratory (second half of expiration) activities.
Respiratory neurons were classified as either inspiratory or expiratory based on when they discharged during NREM sleep in normoxic conditions in relation to airflow and diaphragmatic activity. Cells were classified further by their pattern of discharge during their respective phases as either decrementing, augmenting, throughout, late or phase spanning (Lovering et al., 2005). Decrementing neurons had peak activity during the first half of their respective phase and then progressively declined throughout the remaining phase. Augmenting neurons were those neurons that increased their activity gradually throughout their respective phase with peak activity in the later part of that phase. Throughout neurons were those with discharge rates that were relatively constant throughout their respective phases. Late neurons were those that began firing after the onset of their respective phase. Respiratory cells that were variably active within a given phase, were classified simply as inspiratory or expiratory. Respiratory neurons that began firing during expiration and continued into inspiration were classified as phase-spanning (PS E/I). Pre-inspiratory neurons were classified based on the descriptions of Richter and colleagues (Schwarzacher et al., 1995).
During episodes of breathing, without periodic breathing, mean interspike intervals and the standard deviation of the interspike intervals were determined for each cell during normoxia and hypoxia in NREM and REM sleep (Tables 1 & 2). Data from quiet wakefulness and NREM sleep were combined as NREM because the cats were relaxed and drowsy during wakefulness, and the EEG showed frequent episodes of light sleep interspersed with wakefulness. Alert, sustained wakefulness was infrequent. For classification of neurons and calculation of η2 values, we analyzed episodes of activity in W/NREM that contained consecutive breaths that were not interrupted by augmented breaths, swallows, movements, coughs and vocalization. Data reported specifically for periodic breathing were obtained only during periodic breathing in quiet wakefulness and NREM sleep. Discharge frequency histograms (200 ms bins) for respiratory neurons during periodic breathing were determined using Dataview (v3.7b). Comparisons of the mean neuron firing rates for inspiratory and expiratory neurons during periodic breathing were performed using a repeated measure ANOVA with Newman-Keuls post test. Significance was set to p<.05.
Table 1.
Activity of inspiratory neurons in normoxia and hypoxia during sleep
| NREM
|
REM
|
Hypoxia if other than 10% | |||||||||||
|---|---|---|---|---|---|---|---|---|---|---|---|---|---|
|
|
Normoxia
|
Hypoxia
|
|
Normoxia
|
Hypoxia
|
|
|||||||
| Cell | Classification | η2 | Interspike interval (ms) | n | Interspike interval (ms) | n | Direction of Change | Interspike interval (ms) | n | Interspike interval (ms) | n | Direction of Change | |
|
|
|
|
|
|
|
|
|
||||||
| SUMA 16 | Idec | 0.8 | 98 (260) | 792 | 74 (189)* | 846 | ↓ | --- --- | --- | --- --- | --- | --- | |
| STA 61 | Idec | 0.7 | 154 (318) | 136 | 117 (264) | 1089 | nc | --- --- | --- | --- --- | --- | --- | |
| SUMA 82 | Idec | 0.6 | 203 (550) | 408 | 110 (342)* | 2894 | ↓ | --- --- | --- | --- --- | --- | --- | |
| SUMA 33*1 | Idec | 0.3 | 140 (331) | 1579 | 100 (187)* | 676 | ↓ | --- --- | --- | --- --- | --- | --- | |
| GWAY 108*1 | Iaug | 0.9 | 28 (52) | 18258 | 24 (64)* | 5810 | ↓ | 28 (52) | 39465 | 28 (68) | 10097 | nc | |
| GWAY 100 | Iaug | 0.9 | 64 (244) | 1153 | 56 (208) | 1404 | nc | 36 (120) | 7764 | 32 (108) | 4603 | nc | |
| GWAY 56*1 | Iaug | 0.9 | 28 (40) | 11461 | 28 (36) | 12298 | nc | 20 (20) | 32502 | --- --- | --- | --- | |
| GWAY 135 | Iaug | 0.9 | 48 (164) | 9983 | 32 (148)* | 3134 | ↓ | 44 (132) | 16661 | 36 (124)* | 4929 | ↓ | |
| GWAY 136 | Iaug | 0.9 | 35 (160) | 7405 | 30 (148)* | 12887 | ↓ | --- --- | --- | --- --- | --- | --- | |
| SUMA 71*1 | Iaug | 0.9 | 41 (97) | 4751 | 31 (65)* | 5450 | ↓ | 23 (49) | 31903 | --- --- | --- | --- | |
| SUMA 64 | Iaug | 0.9 | 92 (321) | 1773 | 96 (308) | 1039 | nc | 72 (228) | 6021 | --- --- | --- | --- | |
| GWAY65 | Iaug | 0.8 | 120 (368) | 863 | 52 (208)* | 6439 | ↓ | 40 (108) | 24211 | 28 (108)* | 7112 | ↓ | |
| STA 65 | Iaug | 0.7 | 33 (40) | 2117 | 19 (22)* | 6028 | ↓ | --- --- | --- | --- --- | --- | --- | |
| SUMA 89*1 | Iaug | 0.7 | 148 (398) | 384 | 84 (252)* | 1408 | ↓ | 25 (112) | 16944 | --- --- | --- | --- | |
| STA 34*1 | Iaug | 0.7 | 64 (240) | 5040 | 73 (279) | 1814 | nc | 100 (300) | 3911 | --- --- | --- | --- | |
| GWAY 40*1 | Iaug | 0.7 | 108 (240) | 830 | 120 (296) | 880 | nc | 52 (128) | 12452 | 80 (176)* | 4753 | ↑ | |
| STA 50 | Iaug | 0.6 | 44 (163) | 546 | 66 (254) | 2544 | nc | --- --- | --- | --- --- | --- | --- | |
| GWAY 23 | Iaug | 0.6 | 97 (305) | 1360 | 96 (263) | 577 | nc | 51 (135) | 8946 | --- --- | --- | --- | |
| GWAY 137 | Iaug | 0.4 | 299 (564) | 651 | 183 (344)* | 1633 | ↓ | --- --- | --- | --- --- | --- | --- | |
| DOLY 131*1 | Iaug | 0.8 | 80 (149) | 3091 | 48 (76)* | 250 | ↓ | --- --- | --- | --- --- | --- | --- | 12% |
| GWAY 29 | Ithru | 0.9 | 80 (152) | 6555 | 44 (60)* | 9678 | ↓ | 68 (100) | 9497 | --- --- | --- | --- | |
| GWAY 69 | Ithru | 0.8 | 80 (220) | 897 | 60 (220)* | 1878 | ↓ | 64 (156) | 8339 | 48 (156)* | 5651 | ↓ | |
| GWAY 58 | Ithru | 0.8 | 92 (156) | 2565 | 52 (40)* | 7900 | ↓ | 116 (256) | 1142 | --- --- | --- | --- | |
| GWAY 1 | Ithru | 0.7 | 93 (32) | 1317 | 41 (12)* | 3326 | ↓ | 52 (23) | 7167 | 38 (19)* | 6713 | ↓ | |
| GWAY 43 | Ithru | 0.7 | 104 (192) | 10224 | 80 (128)* | 4032 | ↓ | 40 (64) | 4324 | --- --- | --- | --- | |
| GWAY 112 | Ithru | 0.6 | 34 (12) | 4170 | 40 (14)* | 10717 | ↑ | 16 (16) | 28411 | --- --- | --- | --- | 11% |
| SUMA 78 | Ithru | 0.6 | 48 (181) | 2097 | 98 (336)* | 1801 | ↑ | 51 (174) | 7566 | --- --- | --- | --- | |
| SUMA 47 | Ithru | 0.6 | 74 (211) | 2273 | 50 (146)* | 876 | ↓ | 186 (423) | 1480 | --- --- | --- | --- | |
| EDMN 21 | Ithru | 0.5 | 482 (783) | 339 | 788 (988)* | 200 | ↑ | 163 (295) | 549 | 296 (493)* | 383 | ↑ | |
| GWAY 130 | Ithru | 0.8 | 68 (208) | 1510 | 76 (204) | 4375 | nc | 32 (96) | 9308 | --- --- | --- | --- | |
| GWAY 36 | Late I | 0.7 | 188 (540) | 2712 | 124 (404)* | 4072 | ↓ | 104 (340) | 1612 | ---- ---- | ---- | ---- | |
| GWAY 68 | Late I | 0.7 | 312 (808) | 628 | 304 (768) | 744 | nc | ---- ---- | ---- | 52 (204) | 6757 | ---- | |
| GWAY 30 | Late I | 0.6 | 492 (873) | 588 | 291 (647)* | 1180 | ↓ | --- --- | --- | --- --- | --- | --- | 11% |
| GWAY 28 | Late I | 0.5 | 80 (212) | 2033 | 72 (196) | 10561 | nc | 40 (120) | 8580 | 44 (136) | 6603 | nc | |
| GWAY 134 | Late I | 0.4 | 540 (1140) | 179 | 1032 (1492)* | 764 | ↑ | 340 (1480) | 1055 | ---- ---- | ---- | ---- | |
| GWAY 82 | Late I | 0.2 | 148 (320) | 2743 | 56 (92)* | 7112 | ↓ | 44 (96) | 14770 | ---- ---- | ---- | ---- | |
| SUMA 36a*1 | Pre-I | 0.9 | 94 (291) | 668 | 36 (142)* | 1069 | ↓ | --- --- | --- | --- --- | --- | --- | |
| STA 53 | I cell | 0.4 | 192 (787) | 549 | 110 (258)* | 2011 | ↓ | --- --- | --- | --- --- | --- | --- | |
| SUMA 2 | I cell | 0.3 | 84 (123) | 1498 | 144 (250)* | 443 | ↑ | --- --- | --- | --- --- | --- | --- | 12.5% |
| STA 63 | I cell | 0.2 | 267 (505) | 413 | 192 (535)* | 1144 | ↓ | --- --- | --- | --- --- | --- | --- | |
Data are means & (S.D.), n = # of spikes, arrows indicate significant increase or decrease in hypoxia value compared to normoxia, nc = no significant change,
p<0.05;
neurons tonically active during wanning/apneic phase.
Table 2.
Activity of expiratory neurons in normoxia and hypoxia during sleep and wakefulness
| NREM
|
REM
|
Hypoxia if other than 10% | |||||||||||
|---|---|---|---|---|---|---|---|---|---|---|---|---|---|
|
|
Normoxia
|
Hypoxia
|
|
Normoxia
|
Hypoxia
|
|
|||||||
| Cell | Classification | η2 | Interspike interval (ms) | n | Interspike interval (ms) | n | Direction of Change | Interspike interval (ms) | n | Interspike interval (ms) | n | Direction of Change | |
|
|
|
|
|
|
|
|
|
||||||
| GWAY 37 | Edec | 0.7 | 104 (92) | 9356 | 112 (136)* | 6363 | ↑ | 124 (148) | 506 | ---- ---- | ---- | --- | |
| STA 57 | Edec | 0.7 | 124 (359) | 825 | 67 (173)* | 1713 | ↓ | ---- ---- | ---- | ---- ---- | ---- | --- | |
| STA 44 | Edec | 0.8 | 74 (169) | 1913 | 62 (95)* | 4279 | ↓ | 104 (227) | 3168 | ---- ---- | ---- | --- | 11% |
| STA 47*1 | Edec | 0.3 | 100 (198) | 1338 | 108 (252) | 1448 | nc | 548 (1373) | 704 | ---- ---- | ---- | --- | 11% |
| SUMA 74 | Edec | 0.1 | 173 (464) | 2840 | 400 (723)* | 217 | ↑ | 300 (464) | 123 | ---- ---- | ---- | --- | |
| SUMA 84*1 | Edec | 0.1 | 660 (2030) | 162 | 262 (481)* | 810 | ↓ | 6488 (14950) | 53 | ---- ---- | ---- | --- | |
| STA 42 | Eaug | 0.9 | 33 (128) | 7731 | 29 (96)* | 6465 | ↓ | 42 (136) | 10336 | ---- ---- | ---- | --- | |
| STA 45 | Eaug | 0.8 | 48 (156) | 1865 | 37 (123)* | 3076 | ↓ | 42 (112) | 9339 | ---- ---- | ---- | --- | |
| STA 56 | Eaug | 0.8 | 47 (111) | 1584 | 40 (101) | 997 | nc | ---- ---- | ---- | ---- ---- | ---- | --- | |
| GWAY 53 | Eaug | 0.7 | 40 (72) | 24041 | 32 (36)* | 10973 | ↓ | ---- ---- | ---- | ---- ---- | ---- | --- | |
| GWAY 20 | Eaug | 0.7 | 133 (289) | 1336 | 174 (420)* | 817 | ↑ | ---- ---- | ---- | 100 (287) | 1943 | --- | |
| GWAY 120 | Eaug | 0.7 | 96 (188) | 3914 | 64 (144)* | 3998 | ↓ | 100 (192) | 6602 | ---- ---- | ---- | --- | |
| STA 60 | Ethru | 0.9 | 49 (134) | 1073 | 34 (109)* | 1459 | ↓ | --- --- | --- | 29 (88) | 7829 | --- | |
| GWAY 128 | Ethru | 0.7 | 140 (280) | 2449 | 76 (192)* | 1339 | ↓ | 120 (268) | 2763 | --- --- | --- | --- | |
| STA 48 | Ethru | 0.6 | 47 (139) | 3651 | 44 (159) | 1957 | nc | 64 (200) | 4159 | --- --- | --- | --- | |
| ANGL 4a | LateE | 0.7 | 460 (889) | 257 | 229 (601)* | 169 | ↓ | ---- ---- | ---- | ---- ---- | ---- | --- | |
| GWAY 119a | LateE | 0.7 | 420 (896) | 1150 | 224 (936)* | 760 | ↓ | 484 (1720) | 1332 | ---- ---- | ---- | --- | |
| EDM 53 | LateE | 0.6 | 176 (295) | 2563 | 300 (457)* | 364 | ↑ | ---- ---- | ---- | 65 (72) | 10331 | --- | 13% |
| SUMA 55*1 | E cell | 0.2 | 156 (219) | 894 | 131 (294) | 735 | nc | --- --- | --- | --- --- | --- | --- | |
| DOLY 131a*1 | E cell | 0.1 | 92 (107) | 2697 | 28 (130)* | 437 | ↓ | ---- ---- | ---- | ---- ---- | ---- | --- | 12% |
| GWAY 111 | PS E-to-I | 0.2 | 248 (296) | 1091 | 164 (272)* | 2764 | ↓ | ---- ---- | ---- | ---- ---- | ---- | --- | 11% |
Data are means & (S.D.), n = # of spikes, arrows indicate significant increase or decrease in hypoxia value compared to normoxia, nc = no significant change,
p<0.05;
neurons more active during wanning/apneic phase.
3.0 Results
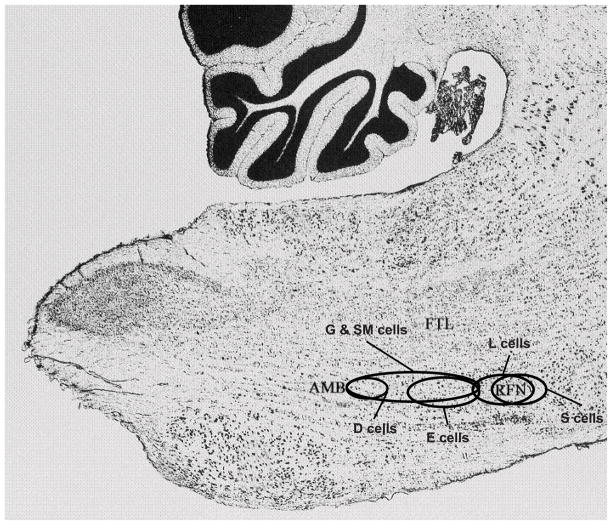
Sixty-one respiratory neurons were recorded during periodic breathing. These cells are a subset of 120 neurons that were studied during normoxia and hypoxia and were the subject of a previous publication that did not report any periodic breathing data (Lovering et al., 2005). Data for these 61 neurons recorded during episodes of non-periodic breathing in normoxia and hypoxia are reported in Tables 1 & 2. Some of the cells in these tables have been published previously (Lovering et al., 2005). The locations of the recorded neurons, as shown in Figure 1, were within the ventral respiratory group from the level of the retrofacial nucleus caudally to approximately 1 mm rostral to the obex. Forty inspiratory neurons were recorded: 16 augmenting inspiratory; 10 inspiratory throughout; 6 late inspiratory; 4 decrementing inspiratory; 1 pre inspiratory; and 3 low η2 inspiratory cells that did not demonstrate a clear pattern of activity within the inspiratory phase (Table 1). Twenty-one expiratory neurons were recorded: 6 augmenting expiratory; 6 decrementing expiratory; 3 expiratory throughout; 3 late expiratory; 2 low η2 expiratory cells that did not show a clear pattern within the expiratory phase; and 1 phase-spanning expiratory-inspiratory cell (Table 2).
Figure 1.
Locations of gliosis in 6 cats; (D)=DOLY, (E)=EDM, (G)=GWAY, (S)=STA, (SM)=SUMA & (L)=ANGL. AMB: nucleus ambiguus; FTL: lateral tegmental field; RFN: retrofacial nucleus; Micrograph is from plate 43 of Berman Atlas. By permission U. Wisc. Press.
3.1 Periodic breathing during and after hypoxia
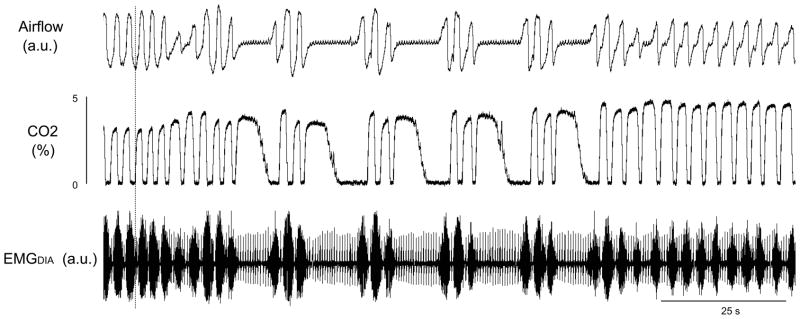
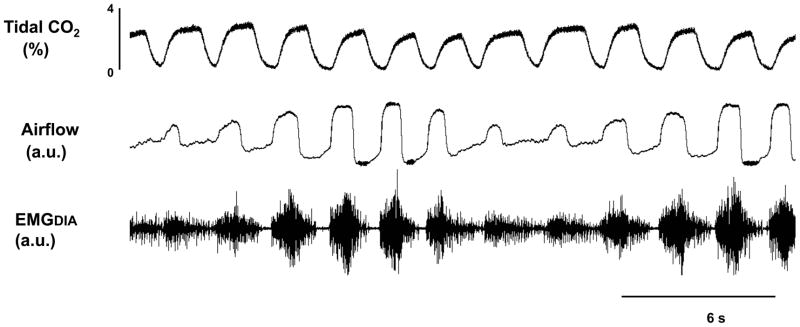
Sustained periodic breathing occurred infrequently while animals breathed hypoxic gas and apneas occurred occasionally after augmented breaths preceding periodic breathing. Periodic breathing occurred more often when the animals were switched to room air as a post-hypoxic ventilatory response, for example see Figure 2. During post-hypoxic periodic breathing, tidal volumes began to wane or an apnea occurred. Subsequent to the apnea or waning phase, periodic breathing ensued and continued until end tidal carbon dioxide levels returned to normal or near normal levels (Figure 2). Post-hypoxic periodic breathing occurred during both quiet wakefulness and NREM sleep. Periodic breathing did not occur in REM sleep in hypoxia and we did not attempt to elicit post-hypoxic periodic breathing during REM sleep. There were no qualitative differences between periodic breathing that occurred as a post-hypoxic response and that which occurred as a hypoxic response, e.g. compare Figures 2–4.
Figure 2.
Post-hypoxic periodic breathing in one animal (SM) Traces are tidal carbon dioxide percentage, airflow, and diaphragmatic electromyogram (EMGDIA), a.u. = arbitrary units.
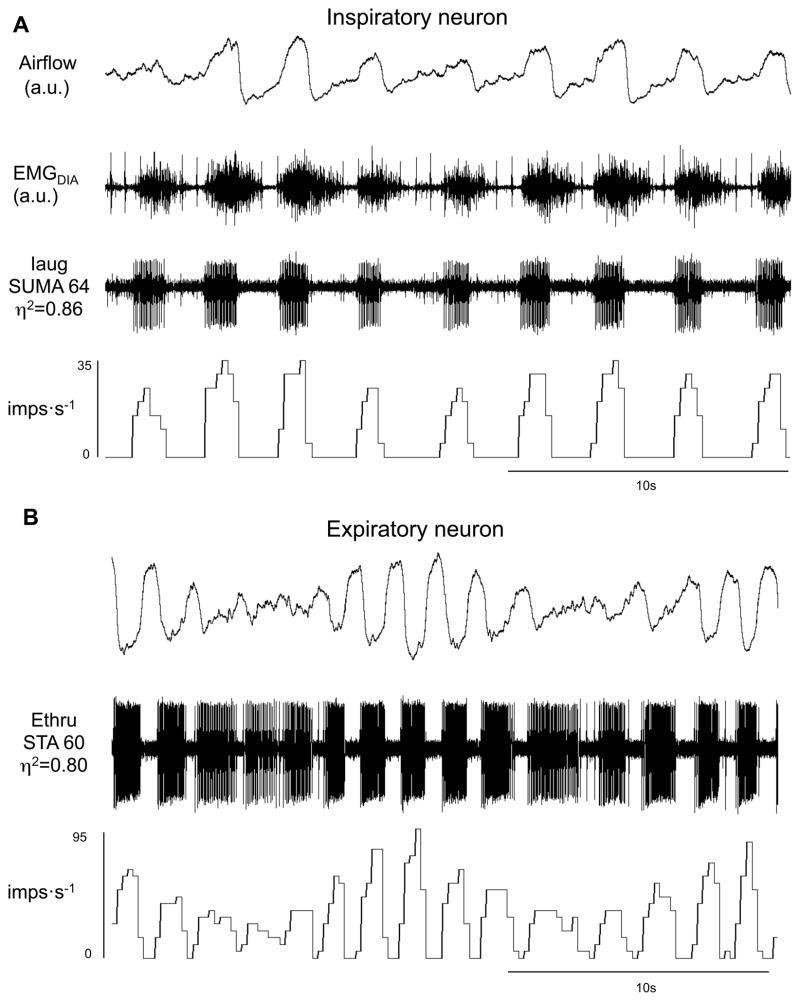
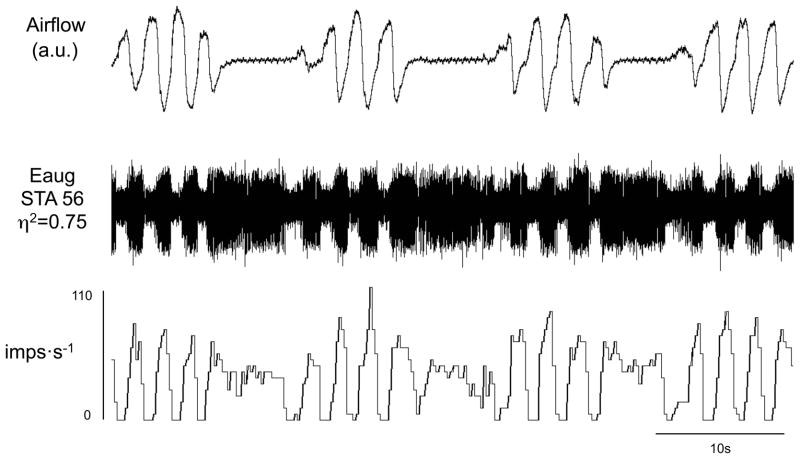
Figure 4.
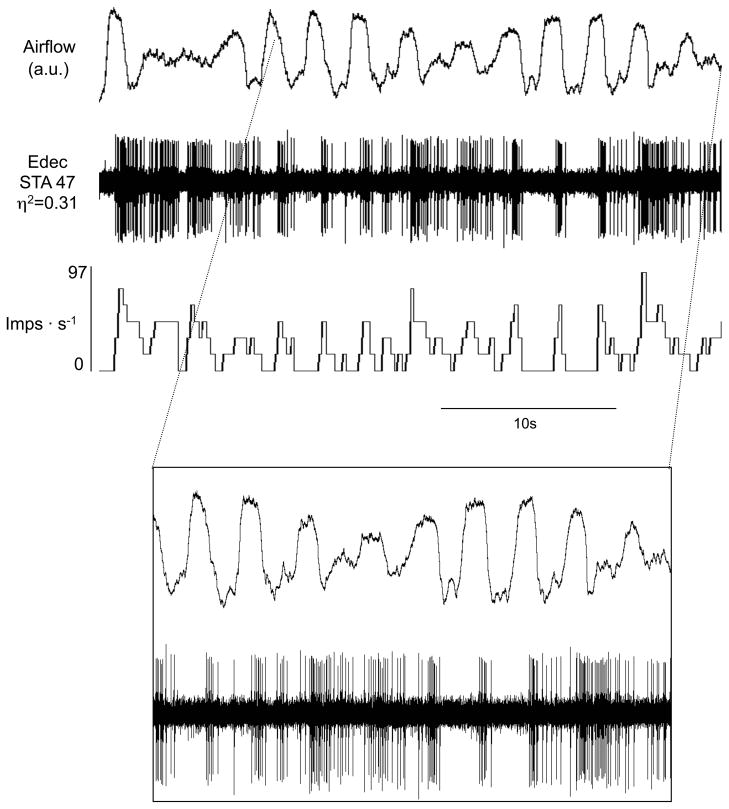
Inspiratory (A) and expiratory neuron (B) during waxing and waning breaths. Traces are airflow, diaphragmatic electromyogram (EMGDIA), raw action potentials and impulses per second. Iaug – augmenting inspiratory; Note in B the tonic expiratory activity in high η2 during waning phase and apneas. Ethru – expiratory throughout.
The interval length of periodic breathing, defined as the start of breathing after the apnea/hypopnea to end of subsequent apnea, was examined in the 6 cats studied. In 20 different epochs of periodic breathing we found that, on average, the intervals of periodic breathing were approximately 13 seconds long (range 9.7 to 15.3 seconds).
3.2 Diaphragmatic activity during periodic breathing
Diaphragmatic activities reported below are qualitative. Diaphragmatic activity was recorded in four of the six cats (GWAY, SUMA, DOLY & EDM in Tables 1 & 2). In all cases of periodic breathing, inspiratory diaphragmatic activity waxed and waned to produce the waxing and waning tidal volumes characteristic of periodic breathing (Figures 2–5). During the waxing phase of periodic breathing, diaphragmatic activity was phasic with clear distinctions between inspiratory, postinspiratory-inspiratory and tonic expiratory activities (Figure 3). Accordingly, the duration of postinspiratory-inspiratory activity (PIIA) was brief when inspiratory activity was greatest and there was a clear expiratory cessation in tonic diaphragmatic activity. Conversely, during the waning phase of periodic breathing, diaphragmatic activity was less phasic than that during the waxing phase and, as a result, the separations between inspiratory, postinspiratory-inspiratory and tonic expiratory activities were less distinct (Figure 3). Thus, during the waning phase the duration of PIIA was longest when inspiratory diaphragmatic activity was least, and tonic expiratory diaphragmatic activity was fully developed (Figure 3).
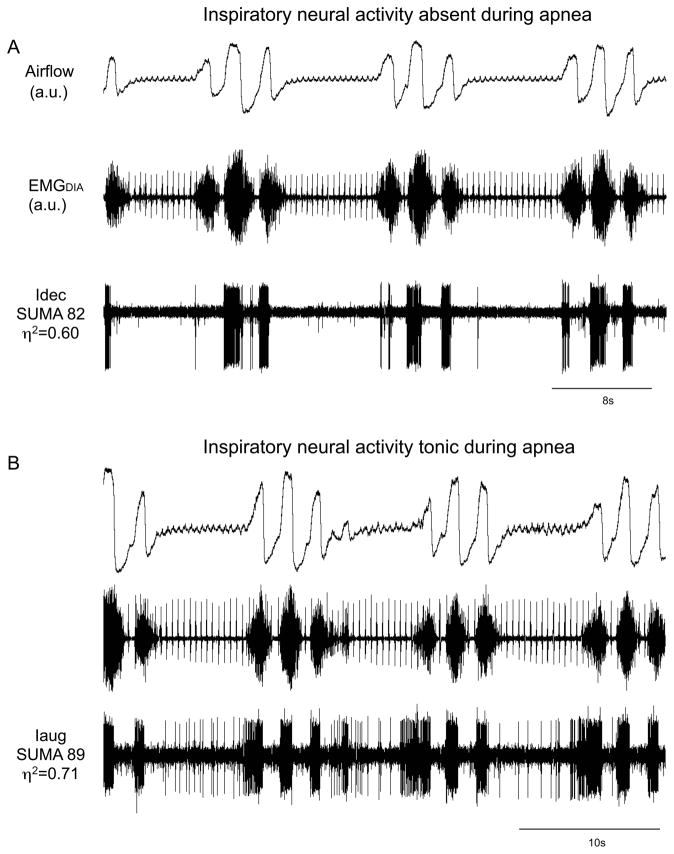
Figure 5.
Activity of inspiratory neurons during apneas associated with periodic breathing. Traces are airflow, diaphragmatic electromyogram (EMGDIA) and raw action potentials of a neuron. Decrementing inspiratory (Idec) neuron without tonic activity during apnea (A). Augmenting inspiratory (Iaug) neuron with tonic activity during apneas associated with periodic breathing (B). Note there is no PIIA in the latter neuron during the waxing phase.
Figure 3.
Hypoxia-induced periodic breathing in one animal (D). Traces are tidal carbon dioxide percentage, airflow, and diaphragmatic electromyogram (EMGDIA).
During the apneas that occurred, diaphragmatic activity declined during the postinspiratory-inspiratory phase and then became silent (Figures 2 & 5). Diaphragmatic activity gradually reappeared in a ramp-like pattern to initiate the first breath of the subsequent waxing phase (Figures 2 & 5).
3.3 Respiratory neural activity during periodic breathing
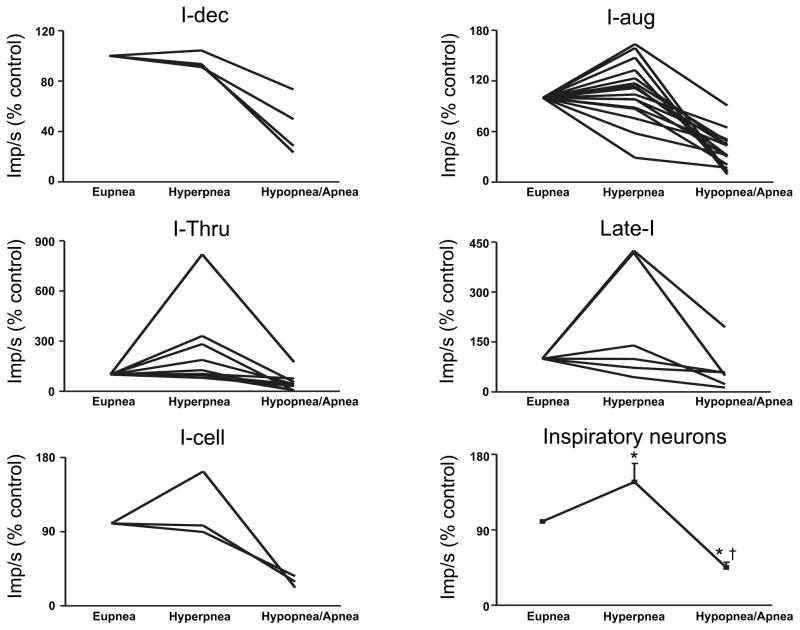
In 61 of the 120 respiratory neurons that we recorded (51% of the recordings), we were also able to simultaneously obtain recordings during periodic breathing. In general, respiratory neurons were most active and distinctly phasic during the waxing phase and they were least active and tonic during the waning phase (Figures 4–12). The exceptions to this are noted below. Although we do not have simultaneous recordings of expiratory and inspiratory neurons, we can infer that during the waning phase there was simultaneous inspiratory and expiratory neuronal activity (compare inspiratory and expiratory activity during apneas in Figures 5B, 6 & 7). Of note, despite the persistence of tonic activity during the waning and apneic phases, respiratory neural activity was significantly below eupneic levels with inspiratory and expiratory activity 43±6% and 60±14% of hypoxic eupnea, respectively (Figures 10–12).
Figure 12.
Respiratory neural activity as a population during periodic breathing. Data for the population of inspiratory and expiratory cells studied are presented as a percent change from respiratory neural activity during eupnea in animals breathing hypoxic gas preceding the bouts of periodic breathing, mean ± S.E.M. * = p<.05 compared to eupnea, † = p<.05 compared to hyperpnea,
Figure 6.
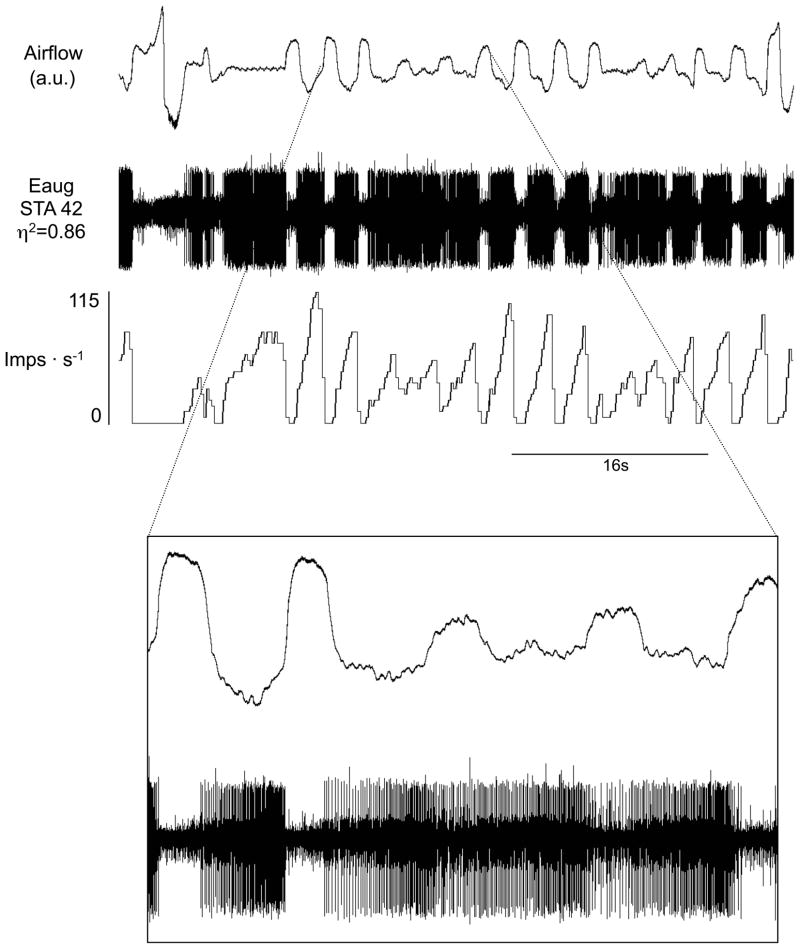
Augmenting expiratory (Eaug) neurons during hypoxia-induced periodic breathing with apneas. Traces are airflow, raw action potentials and impulses per second. Note that the tonic level of activity during apneas is less than the level of activity during expiration in the waxing phase.
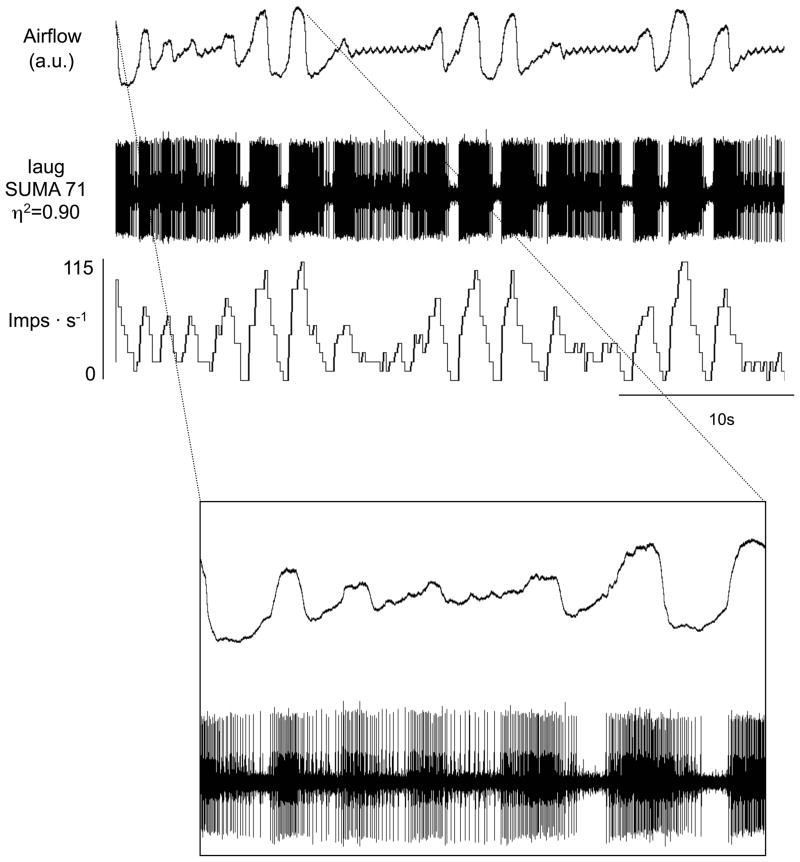
Figure 7.
Augmenting inspiratory (Iaug) neurons during periodic breathing with apneas. Traces are airflow, raw action potentials and impulses per second. In the lower half of the expanded section of the figure, note tonic activity of this inspiratory neuron throughout expiration during the waning phase of periodic breathing.
Figure 10.
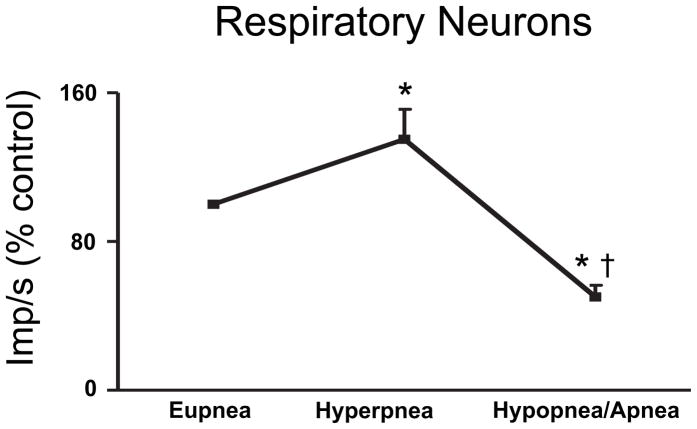
Inspiratory neural activity during periodic breathing. Data are from the largest waxing breath (hyprpnea) and during the smallest waning breath (hypopnea) or apnea. Data are presented as a percent change from respiratory neural activity during eupnea in animals breathing hypoxic gas preceding the bouts of periodic breathing. Data for inspiratory neurons as a population are means ± S.E.M. * = p<.05 compared to eupnea, † = p<.05 compared to hyperpnea. Cell GWAY 1 and SUMA 36a are not presented in these analyses. Data file for GWAY1 became corrupted and could no longer be accessed and SUMA 36a is a Pre-I neuron, so it is neither inspiratory nor expiratory.
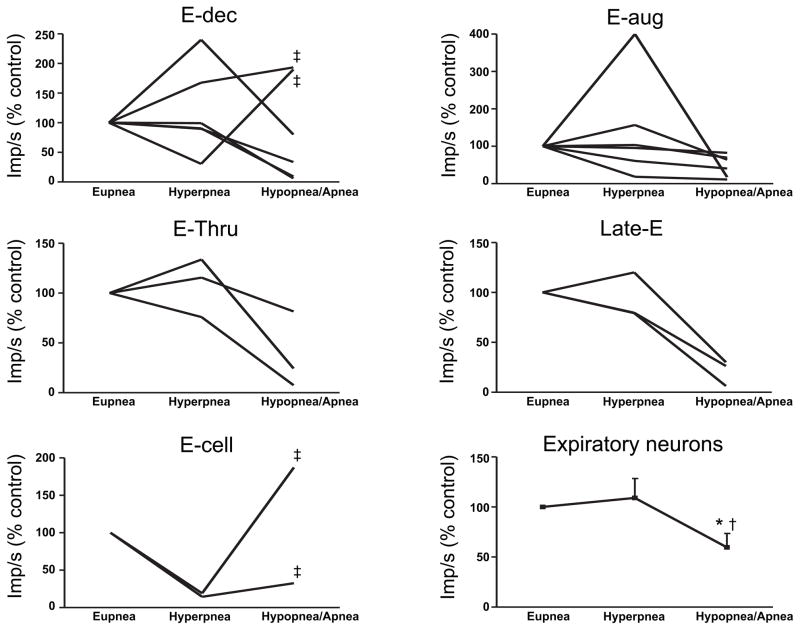
The activity of all classes of inspiratory cells examined increased in-phase with the increases in tidal volumes during the waxing phase (Figures 4–5 & 7, 10). Inspiratory neural activity as a population increased 144±23% of hypoxic eupnea (Figure 10). Expiratory neurons, like inspiratory neurons, were also most active during the waxing phase with expiratory neural activity as a population increasing 109±20% of hypoxic eupnea (Figures 4, 6 & 8–9, 11). Conversely, following the waxing phase, inspiratory neural activity decreased during the waning phase (Figures 4–5 & 7, 10). The majority of inspiratory neurons (31/40) remained phasically active during the waning phase such that they did not fire tonically during the postinspiratory or expiratory phases. There were, however, some inspiratory neurons (n=9/40) that were tonically active during the waning phase of periodic breathing (Table 1, cells noted by *1; Figures 5B & 7). Nevertheless, tonic inspiratory neural activity during expiration and inspiratory neural activity during waning breaths was always less than the activity during the waxing phase (Figures 4–5 & 7, 10). Likewise, during the waning and ensuing apneic phases, expiratory neural activity was either least active or, if tonically active, less than the activity during the waxing phase (Figures 4, 6 & 8–9, 11). However, there were some (n=4/21) expiratory neurons that were most active during the waning phase and least active during the waxing phase (Table 2, cells noted by *1, ‡ in Figure 11). Of note, these neurons all had low η2 values (0.1 to 0.3).
Figure 8.
Decrementing expiratory (Edec) neuron during periodic breathing. Traces are airflow, raw action potentials and impulses per second. In the lower half of the expanded section of the figure, note tonic activity of this expiratory neuron throughout inspiration and expiration during the waning phase of periodic breathing.
Figure 9.
Augmenting expiratory (Eaug) neuron during periodic breathing. Traces are airflow, raw action potentials and impulses per second. In the lower half of the expanded section of the figure, note tonic activity of this expiratory neuron throughout inspiration during the waning phase of periodic breathing.
Figure 11.
Expiratory neural activity during periodic breathing. Data are from the largest waxing breath (hyperpnea) and during the smallest waning breath (hypopnea) or apnea. Data are presented as a percent change from respiratory neural activity during eupnea in animals breathing hypoxic gas preceding the bouts of periodic breathing. Data for expiratory neurons as a population are means ± S.E.M. * = p<.05 compared to eupnea, † = p<.05 compared to hyperpnea, ‡ = low η2 (0.1 to 0.3) expiratory neurons that were more active during the waning phase. Data for GWAY 111 are not presented in these analyses because the cell is PS E-to-I so it is neither inspiratory nor expiratory.
There was sometimes a decrease in amplitude (i.e., firing frequency) of the neural activity with persisting rhythm during the waning phases and apneas, whereas other times there was a total loss of rhythm and decreased neural activity. For example, in Figure 4A, the inspiratory neuronal activity had a decreased amplitude but the rhythm was still present. Similarly in Figure 4B, the expiratory neuronal activity decreased in amplitude but rhythm was weakly expressed. In Figure 5, there was a total loss of rhythm. In Figure 6, rhythm returned before amplitude increased. In Figure 7, there was loss of amplitude but rhythm was evident throughout. Similarly in Figures 8 and 9, as in Figure 7, rhythm was present but the amplitude was low.
The majority of inspiratory neurons (31/40) examined were silent during the apneic phase of periodic breathing (Figure 5A). There were, however, some inspiratory neurons (n=9/40) that were tonically active during the apneas associated with periodic breathing (Table 1, cells noted by *1; Figures 5B & 7). Expiratory neurons were tonically active during the apneas associated with periodic breathing (Figures 6 & 9). The level of tonic activity of expiratory neurons during apneas was always less than or equal to the activity level during the waning breath immediately preceding the apnea (Figure 6).
The individual activities of inspiratory and expiratory neurons during periodic breathing are shown in Figures 10 & 11. The data are presented as a percent change from the eupneic baseline obtained in animals breathing hypoxic gas preceding the bouts of periodic breathing. i.e., hypoxic eupnea. The activity during the largest amplitude breath of the waning phase and the activity during the lowest amplitude breath or apnea are included in these data. Inspiratory and expiratory neuron activity was significantly decreased during the waning phase compared to the waxing phase (Figure 10–11). The four low η2 (0.1 to 0.3) expiratory neurons that were more active during the waning phase are identified by a ‡ in Figure 11. Only inspiratory neural activity as a population was significantly increased during the hyperpneic phase (Figure 10). The activity of all medullary respiratory neurons as a population was significantly greater during the hyperpneic phase and significantly less during the waning phase compared to eupnea in hypoxia (Figure 12).
4.0 Discussion
In this study we found that diaphragmatic activity waxed and waned to produce periodic breathing. Diaphragmatic activity was phasic during the waxing phase with minimal PIIA and little or no tonic diaphragmatic activities. Conversely, during the waning phase of periodic breathing, tonic diaphragmatic activities following inspiration (postinspiratory-inspiratory and expiratory activities) were observed. Like diaphragmatic activity, inspiratory and expiratory neurons of the medulla were most active during the waxing phase and least active during the waning phase. Neural activity was distinctly phasic during the waxing phase and mostly tonic during the waning/apneic phases with significant, in some cases complete, overlap between inspiratory and expiratory neuronal activity. During the apneas associated with periodic breathing, the majority of inspiratory neurons were silent, while the activity of the majority of expiratory neurons was reduced compared to the waxing phase, but remained tonically active.
4.1 Hypoxic vs post-hypoxic periodic breathing
Periodic breathing is well known to occur in hypoxic environments (Weil, 2004). More recently, there have been reports of periodic breathing, occurring as a post-hypoxic ventilatory response (Han et al., 2002; Lovering et al., 2003). In the current study, we found no qualitative differences between hypoxic periodic breathing and post-hypoxic periodic breathing with respect to diaphragmatic activity or medullary respiratory neural activity suggesting that the central neural mechanisms responsible for producing periodic breathing are similar in both conditions. The fact that acetazolamide can be used to prevent periodic breathing that occurs as either a hypoxic response (Hackett et al., 1987) or post-hypoxic response (Yamauchi et al., 2007) further strengthens this argument. Although the mechanisms responsible for producing post-hypoxic periodic breathing cannot be determined by the present study, we suggest that it is caused by the instability in arterial blood gases that occurs during the transition from hypoxia-induced hyperventilation to normoxia and the resumption of eupnea (Figures 2 and 12). This idea is supported by the work of Cherniack and colleagues (Cherniack and Longobardo, 2006; Cherniack et al., 1966; Longobardo et al., 1966).
4.2 Diaphragmatic activity during periodic breathing
The precise neural changes that occurred centrally to produce the changes in diaphragmatic activity that we observed during periodic breathing remain unknown. However, the current study, in combination with the existing literature, may help to shed some light on how and why the respiratory central pattern generator produces this pattern of breathing. It is well established that respiratory muscle activity is differentially activated by different gas mixtures of oxygen and carbon dioxide (Sherrey et al., 1988; Smith et al., 1989a, b) that mimic the fluctuations in arterial blood gases that occur during periodic breathing (Cherniack et al., 1966; Khoo et al., 1996; Longobardo et al., 1966). For example, the resulting level of respiratory drive under steady state conditions of poikilocapnic hypoxia causes increased inspiratory neural activity, diaphragmatic activity and diaphragmatic PIIA (Lovering et al., 2003; Sherrey et al., 1988; Smith et al., 1989b), whereas expiratory muscle activity is simultaneously decreased (Smith et al., 1989b). In combination, these findings may explain why we observed that diaphragmatic activity was reduced, less phasic with more activity during expiration, and little or no expiratory pause during the waning phase of periodic breathing when arterial carbon dioxide and oxygen levels would expected to be relatively low (Lovering et al., 2003; Lovering et al., 2005).
In contrast to poikilocapnic hypoxia, isocapnic hypoxia mimics arterial blood gas values during the waxing phase. The result of this level of respiratory drive is that inspiratory and expiratory muscle activity is increased and PIIA muscle activity is decreased (Sherrey et al., 1988; Smith et al., 1989b). This likely explains our observations in the current study that diaphragmatic activity is greater, phasic, PIIA is of shorter duration, and there is a clear expiratory pause during the waxing phase of periodic breathing. Thus, the central pattern generator appears to respond appropriately to breath-by-breath fluctuations in arterial blood gases and the result is a pattern of periodic breathing. Indeed, it is known that the rapid response to fluctuations in blood gases during periodic breathing by the peripheral chemoreceptors play a key role in the genesis and termination of the periodic breathing (Cherniack et al., 1966; Longobardo et al., 1966; Nakayama et al., 2003; Smith et al., 2003).
4.3 Is periodic breathing caused by oscillations in chemical drive, a slow intrinsic rhythm or both?
In our cats there was a rhythm of periodic breathing that was on average 13 seconds. Others have reported similar intrinsic rhythms (Mayer waves) associated with periodic breathing, suggesting a role for an intrinsic rhythm in producing waxing and waning breaths (Morris et al., 2010; Preiss et al., 1975). However, our data also demonstrate that post-hypoxic periodic breathing terminates as end tidal CO2 increases. Similarly, the addition of CO2 to the inspired air during hypoxia-induced periodic breathing will terminate periodic breathing (Berssenbrugge et al., 1983) and isocapnic hypoxia does not induce periodic breathing (Cherniack et al., 1966). Additionally, it has been demonstrated that hypocapnia is necessary to initiate periodic breathing in a hypoxic environment. This hypocapnia can be caused by either mechanical hyperventilation (Longobardo et al., 1966) or by an augmented breath (Berssenbrugge et al., 1983). Notwithstanding any underlying rhythm that may be present, the role of arterial blood gases at the very least plays a modulatory role in initiating and terminating periodic breathing in animals with intact chemosensors. This idea suggests a requisite for both a central neural component (intrinsic rhythm) and a chemoreflex mechanism contribution to be present.
4.4 Neural activity during periodic breathing: transduction of respiratory drive
This work is the first to describe respiratory neural activity during the spontaneous changes in central neural output that occur to produce periodic breathing. We found that the activity of medullary inspiratory and expiratory cells waxed and waned to cause periodic breathing. During the waxing phase, neural activity was phasic with clear separations between inspiratory and expiratory events. In contrast, during the waning phase, inspiratory and expiratory neural activity became less phasic and more tonically active without clear separation of inspiratory and expiratory activity (See Figures 7–9). The cause(s) of tonic activity during periods of low drive and phasic activity during periods of high drive remain unknown. Below, we offer a few possible explanations.
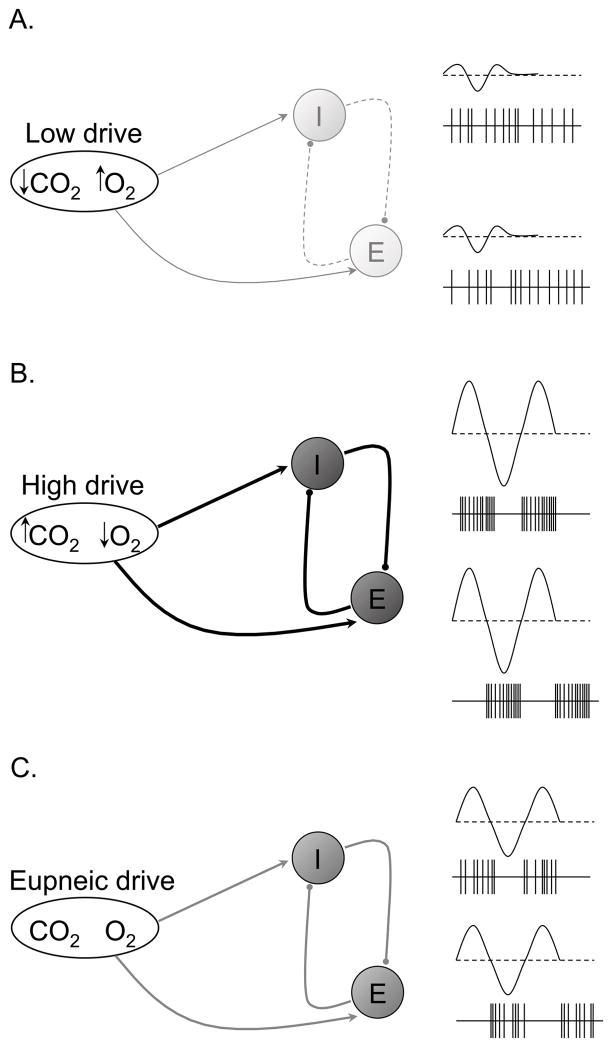
One possible mechanism by which respiratory drive may be translated into a larger amplitude breath would be by increasing the strength of reciprocal inhibition of antagonistic phases, i.e. inspiratory vs. expiratory (Figure 14). Thus, high respiratory drive would be associated with large amplitude breaths and increased synaptic strength of reciprocal inhibitory projections, as evidenced by neurons that were phasically active. In contrast, when drive is lower, breaths are smaller and the strength of reciprocal inhibition may be weaker, as evidenced by both inspiratory and expiratory respiratory neurons firing simultaneously (Figure 14). Support for these ideas comes from the work of Sears (Sears et al., 1982) and Bainton (Bainton and Kirkwood, 1979; Bainton et al., 1978) in anesthetized mechanically-ventilated animals. These authors found that during mechanical hyperventilation in anesthetized decerebrate preparations, expiratory and occasionally inspiratory muscle activity was tonic. However, carbon dioxide levels were increased incrementally and respiratory muscle activity became less tonic and more phasic until a clear separation of inspiratory and expiratory activity was restored when carbon dioxide ultimately reached eupneic levels. Bainton and Kirkwood confirmed that expiratory neurons were also tonic at low levels of carbon dioxide and gradually became phasic with increasing levels of carbon dioxide (Bainton and Kirkwood, 1979). In intact unanesthetized cats mechanically ventilated to apnea, the activity of inspiratory and expiratory neurons, if present, is tonic which suggests that they are non-reciprocally inhibited and consequently they are simultaneously active during periods associated with low drive (Orem and Vidruk, 1998). These data suggest that the waning phase and subsequent apneas in the current study may have occurred through a reduction in the synaptic strength of reciprocal inhibition caused by a reduction in respiratory drive. Modeling work from our group has demonstrated that reduced strength of reciprocal inhibition between inspiratory and expiratory neuron pools can in fact result in a periodic breathing pattern (Dunin-Barkowski et al., 2003). In combination, these previous data and our data reported here support the idea that increased, balanced drives (excitation to both inspiratory and expiratory neurons) are associated with a greater likelihood of strong reciprocally inhibitory phasic respiratory activity and the persistence of eupnea. If true, then our data would suggest that a potential cause of central sleep apnea is via either a loss of, or reduction in, reciprocal inhibition resulting from a decreased drive to breathe. In this case, with inspiratory and expiratory neurons simultaneously active, neither inspiration nor expiration dominates and the end result is no breathing.
Figure 14.
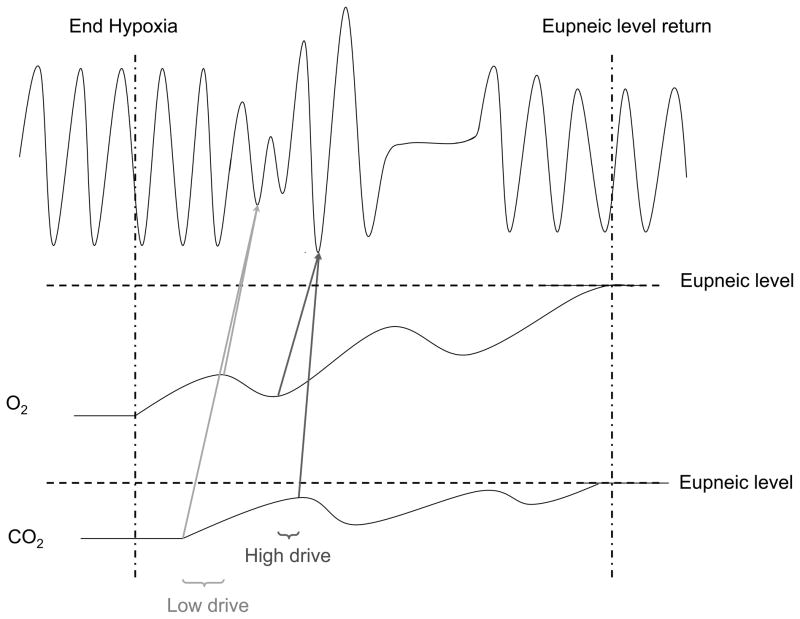
Hypothetical schematic for the transduction of respiratory drive into central respiratory neural output during post-hypoxic periodic breathing. Low respiratory drive (reduced PaCO2 and relatively higher PaO2) causes reduced strength of reciprocal inhibition (dashed lines) resulting in mostly tonic inspiratory and expiratory neural output, subsequently producing hypopnea and apnea (A). High respiratory drive (increased PaCO2 and relatively low PaO2) causes increased strength of reciprocal inhibition (heavy dark lines) resulting in highly phasic inspiratory and expiratory neural output, subsequently producing hyperpnea (B). Eupneic respiratory drive (“normal” PaCO2 and PaO2) causes normal strength of reciprocal inhibition (gray lines) resulting in mostly phasic inspiratory and expiratory neural output, subsequently producing eupnea (C). Note that periods of low and high drive in this Figure correspond to periods of low and high drive in Figure 13.
Work in humans has found that increased respiratory drive results in an increased frequency of action potentials in various respiratory muscles (Gandevia et al., 1999). These authors have also identified that there are multiple patterns of tonic and phasic activity in respiratory muscles, which they suggest may allow for flexibility in the system (Saboisky et al., 2006). Central respiratory neurons that receive strong respiratory modulated afference (highly phasic) can be classified as high η2 neurons, whereas central respiratory neurons that receive weak respiratory modulated afference (mostly tonic) can be classified as low η2 neurons (Orem and Dick, 1983). Accordingly, Orem has hypothesized that low η2 neurons may be the interface neurons between high η2 neurons, presumed to constitute the central pattern generator, and non-respiratory influences (Orem, 1989). Thus, low and high η2 neurons may be the source of the tonic and phasic activity, respectively, required for the flexibility of the respiratory system. We would propose also that multiple patterns of tonic and phasic activity within low and high η2 neurons may allow for greater (or lesser) respiratory drive to be expressed as needed while maintaining the flexibility required by the respiratory system.
4.5 Implications for central respiratory control theory
The effects of various levels of respiratory drive on determining the apneic threshold, and thus ventilatory stability, have been well characterized by Dempsey and colleagues (Dempsey, 2005). In general, they have found that increased respiratory drive increases ventilatory stability while decreased respiratory drive decreases ventilatory stability. Interestingly, one caveat to this is that increased respiratory drive resulting from poikilocapnic hypoxia actually reduces ventilatory stability (Dempsey, 2005). Based on the current study, one reason poikilocapnic hypoxia-induced drive may differ from other types of respiratory drive resulting in greater ventilatory instability may be due to the tonic inspiratory drive to the respiratory system during expiration under poikilocapnic hypoxic conditions. This idea is supported by the fact that hypoxic periodic breathing does not occur in either REM sleep or in conditions of sustained isocapnic hypoxia (Berssenbrugge et al., 1983), two conditions that are also associated with increased respiratory drive (Nielsen and Smith, 1951; Orem et al., 2000; Orem et al., 2005) and an absence or reduction in tonic inspiratory activity during expiration as measured by reduced diaphragmatic and reduced neural PIIA (Lovering et al., 2003; Lovering et al., 2005; Sherrey et al., 1988). Taken together, these data may explain how increased drive from poikilocapnic hypoxia may act on central respiratory neurons to reduce ventilatory stability by increasing the level of tonic inspiratory drive during expiration and increasing the propensity for apnea. These data would also explain why periodic breathing gradually stabilizes as arterial carbon dioxide, and thus strong phasic inspiratory and expiratory central neural activity, gradually increases after mechanical hyperventilation, or during post-hypoxic periodic breathing (Cherniack et al., 1966; Longobardo et al., 1966).
A final important finding from our data obtained during the apneic and waning phases was that the rhythm and amplitude of the neural activity was variable. In some cases, neural activity had decreased amplitude but the rhythm was still present (e.g., Figures 4 and 7). In other cases, there was a total loss of rhythm and amplitude (e.g., Figure 5). Still, in other cases, either rhythm returned before the amplitude increased or there was a loss of amplitude but a persistent rhythm (Figure 6–7). These data suggest that the apneic and waning phases can have different characteristics neurologically and that the rhythm generating system is more robust and less sensitive to the apnea generating influences than the amplitude generating system. Others have hypothesized that separate mechanisms for amplitude and rhythm generation may allow for optimization of energy expenditure required for breathing by allowing for separate modulation of each controller (Del Negro et al., 2009; Milsom, 1989). Similarly, our data support the idea that in the face of reduced respiratory drive when breathing would not be required, the amplitude of neural activity is decreased or absent which would optimize the energy expenditure of the respiratory system. However, the rhythm would be retained by the rhythm generating mechanism such that when respiratory drive increased to the point that breathing is required, the amplitude generating mechanism would be able to produce a breath of appropriate amplitude for the given level of drive “without missing a beat,” so to speak. Thus, retaining the rhythm in the absence of amplitude may further optimize energy expenditure by not only producing a breath representative of the appropriate level of drive but also producing that breath in time with the respiratory rhythm. In summary, periodic breathing may be the result of the amplitude and timing mechanisms operating under the influence of an underlying rhythm (e.g., Mayer waves) to optimize energy expenditure under conditions of fluctuating levels of both respiratory drive and apneic/eupneic thresholds (Ghazanshahi and Khoo, 1993; Levine et al., 2000).
5.0 Conclusion
The goal of these studies was to help provide some of the missing information linking fluctuations in respiratory drive to the final motor output by the diaphragm to produce the repetitive waxing and waning breaths that are the hallmark of periodic breathing. The current work supports the idea that breathing is not entirely destabilized during periodic breathing, but rather, breathing is most stable during the waxing phase and least stable during the waning/apneic phase, with the respiratory neurons of the central pattern generator responding appropriately to unstable fluctuations in integrated respiratory drive. During periods of low respiratory drive, both inspiratory and expiratory neurons were tonically active suggesting a reduction or absence of reciprocal inhibition. Conversely, during periods of high respiratory drive, respiratory neurons were phasically active suggesting very strong reciprocal inhibition. We propose that the strength of reciprocal inhibition between central respiratory neurons may be determined by the strength of respiratory drive. Thus, oscillations in high and low respiratory drive would result in oscillations in the strength of reciprocal inhibition. The end result would be periods of breathing and apnea, respectively. The apneic threshold would therefore be at the level of drive at which the strength of reciprocal inhibition between central respiratory neurons becomes so weak that the central pattern generator does not fire with sufficient dominance in either phase to produce a breath. Although unknown, circulating peptides or other modulatory substances that act, either directly or indirectly, to reduce the strength of reciprocal inhibition between central respiratory neurons may ultimately cause breathing to fail in patients with central sleep apnea.
Figure 13.
Hypothetical schematic for the genesis of post-hypoxic periodic breathing. Note the alternating periods of lower and higher drive caused by fluctuating levels of arterial blood gases that occur during the transition form hypoxia-induced hyperventilation to eupnea. Eupnea returns as blood gases return to eupneic levels. All units are arbitrary.
Highlights.
Diaphragmatic activity was increased and phasic during the waxing phase and was decreased and tonic during the waning phase.
Expiratory and inspiratory neural activity was increased and phasic during the waxing phase but was decreased and more tonic during the waning phase.
During apneas associated with PB, diaphragmatic activity was silent and most, but not all, inspiratory cells were inactive while the activity of most expiratory cells was decreased but remained tonically active.
Acknowledgments
We thank Becky J. Tilton for animal care and Tyler S. Mangum, BS and Carly J. Celebrezze for assistance with data analysis. Support: NIH HL-21257 (JMO), HL-62589 (EHV & JMO), NS-46062 (JMO & WLDB); US Department of Education Graduate Assistantship in Areas of National Need Fellowship P200A80102 (ATL), Achievement Rewards for College Scientists (ARCS) Foundation (ATL), American Physiological Society’s Giles F. Filley Memorial Award for Excellence in Respiratory Physiology & Medicine (ATL).
Footnotes
Publisher's Disclaimer: This is a PDF file of an unedited manuscript that has been accepted for publication. As a service to our customers we are providing this early version of the manuscript. The manuscript will undergo copyediting, typesetting, and review of the resulting proof before it is published in its final citable form. Please note that during the production process errors may be discovered which could affect the content, and all legal disclaimers that apply to the journal pertain.
References
- Bainton CR, Kirkwood PA. The effect of carbon dioxide on the tonic and the rhythmic discharges of expiratory bulbospinal neurones. J Physiol. 1979;296:291–314. doi: 10.1113/jphysiol.1979.sp013006. [DOI] [PMC free article] [PubMed] [Google Scholar]
- Bainton CR, Kirkwood PA, Sears TA. On the transmission of the stimulating effects of carbon dioxide to the muscles of respiration. J Physiol. 1978;280:249–272. doi: 10.1113/jphysiol.1978.sp012383. [DOI] [PMC free article] [PubMed] [Google Scholar]
- Batsel HL. Activity of bulbar respiratory neurons during passive hyperventilation. Exp Neurol. 1967;19:357–374. doi: 10.1016/0014-4886(67)90032-5. [DOI] [PubMed] [Google Scholar]
- Berssenbrugge A, Dempsey J, Iber C, Skatrud J, Wilson P. Mechanisms of hypoxia-induced periodic breathing during sleep in humans. J Physiol. 1983;343:507–524. doi: 10.1113/jphysiol.1983.sp014906. [DOI] [PMC free article] [PubMed] [Google Scholar]
- Cherniack NS, Longobardo GS. Mathematical models of periodic breathing and their usefulness in understanding cardiovascular and respiratory disorders. Exp Physiol. 2006;91:295–305. doi: 10.1113/expphysiol.2005.032268. [DOI] [PubMed] [Google Scholar]
- Cherniack NS, Longobardo GS, Levine OR, Mellins R, Fishman AP. Periodic breathing in dogs. J Appl Physiol. 1966;21:1847–1854. doi: 10.1152/jappl.1966.21.6.1847. [DOI] [PubMed] [Google Scholar]
- Del Negro CA, Kam K, Hayes JA, Feldman JL. Asymmetric control of inspiratory and expiratory phases by excitability in the respiratory network of neonatal mice in vitro. J Physiol. 2009;587:1217–1231. doi: 10.1113/jphysiol.2008.164079. [DOI] [PMC free article] [PubMed] [Google Scholar]
- Dempsey JA. Crossing the apnoeic threshold: causes and consequences. Exp Physiol. 2005;90:13–24. doi: 10.1113/expphysiol.2004.028985. [DOI] [PubMed] [Google Scholar]
- Dempsey JA, Veasey SC, Morgan BJ, O’Donnell CP. Pathophysiology of sleep apnea. Physiol Rev. 2010;90:47–112. doi: 10.1152/physrev.00043.2008. [DOI] [PMC free article] [PubMed] [Google Scholar]
- Dunin-Barkowski WL, Escobar AL, Lovering AT, Orem JM. Respiratory pattern generator model using Ca++-induced Ca++ release in neurons shows both pacemaker and reciprocal network properties. Biol Cybern. 2003;89:274–288. doi: 10.1007/s00422-003-0418-6. [DOI] [PubMed] [Google Scholar]
- Gandevia SC, Gorman RB, McKenzie DK, De Troyer A. Effects of increased ventilatory drive on motor unit firing rates in human inspiratory muscles. Am J Respir Crit Care Med. 1999;160:1598–1603. doi: 10.1164/ajrccm.160.5.9904023. [DOI] [PubMed] [Google Scholar]
- Ghazanshahi SD, Khoo MC. Optimal ventilatory patterns in periodic breathing. Annals of biomedical engineering. 1993;21:517–530. doi: 10.1007/BF02584334. [DOI] [PubMed] [Google Scholar]
- Hackett PH, Roach RC, Harrison GL, Schoene RB, Mills WJ., Jr Respiratory stimulants and sleep periodic breathing at high altitude. Almitrine versus acetazolamide. Am Rev Respir Dis. 1987;135:896–898. doi: 10.1164/arrd.1987.135.4.896. [DOI] [PubMed] [Google Scholar]
- Han F, Subramanian S, Price ER, Nadeau J, Strohl KP. Periodic breathing in the mouse. J Appl Physiol. 2002;92:1133–1140. doi: 10.1152/japplphysiol.00785.2001. [DOI] [PubMed] [Google Scholar]
- Khoo MC, Anholm JD, Ko SW, Downey R, 3rd, Powles AC, Sutton JR, Houston CS. Dynamics of periodic breathing and arousal during sleep at extreme altitude. Respir Physiol. 1996;103:33–43. doi: 10.1016/0034-5687(95)00057-7. [DOI] [PubMed] [Google Scholar]
- Levine M, Hathorn MK, Cleave JP. Optimization of inspiratory work in periodic breathing in infants. Pediatr Res. 2000;47:256–265. doi: 10.1203/00006450-200002000-00018. [DOI] [PubMed] [Google Scholar]
- Longobardo GS, Cherniack NS, Fishman AP. Cheyne-Stokes breathing produced by a model of the human respiratory system. J Appl Physiol. 1966;21:1839–1846. doi: 10.1152/jappl.1966.21.6.1839. [DOI] [PubMed] [Google Scholar]
- Lovering AT, Dunin-Barkowski WL, Vidruk EH, Orem JM. Ventilatory response of the cat to hypoxia in sleep and wakefulness. J Appl Physiol. 2003;95:545–554. doi: 10.1152/japplphysiol.01051.2002. [DOI] [PubMed] [Google Scholar]
- Lovering AT, Fraigne JJ, Dunin-Barkowski WL, Vidruk EH, Orem JM. Medullary Respiratory Neural Activity during Hypoxia in NREM and REM Sleep in the Cat. J Neurophysiol. 2005;95:803–810. doi: 10.1152/jn.00615.2005. [DOI] [PubMed] [Google Scholar]
- Megirian D, Ryan AT, Sherrey JH. An electrophysiological analysis of sleep and respiration of rats breathing different gas mixtures: diaphragmatic muscle function. Electroencephalogr Clin Neurophysiol. 1980;50:303–313. doi: 10.1016/0013-4694(80)90158-3. [DOI] [PubMed] [Google Scholar]
- Milsom WK. Mechanics of breathing: Comparative aspects. In: Wood SC, Lenfant C, editors. Comparative Pulmomary Physiology: Current Concepts. Marcel-Dekker, Inc; New York: 1989. pp. 587–619. [Google Scholar]
- Morris KF, Nuding SC, Segers LS, Baekey DM, Shannon R, Lindsey BG, Dick TE. Respiratory and Mayer wave-related discharge patterns of raphe and pontine neurons change with vagotomy. J Appl Physiol. 2010;109:189–202. doi: 10.1152/japplphysiol.01324.2009. [DOI] [PMC free article] [PubMed] [Google Scholar]
- Nakayama H, Smith CA, Rodman JR, Skatrud JB, Dempsey JA. Carotid body denervation eliminates apnea in response to transient hypocapnia. J Appl Physiol. 2003;94:155–164. doi: 10.1152/japplphysiol.00722.2002. [DOI] [PubMed] [Google Scholar]
- Nielsen M, Smith H. Studies on the regulation of respiration in acute hypoxia; preliminary report. Acta physiologica Scandinavica. 1951;22:44–46. doi: 10.1111/j.1748-1716.1951.tb00748.x. [DOI] [PubMed] [Google Scholar]
- Orem J. Behavioral inspiratory inhibition: inactivated and activated respiratory cells. J Neurophysiol. 1989;62:1069–1078. doi: 10.1152/jn.1989.62.5.1069. [DOI] [PubMed] [Google Scholar]
- Orem J, Dick T. Consistency and signal strength of respiratory neuronal activity. J Neurophysiol. 1983;50:1098–1107. doi: 10.1152/jn.1983.50.5.1098. [DOI] [PubMed] [Google Scholar]
- Orem J, Lovering AT, Dunin-Barkowski W, Vidruk EH. Endogenous excitatory drive to the respiratory system in rapid eye movement sleep in cats. J Physiol. 2000;527(Pt 2):365–376. doi: 10.1111/j.1469-7793.2000.00365.x. [DOI] [PMC free article] [PubMed] [Google Scholar]
- Orem J, Vidruk EH. Activity of medullary respiratory neurons during ventilator-induced apnea in sleep and wakefulness. J Appl Physiol. 1998;84:922–932. doi: 10.1152/jappl.1998.84.3.922. [DOI] [PubMed] [Google Scholar]
- Orem JM, Lovering AT, Vidruk EH. Excitation of medullary respiratory neurons in REM sleep. Sleep. 2005;28:801–807. doi: 10.1093/sleep/28.7.801. [DOI] [PubMed] [Google Scholar]
- Preiss G, Iscoe S, Polosa C. Analysis of a periodic breathing pattern associated with Mayer waves. Am J Physiol. 1975;228:768–774. doi: 10.1152/ajplegacy.1975.228.3.768. [DOI] [PubMed] [Google Scholar]
- Saboisky JP, Butler JE, Fogel RB, Taylor JL, Trinder JA, White DP, Gandevia SC. Tonic and phasic respiratory drives to human genioglossus motoneurons during breathing. J Neurophysiol. 2006;95:2213–2221. doi: 10.1152/jn.00940.2005. [DOI] [PubMed] [Google Scholar]
- Schwarzacher SW, Smith JC, Richter DW. Pre-Botzinger complex in the cat. J Neurophysiol. 1995;73:1452–1461. doi: 10.1152/jn.1995.73.4.1452. [DOI] [PubMed] [Google Scholar]
- Sears TA, Berger AJ, Phillipson EA. Reciprocal tonic activation of inspiratory and expiratory motoneurones by chemical drives. Nature. 1982;299:728–730. doi: 10.1038/299728a0. [DOI] [PubMed] [Google Scholar]
- Sherrey JH, Pollard MJ, Megirian D. Proprioceptive, chemoreceptive and sleep state modulation of expiratory muscle activity in the rat. Exp Neurol. 1988;101:50–62. doi: 10.1016/0014-4886(88)90064-7. [DOI] [PubMed] [Google Scholar]
- Smith CA, Ainsworth DM, Henderson KS, Dempsey JA. Differential responses of expiratory muscles to chemical stimuli in awake dogs. J Appl Physiol. 1989a;66:384–391. doi: 10.1152/jappl.1989.66.1.384. [DOI] [PubMed] [Google Scholar]
- Smith CA, Ainsworth DM, Henderson KS, Dempsey JA. Differential timing of respiratory muscles in response to chemical stimuli in awake dogs. J Appl Physiol. 1989b;66:392–399. doi: 10.1152/jappl.1989.66.1.392. [DOI] [PubMed] [Google Scholar]
- Smith CA, Nakayama H, Dempsey JA. The essential role of carotid body chemoreceptors in sleep apnea. Can J Physiol Pharmacol. 2003;81:774–779. doi: 10.1139/y03-056. [DOI] [PubMed] [Google Scholar]
- Weil JV. Sleep at high altitude. High Alt Med Biol. 2004;5:180–189. doi: 10.1089/1527029041352162. [DOI] [PubMed] [Google Scholar]
- Yamauchi M, Dostal J, Strohl KP. Acetazolamide protects against posthypoxic unstable breathing in the C57BL/6J mouse. J Appl Physiol. 2007;103:1263–1268. doi: 10.1152/japplphysiol.01287.2006. [DOI] [PubMed] [Google Scholar]


