Abstract
OBJECTIVE:
The menin tumor suppressor protein is abundantly expressed in the liver, although no function has been identified because of lack of tumor development in multiple endocrine neoplasia type 1 (Men1) null livers. We examine the phenotype of mice lacking one functional allele of Men1 (consistent with the phenotype in humans with MEN1 syndrome) challenged with high fat diet (HFD) to elucidate a metabolic function for hepatic menin.
METHODS:
In this study, we challenged mice harboring a liver-specific hemizygous deletion of Men1 (HETs) alongside wild-type (WT) counterparts with HFD for 3 months and monitored the severity of metabolic changes. We demonstrate that the HET mice challenged with HFD for 3 months show an increased weight gain with decreased glucose tolerance compared with WT counterparts. Along with these changes, there was a more severe serum hormone profile involving increased serum insulin, glucose and glucagon, all hallmarks of the type 2 diabetic phenotype. In concert with increased serum hormones, we found that these mice have significantly increased liver triglycerides coupled with increased liver steatosis and inflammatory markers. Quantitative real-time PCR and western blotting studies show increases in enzymes involved with lipogenesis and hepatic glucose production.
CONCLUSION:
We conclude that hepatic menin is required for regulation of diet-induced metabolism, and our studies indicate a protective role for the Men1 gene in the liver when challenged with HFD.
Keywords: menin, metabolic syndrome, fatty liver, type 2 diabetes
Introduction
Menin is the product of the multiple endocrine neoplasia type 1 (Men1) gene, a classical tumor suppressor following the 2-hit hypothesis, which involves one genetic mutation followed by a somatic mutation causing tumor formation. Loss of menin causes the MEN1 syndrome in humans, which is an autosomal dominant disorder characterized by development of neuroendocrine tumors, glucose intolerance and type 2 diabetes.1, 2, 3 The metabolic consequences of the MEN1 syndrome have been largely ignored, and elucidating a role for menin in metabolism can be useful in identifying novel drug targets for metabolic disorders.
Recently, we have shown metabolic abnormalities in mice hemizygous for menin specifically in the liver, noting differences in insulin sensitivity and markers of hepatic glucose production (HGP) compared with wild type (WT) littermates on normal chow.4 In the current study, we challenge menin liver-specific hemizygous mice and their WT littermates with high fat diet (HFD) for 3 months and characterized their phenotype based on metabolic parameters. Mice with hemizygous deletion of menin on a HFD show increasing weight gain, increases in serum hormones such as insulin and glucagon, and increases in liver triglycerides (TG) and steatosis compared with WT. The menin mice (HETs) also exhibit increases in metabolically relevant genes such as uncoupling protein 2 (UCP2), peroxisome proliferator-activated receptor γ coactivator 1-α (PGC-1α) and glucokinase (GK), all of which are associated with the upregulation of HGP and lipogenesis.5, 6, 7, 8 These results demonstrate that hepatic menin has a protective role during high fat feeding and when lost contributes to diet-induced obesity.
Materials and methods
Animal maintenance
Animals were kept on a 12:12-h dark–light cycle and fed Research Diets (New Brunswick, NJ, USA) D12451 consisting of 45% calories from saturated fat, ad libitum, for 3 months starting at 3 months of age. All procedures were approved by Institutional Animal Care and Use Committee at the University of Toledo. Liver-specific menin hemizygous mice on a mix of FVB/129S mice expressing loxP sequences on exons 3–8 of the Men1 gene (Jackson Labs, Bar Harbor, ME, USA, #005109) and C57bl/6 mice expressing Albumin-Cre (Jackson Labs, #003574) were crossed, and genotyping was performed with tail lysates. WT and Flox (loxP) sequences with Cre expression were considered hemizygous for menin in the liver (HETs).4 All experiments were conducted with WT HFD N=7 and HET HFD N=5 unless otherwise noted.
Serum hormone assays and glucose tolerance test
Fasting glucose was obtained using a glucometer (Accu-Chek, Roche, Indianapolis, IN, USA) after mice had undergone an 18-h fast. Mice were then injected intraperitoneally with 2 mg kg−1 glucose and monitored up to 180 minutes after injection. The upper limit of detection is 600 mg dl−1 and glucose above that level was recorded as such. Whole venous blood was collected via the retro orbital sinus. Radioimmunoassay was then conducted to measure serum insulin (Millipore, Billerica, MA, USA, #SRI-13K), glucagon (Millipore, #GL-32K) and C-peptide (Millipore, #RCP-21K). The C:I (C-peptide to Insulin) ratio was calculated from the serum C-peptide and insulin values.
Triglyceride and free fatty-acid measurements
Liver-specific triglyceride concentrations were determined by digesting tissue samples in chloroform-methanol (2:1 (v/v)). Briefly, the lipid layer was separated using H2SO4, and concentrations were determined using triglyceride assay kit (Pointe Scientific Inc., Canton, MI, USA) and spectrophotometry. TG were normalized ng per μg of tissue. Serum TG were also analyzed using Pointe Scientific Inc. triglyceride reagents. Serum-free fatty acids were calculated using NEFA C kit (Wako Chemicals, Richmond, VA, USA).
Liver histology
Livers were fixed in formalin and paraffin embedded. These liver sections were then stained with hemotoxylin-eosin and assessed for the degree of steatosis and lobular inflammation according to the non-alcoholic steatohepatitis (NASH) scoring system proposed by the National Institute of Diabetes and Digestive and Kidney Diseases (NIDDK)-NASH Clinical Research Network.9
Quantitative real-time PCR
RNA was extracted using the 5 PRIME PerfectPure RNA Tissue Kit (5 Prime, Gaithersburg, MD, USA). RNA was transcribed into complimentary DNA, as described previously.4 quantitative real-time PCR was performed on the Applied Biosystems StepOnePlus system using Fast SYBR green Master Mix (Applied Biosystems, Carlsbad, CA, USA). Probe sequences are as follows:
Menin forward: 5′-TCATTGCTGCCCTCTATGCC-3′
Menin reverse: 5′-TCCAGTTTGGTGCCTGTGATG-3′
TNFα forward: 5′-CATCTTCTCAAAATTCGAGTGACAA-3′
TNFα reverse: 5′-TGGGAGTAGACAAGGTACAACCC-3′
18S forward: 5′-ATACATGCCGACGGGCGCTG-3′
18S reverse: 5′-GGGAGGGAGCTCACCGGGTT-3′
PGC1α forward: 5′-ATGTGTCGCCTTCTTGCTCT-3′
PGC1α reverse: 5′-CACGACCTGTGTCGAGAAAA-3′
UCP2 forward: 5′-GCGTTCTGGGTACCATCC-3′
UCP2 reverse: 5′-GCGACCACGCCATTGTAGA-3′
GK forward: 5′-ACTTTCCAGGCCACAAACA-3′
GK reverse: 5′-TCCCAGAACTGTAAGCCACTC-3′
HNF4α forward: 5′-ATCTTCTTTGATCCAGATGCCA-3′
HNF4α reverse: 5′-GTTGATGTAATCCTCCAGGC-3′
Immunoblotting analysis
Livers were harvested and lysed in T-PER (Life Technologies, Grand Island, NY, USA) with Complete Protease Inhibitor Mini (Roche) and HALT Phosphatase Inhbitor (Thermo Fisher, Waltham, MA, USA). Protein concentration was assayed using the bicinchoninic acid (BCA) protein assay (Pierce, Rockford, IL, USA) and 50 μg of protein was loaded per well. Samples were run on a 10% Tris glycine gel at 125 V for 2 h. Blots were probed using antibodies against menin (Santa Cruz Biotechonology, Santa Cruz, CA, USA), HNF4α (Santa Cruz Biotechnology) and PGC1α (Santa Cruz Biotechnology). Analysis was done using the Odyssey Infrared Imager (Li-Cor, Lincoln, NE, USA) with secondary antibodies conjugated to near-infrared dyes (Li-Cor).
Statistical analysis
Values are reported as mean±s.e.m. Student's t test and two-way analysis of variance with Bonferroni's post test were performed using GraphPad Prism version 5.02 for Windows (GraphPad Software, San Diego, CA, USA; http://www.graphpad.com).
P values <0.05 were considered statistically significant.
Results
HET mice show increased weight gain and a higher glucose intolerance than WT counterparts
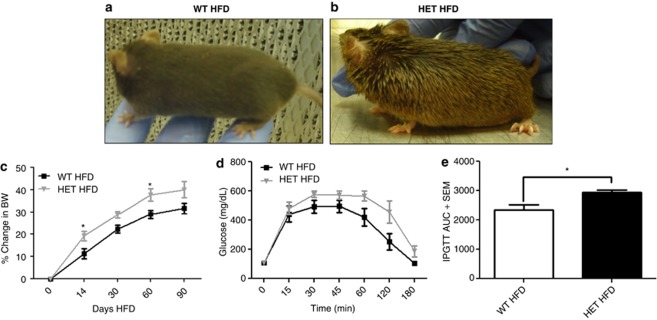
HET mice and their WT counterparts were fed HFD ad libitum for a period of 3 months. As shown in Figures 1a and b, the HET mice show a scruffy phenotype compared with WT animals, which could indicate illness or a more cytotoxic effect as a result of the HFD on mice deficient in menin.10, 11 During the 3-month period, mice were weighed initially 2 weeks after feeding, then each month after that for the duration of the experiment. As shown in Figure 1c, the HET mice showed increased weight gain compared with WT throughout the experiment, and reached statistical significance at 14 days and 60 days of high fat feeding. We performed glucose tolerance testing (IPGTT) (Figure 1d) on these mice and found that HET mice had a significantly increased area under the curve (Figure 1e), indicating an increased glucose intolerance.
Figure 1.
High fat diet (HFD)-challenged HET mice show increased weight gain and glucose intolerance. (a) Representative photos of WT HFD-fed mice versus (b) HET HFD-fed mice. (c) Percent change in body weight at 0, 14, 30, 60 and 90 days of high fat feeding; *P<0.05 (d) Glucose tolerance test (e) IPGTT area under the curve *P<0.0387, N=5 for both groups.
Menin HETs have increased serum hormones compared with WT counterparts
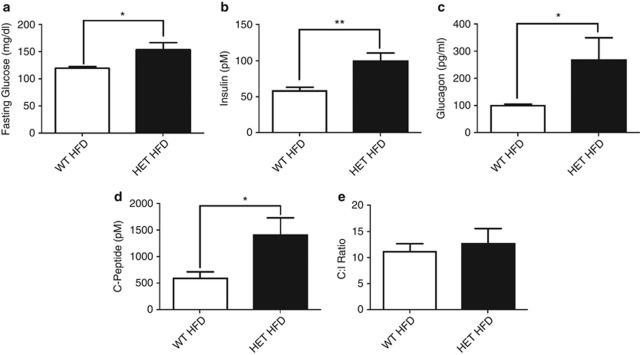
To further investigate the metabolic phenotype of the HET mice, serum was harvested from the mice after 3 months of high fat feeding for analysis. The HET mice showed increased levels of serum glucose, insulin and glucagon, all consistent with a type 2 diabetic phenotype (Figures 2a–c).12, 13 To check whether the increased serum insulin levels were due to increased insulin secretion from β cells, serum C-peptide was measured. This is a reliable indication of secretion because it is released from the β cell at a 1:1 ratio with insulin.14 A significant increase was observed in C-peptide, indicating increased insulin secretion in these animals compared with WT (Figure 2d). Using the C-peptide and serum insulin measurements, the C:I ratio was calculated, which is, a measure of insulin clearance predominantly in the liver.15 There were no significant increases in the C:I ratio in these animals (Figure 2e), indicating no problems in insulin clearance, and enforcing that the increase in serum insulin is attributed to increased insulin secretion related to insulin resistance in these animals.16
Figure 2.
Fasting serum hormone concentrations. (a) Glucose; *P<0.01. (b) Insulin; **P<0.0028. (c) Glucagon; *P<0.0350. (d) C-peptide; *P<0.05 (e) C:I ratio.
Menin HETs show increased liver TG
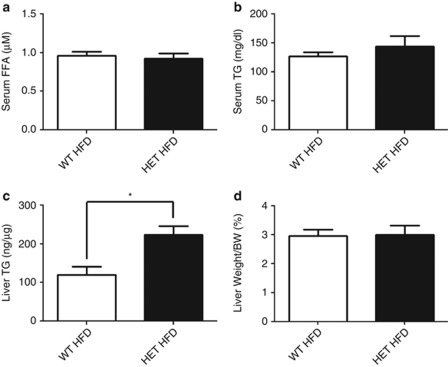
HFD is known to cause alterations of the lipid profile in mice in association with metabolic syndrome.17, 18 As serum hormones are elevated, serum TG and free fatty acid levels were examined. There was no evidence of increased serum-free fatty acids or TG between the WT and HETs on HFD (Figures 3a and b). However, a significant increase in the level of liver tissue TG was observed with no change in liver weight between the groups (Figures 3c and d). These findings indicate that loss of menin does have a protective role in the liver in the regulation of diet-induced triglyceride accumulation, consistent with a recent report using the acute hepatic knockdown of menin.19
Figure 3.
Measurement of free fatty acids (FFA) and TG in HET versus WT mice on HFD. (a) Serum FFA. (b) Serum TG. (c) Liver TG as ng/μg of tissue significantly increased in HET mice versus WT; *P<0.0427. (d) Liver weight as a percentage of body weight in HET versus WT mice.
Increased hepatic steatosis in HET mice compared with WT counterparts
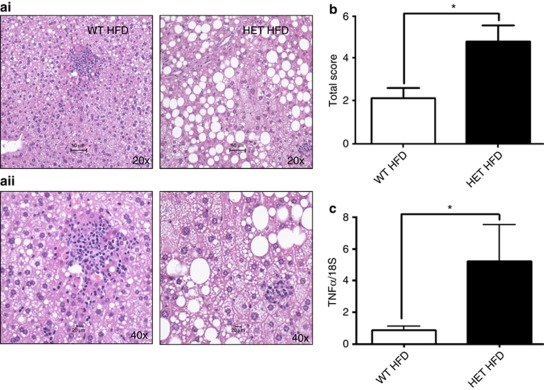
As the HETs exhibited increase in liver TG and knowing that HFD contributes significantly to the development of non-alcoholic fatty liver disease, which can progress to NASH,20, 21 livers were harvested and histologically analyzed. HET mice on HFD have increased liver-fat droplets characterized by large size vacuoles compared with WT (Figure 4a). Using a previously described method of NASH scoring,9 it was determined that the total NASH score of the HET mice on HFD was significantly higher than WT counterparts on HFD (Figure 4b). As NASH is associated with hepatic inflammation, the messenger RNA (mRNA) of TNFα in the liver of the WT and HETs on HFD was measured. Higher TNFα levels in the HET mice on HFD compared with WT were observed, signifying a significant increase of inflammation in the livers of the HET mice (Figure 4c).
Figure 4.
Liver steatosis and increased inflammation in HET mice. (ai) Representative liver histology at × 20 magnification. (aii) Representative liver histology at × 40 magnification. (b) Total NASH score; *P<0.0220. (c) Quantitative real-time PCR (qRT-PCR) analysis of TNFα *P<0.0447.
HET mice show increased markers of stress, HGP and lipogenesis in the liver
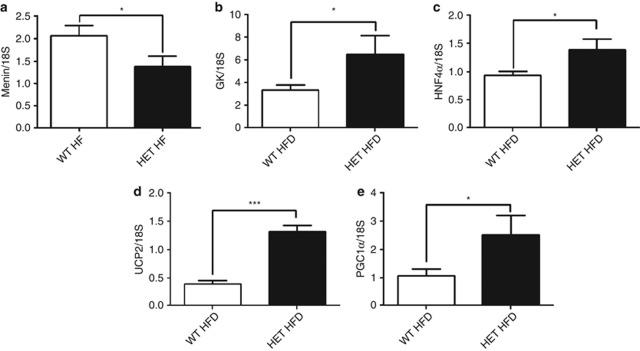
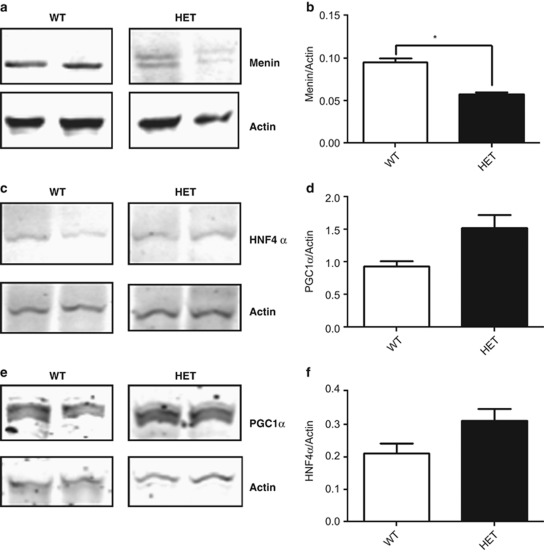
In Figures 5a there are significant decreases in the mRNA and protein expression of menin in the liver of HET mice. To further investigate what contribution decrease in hepatic menin has on markers implicated in metabolic syndrome under the metabolic stress of 3 months on HFD, factors were analyzed that are involved in oxidative stress and regulation of HGP, which have both been shown to be increased in HFD conditions.17, 22 GK is a key regulatory enzyme responsible for converting glucose to glucose-6-phosphate, which subsequently undergoes glycolysis and lipogenesis in the liver.7, 8 GK is significantly increased in HET mice (Figure 5b), consistent with observations in diabetic patients and patients with fatty liver.8 Hepatic nuclear factor 4 α (HNF4α), an orphan nuclear receptor, shows increased expression at both the mRNA and protein levels in HET mice compared with WT (Figures 5c). This could account for the increased expression of GK as HNF4α is a known positive regulator of GK expression.23, 24, 25, 26 UCP2, an inner mitochondrial membrane protein, has been shown to be increased in pathology such as NASH and type 2 diabetes.27, 28, 29 A significant increase is observed in UCP2 in HET mice on HFD compared with WT HFD-fed counterparts (Figure 5d). As peroxisome PGC1α has been shown to be a regulator of UCP2 expression,30 the mRNA and protein expression of PGC1α was investigated and found it to be significantly increased at the mRNA level and trending toward an increase at the protein level in HET mice compared with WT (Figures 5e). PGC1α has other well-known functions in metabolism such as regulation of factors involved in gluconeogenesis in concert with HNF4α.26, 31
Figure 5.
qRT-PCR analysis of hepatic tissue from HET and WT mice. (a) Menin mRNA expression; *P<0.0484. (b) GK mRNA expression; *P<0.0384. (c) HNF4α mRNA expression; *P<0.0331. (d) UCP2 mRNA expression; ***P<0.0001. (e) PGC1α mRNA expression; *P<0.0154.
Discussion
The menin liver-specific complete knockout has previously been shown to be void of tumors; however, no studies were undertaken on the metabolic phenotype of these mice.32 We have shown previously that HET mice on normal chow do have metabolic perturbations compared with WT counterparts.4 When challenged with HFD, HET mice exhibited increased weight gain compared with WT, indicating that hepatic menin does have a systemic effect on the response of these mice to high fat challenge. We have also shown that these mice exhibit insulin resistance with increased glucose intolerance during glucose tolerance testing (Figure 1d). This decreased glucose tolerance is indicative of a more severe metabolic phenotype,33 and with the liver being a main regulator of insulin clearance,34 this finding therefore implicates hepatic menin as having a role in regulating whole body glucose homeostasis. It has been previously shown that menin levels fluctuate with high fat challenge and the mice show an increased hepatic steatosis.19 As the results confirm that finding in this study, we have expanded on this fact through a total metabolic profile showing a systemic effect of menin loss in the liver. Also, the results show a chronic effect of menin loss as opposed to acute loss, implicating menin both as an acute and chronic regulator of the metabolic state in the liver.
To further our understanding of the phenotype of these mice, we examined levels of serum hormones commonly deregulated in metabolic syndrome. Mice with prolonged exposure to HFD commonly exhibit hyperglycemia;35 however, this consequence is exacerbated and significantly higher in the HET mice (Figure 2a). This and the increase in other serum markers indicate that HET mice are showing a decreased ability to clear glucose from the system compared with WT mice fed HFD, enforcing that the loss of hepatic menin affects systemic glucose homeostasis. Furthermore, the HET mice show significant increases in serum insulin concentration and increased C-peptide (Figures 2b and d), both of which are indicative of insulin resistance and increased insulin secretion owing to hyperglycemia.7, 16
Glucagon secreted from the pancreas regulates HGP in the fasted state causing increased gluconeogenesis and glycogenolysis in the liver, and increased lipolysis in adipose tissue.22, 36, 37 Hyperglucagonemia has been implicated in hyperglycemia in models of metabolic syndrome because of its regulatory role in HGP. HET mice exhibit significantly increased levels of serum glucagon consistent with the changes observed in mice with high HGP. Previously, our lab has shown that the loss of hepatic menin in mice fed normal chow have increased markers of HGP and downstream targets of FoxO1, a main regulator of the switch between fasting and feeding.4, 5, 38, 39 Hypertriglyceridemia is also a consequence of HFD that contributes to the pathogenesis of type 2 diabetes and metabolic syndrome through increased de novo production of TG in the liver.8, 40 Although we do not see high serum TG or free fatty acids, we do see a significant increase of TG in the liver (Figure 3c) between the two groups.
Liver histology clearly shows differences in the phenotypes of HET mice compared with WT mice. WT mice fed HFD for 3 months show microsteatosis and inflammatory infiltrate, but this is to a much greater degree in HET mice on HFD (Figure 4a). The macrosteatosis and increased inflammation we see in the HET mice (Figures 4a–c) implicates menin as a protective protein for high-fat diet challenge. Indeed, the gene expression profile in HET mice challenged on HFD shows increased markers of hepatic metabolism such as GK, the enzyme responsible for converting glucose to glucose-6-phosphate, which is also a regulator of hepatic lipogenesis, glycolysis and glycogen synthesis.8 Hepatic GK gene expression has been associated with increased hepatic lipid content, which is consistent with what we observe in our HET mice. GK gene expression is dependent on insulin signaling along with glucose concentration, but it is also regulated by factors such as HNF4α.23 As we show in this study, HNF4α expression is increased in HET mice on HFD (Figures 5c). This factor has been implicated in regulation of many genes involved in lipogenesis and HGP.31, 41 It has also been cited as a cofactor working with PGC1α to regulate gluconeogenic genes.42 PGC1α is a master regulator of mitochondrial biogenesis, and when upregulated its expression is associated with increased expression of protective genes such as UCP2.30, 43 PGC1α is also a direct transcriptional regulator of UCP2, which is a mitochondrial protein responsible for inhibiting increases in membrane potential under the conditions of low adenosine diphosphate which, in turn, decreases reactive oxygen species production.29 UCP2 has been implicated in the pathogenesis of NASH and non-alcoholic fatty liver disease.20, 21, 28, 29 The phenotype of our Men1 HET mice on a HFD suggest that menin has a role in mediating the expression of these important metabolically related proteins and factors described above. In conclusion, menin in the liver is a metabolic protein that functions to regulate genes involved in HGP, lipogenesis and steatosis in response to HFD.
Figure 6.
Western blotting analysis of hepatic tissue from HET and WT mice. (a) Menin protein. (b) Quantification of menin protein versus actin; *P<0.0205. (c) HNF4α protein. (d) Quantification of HNF4α versus actin. (e) PGC1α protein. (f) Quantification of PGC1α versus actin.
Acknowledgments
We thank the University of Toledo for their institutional funding responsible for this research. We also thank Dr MK Kaw for her technical assistance with liver histology.
The authors declare no conflict of interest.
References
- Balogh K, Patócs A, Hunyady L, Rácz K. Menin dynamics and functional insight: take your partners. Mol Cell Endocrinol. 2010;326:80–84. doi: 10.1016/j.mce.2010.04.011. [DOI] [PubMed] [Google Scholar]
- van Wijk JPH, Dreijerink KMA, Pieterman CRC, Lips CJM, Zelissen PMJ, Valk GD. Increased prevalence of impaired fasting glucose in MEN1 gene mutation carriers. Clin Endocrinol. 2012;76:67–71. doi: 10.1111/j.1365-2265.2011.04166.x. [DOI] [PubMed] [Google Scholar]
- McCallum RW, Parameswaran V, Burgess JR. Multiple endocrine neoplasia type 1 (MEN 1) is associated with an increased prevalence of diabetes mellitus and impaired fasting glucose. Clin Endocrinol (Oxf) 2006;65:163–168. doi: 10.1111/j.1365-2265.2006.02563.x. [DOI] [PubMed] [Google Scholar]
- Wuescher L, Angevine K, Hinds T, Ramakrishnan S, Najjar SM, Mensah-Osman EJ. Insulin regulates menin expression, cytoplasmic localization, and interaction with FOXO1. Am J Physiol Endocrinol Metab. 2011;301:E474–E483. doi: 10.1152/ajpendo.00022.2011. [DOI] [PMC free article] [PubMed] [Google Scholar]
- Liu Y, Dentin R, Chen D, Hedrick S, Ravnskjaer K, Schenk S, et al. A fasting inducible switch modulates gluconeogenesis via activator/coactivator exchange. Nature. 2008;456:269–273. doi: 10.1038/nature07349. [DOI] [PMC free article] [PubMed] [Google Scholar]
- Estall JL, Kahn M, Cooper MP, Fisher FM, Wu MK, Laznik D, et al. Sensitivity of lipid metabolism and insulin signaling to genetic alterations in hepatic peroxisome proliferator-activated receptor-gamma coactivator-1alpha expression. Diabetes. 2009;58:1499–1508. doi: 10.2337/db08-1571. [DOI] [PMC free article] [PubMed] [Google Scholar]
- Agius L. New hepatic targets for glycaemic control in diabetes. Best Pract Res Clin Endocrinol Metab. 2007;21:587–605. doi: 10.1016/j.beem.2007.09.001. [DOI] [PubMed] [Google Scholar]
- Peter A, Stefan N, Cegan A, Walenta M, Wagner S, Königsrainer A, et al. Hepatic glucokinase expression is associated with lipogenesis and fatty liver in humans. J Clin Endocrinol Metab. 2011;96:E1126–E1130. doi: 10.1210/jc.2010-2017. [DOI] [PubMed] [Google Scholar]
- Kleiner DE, Brunt EM, Van Natta M, Behling C, Contos MJ, Cummings OW, et al. Design and validation of a histological scoring system for nonalcoholic fatty liver disease. Hepatology. 2005;41:1313–1321. doi: 10.1002/hep.20701. [DOI] [PubMed] [Google Scholar]
- Hart BL. Biological basis of the behavior of sick animals. Neurosci Biobehav Rev. 1988;12:123–137. doi: 10.1016/s0149-7634(88)80004-6. [DOI] [PubMed] [Google Scholar]
- Dos Santos N, Waterhouse D, Masin D, Tardi PG, Karlsson G, Edwards K, et al. Substantial increases in idarubicin plasma concentration by liposome encapsulation mediates improved antitumor activity. J Control Release. 2005;105:89–105. doi: 10.1016/j.jconrel.2005.03.007. [DOI] [PubMed] [Google Scholar]
- Kahn SE, Hull RL, Utzschneider KM. Mechanisms linking obesity to insulin resistance and type 2 diabetes. Nature. 2006;444:840–846. doi: 10.1038/nature05482. [DOI] [PubMed] [Google Scholar]
- Stumvoll M, Goldstein BJ, van Haeften TW. Type 2 diabetes: principles of pathogenesis and therapy. Lancet. 2005;365:1333–1346. doi: 10.1016/S0140-6736(05)61032-X. [DOI] [PubMed] [Google Scholar]
- Tura A, Ludvik B, Nolan JJ, Pacini G, Thomaseth K. Insulin and C-peptide secretion and kinetics in humans: direct and model-based measurements during OGTT. Am J Physiol Endocrinol Metab. 2001;281:E966–E974. doi: 10.1152/ajpendo.2001.281.5.E966. [DOI] [PubMed] [Google Scholar]
- Meier JJ, Holst JJ, Schmidt WE, Nauck MA. Reduction of hepatic insulin clearance after oral glucose ingestion is not mediated by glucagon-like peptide 1 or gastric inhibitory polypeptide in humans. Am J Physiol Endocrinol Metab. 2007;293:E849–E856. doi: 10.1152/ajpendo.00289.2007. [DOI] [PubMed] [Google Scholar]
- Shanik MH, Xu Y, Škrha J, Dankner R, Zick Y, Roth J. Insulin resistance and hyperinsulinemia. Diabetes Care. 2008;31 (Supplement 2:S262–S268. doi: 10.2337/dc08-s264. [DOI] [PubMed] [Google Scholar]
- Dey A, Chandrasekaran K. Hyperglycemia induced changes in liver: in vivo and in vitro studies. Curr Diabetes Rev. 2009;5:67–78. doi: 10.2174/157339909788166864. [DOI] [PubMed] [Google Scholar]
- Rossmeisl M, Rim JS, Koza RA, Kozak LP. Variation in type 2 diabetes—related traits in mouse strains susceptible to diet-induced obesity. Diabetes. 2003;52:1958–1966. doi: 10.2337/diabetes.52.8.1958. [DOI] [PubMed] [Google Scholar]
- Cheng P, Yang SS, Hu XG, Zhou XY, Zhang YJ, Jin G, et al. Menin prevents liver steatosis through co-activation of peroxisome proliferator-activated receptor alpha. FEBS Lett. 2011;585:3403–3408. doi: 10.1016/j.febslet.2011.09.043. [DOI] [PubMed] [Google Scholar]
- Yeh MM, Brunt EM. Pathology of nonalcoholic fatty liver disease. Am J Clin Pathol. 2007;128:837–847. doi: 10.1309/RTPM1PY6YGBL2G2R. [DOI] [PubMed] [Google Scholar]
- Farrell GC, Larter CZ. Nonalcoholic fatty liver disease: from steatosis to cirrhosis. Hepatology. 2006;43 (2 Suppl 1:S99–S112. doi: 10.1002/hep.20973. [DOI] [PubMed] [Google Scholar]
- Ali S, Drucker DJ. Benefits and limitations of reducing glucagon action for the treatment of type 2 diabetes. Am J Physiol Endocrinol Metab. 2009;296:E415–E421. doi: 10.1152/ajpendo.90887.2008. [DOI] [PubMed] [Google Scholar]
- Hirota K, Sakamaki J, Ishida J, Shimamoto Y, Nishihara S, Kodama N, et al. A combination of HNF-4 and Foxo1 is required for reciprocal transcriptional regulation of glucokinase and glucose-6-phosphatase genes in response to fasting and feeding. J Biol Chem. 2008;283:32432–32441. doi: 10.1074/jbc.M806179200. [DOI] [PubMed] [Google Scholar]
- Ganjam GK, Dimova EY, Unterman TG, Kietzmann T. FoxO1 and HNF-4 are involved in regulation of hepatic glucokinase gene expression by resveratrol. J Biol Chem. 2009;284:30783–30797. doi: 10.1074/jbc.M109.045260. [DOI] [PMC free article] [PubMed] [Google Scholar]
- Roth U, Jungermann K, Kietzmann T. Activation of glucokinase gene expression by hepatic nuclear factor 4alpha in primary hepatocytes. Biochem J. 2002;365:223–228. doi: 10.1042/BJ20020340. [DOI] [PMC free article] [PubMed] [Google Scholar]
- Schmidt SF, Mandrup S. Gene program-specific regulation of PGC-1α activity. Genes Dev. 2011;25:1453–1458. doi: 10.1101/gad.2076411. [DOI] [PMC free article] [PubMed] [Google Scholar]
- Ruiz-Ramírez A, Chávez-Salgado M, Peñeda-Flores JA, Zapata E, Masso F, El-Hafidi M. High-sucrose diet increases ROS generation, FFA accumulation, UCP2 level, and proton leak in liver mitochondria. Am J Physiol Endocrinol Metab. 2011;301:E1198–E1207. doi: 10.1152/ajpendo.00631.2010. [DOI] [PubMed] [Google Scholar]
- Jiang Y, Zhang H, Dong L-y, Wang D, An W. Increased hepatic UCP2 expression in rats with nonalcoholic steatohepatitis is associated with upregulation of Sp1 binding to its motif within the proximal promoter region. J Cell Biochem. 2008;105:277–289. doi: 10.1002/jcb.21827. [DOI] [PubMed] [Google Scholar]
- Serviddio G, Bellanti F, Tamborra R, Rollo T, Capitanio N, Romano AD, et al. Uncoupling protein-2 (UCP2) induces mitochondrial proton leak and increases susceptibility of non-alcoholic steatohepatitis (NASH) liver to ischaemia–reperfusion injury. Gut. 2008;57:957–965. doi: 10.1136/gut.2007.147496. [DOI] [PubMed] [Google Scholar]
- Wu Z, Puigserver P, Andersson U, Zhang C, Adelmant G, Mootha V, et al. Mechanisms controlling mitochondrial biogenesis and respiration through the thermogenic coactivator PGC-1. Cell. 1999;98:115–124. doi: 10.1016/S0092-8674(00)80611-X. [DOI] [PubMed] [Google Scholar]
- Rhee J, Ge H, Yang W, Fan M, Handschin C, Cooper M, et al. Partnership of PGC-1α and HNF4α in the regulation of lipoprotein metabolism. J Biol Chem. 2006;281:14683–14690. doi: 10.1074/jbc.M512636200. [DOI] [PubMed] [Google Scholar]
- Scacheri PC, Crabtree JS, Kennedy AL, Swain GP, Ward JM, Marx SJ, et al. Homozygous loss of menin is well tolerated in liver, a tissue not affected in MEN1. Mamm Genome. 2004;15:872–877. doi: 10.1007/s00335-004-2395-z. [DOI] [PubMed] [Google Scholar]
- Simeon IT. Deconstructing type 2 diabetes. Cell. 1999;97:9–12. doi: 10.1016/s0092-8674(00)80709-6. [DOI] [PubMed] [Google Scholar]
- Duckworth WC, Bennett RG, Hamel FG. Insulin degradation: progress and potential. Endocr Rev. 1998;19:608–624. doi: 10.1210/edrv.19.5.0349. [DOI] [PubMed] [Google Scholar]
- Winzell MS, Ahren B. The high-fat diet-fed mouse: a model for studying mechanisms and treatment of impaired glucose tolerance and type 2 diabetes. Diabetes. 2004;53 (Suppl 3:S215–S219. doi: 10.2337/diabetes.53.suppl_3.s215. [DOI] [PubMed] [Google Scholar]
- Heppner KM, Habegger KM, Day J, Pfluger PT, Perez-Tilve D, Ward B, et al. Glucagon regulation of energy metabolism. Physiol Behav. 2010;100:545–548. doi: 10.1016/j.physbeh.2010.03.019. [DOI] [PubMed] [Google Scholar]
- Jiang G, Zhang BB. Glucagon and regulation of glucose metabolism. Am J Physiol Endocrinol Metab. 2003;284:E671–E678. doi: 10.1152/ajpendo.00492.2002. [DOI] [PubMed] [Google Scholar]
- Gross DN, Wan M, Birnbaum MJ. The role of FOXO in the regulation of metabolism. Curr Diab Rep. 2009;9:208–214. doi: 10.1007/s11892-009-0034-5. [DOI] [PubMed] [Google Scholar]
- Haeusler RA, Kaestner KH, Accili D. FoxOs function synergistically to promote glucose production. J Biol Chem. 2010;285:35245–35248. doi: 10.1074/jbc.C110.175851. [DOI] [PMC free article] [PubMed] [Google Scholar]
- Leavens KF, Easton RM, Shulman GI, Previs SF, Birnbaum MJ. Akt2 is required for hepatic lipid accumulation in models of insulin resistance. Cell Metab. 2009;10:405–418. doi: 10.1016/j.cmet.2009.10.004. [DOI] [PMC free article] [PubMed] [Google Scholar]
- Oiso H, Furukawa N, Suefuji M, Shimoda S, Ito A, Furumai R, et al. The role of class I histone deacetylase (HDAC) on gluconeogenesis in liver. Biochem Biophys Res Commun. 2011;404:166–172. doi: 10.1016/j.bbrc.2010.11.086. [DOI] [PubMed] [Google Scholar]
- Yoon JC, Puigserver P, Chen G, Donovan J, Wu Z, Rhee J, et al. Control of hepatic gluconeogenesis through the transcriptional coactivator PGC-1. Nature. 2001;413:131–138. doi: 10.1038/35093050. [DOI] [PubMed] [Google Scholar]
- Oberkofler H, Klein K, Felder TK, Krempler F, Patsch W. Role of peroxisome proliferator-activated receptor-gamma coactivator-1alpha in the transcriptional regulation of the human uncoupling protein 2 gene in INS-1E cells. Endocrinology. 2006;147:966–976. doi: 10.1210/en.2005-0817. [DOI] [PubMed] [Google Scholar]


