Abstract
The Ts65Dn mouse displays several phenotypic abnormalities that parallel characteristics found in Down syndrome. One important characteristic associated with Down syndrome is an increased incidence of early-onset Alzheimer’s disease. Since Alzheimer’s disease is characterized largely by progressive memory loss, it is of interest to study working memory in the Ts65Dn mouse. Previous research in our lab using a titrating, delayed matching-to-position schedule of reinforcement has demonstrated that young, adult male Ts65Dn mice do not display a working memory deficit when compared to age-matched littermate controls. However, there have been no studies examining the working memory of these mice as they age. Due to the correlation between Down syndrome and Alzheimer’s disease, and as part of a larger effort to further characterize the phenotype of the Ts65Dn mouse, the purpose of this study was to determine whether aged Ts65Dn mice possess a working memory deficit when compared to age-matched littermate controls.
In order to study working memory, two groups of mice were trained under a titrating, delayed matching-to-position schedule of reinforcement. The first group was trained beginning at 3 months of age, and the second group began training at 15 months of age. Both groups were studied to 24 months of age. Initially, both groups of Ts65Dn mice performed at a lower level of accuracy than the control mice; however, this difference disappeared with further practice. The results from these lifespan studies indicate that the aged Ts65Dn mouse does not possess a working memory deficit when compared to age-matched controls.
Keywords: Ts65Dn, Down syndrome, Memory, Matching-to-position, Lifespan
1. Introduction
Down syndrome, a condition resulting from the presence of three copies of chromosome 21, is the most common genetic cause of mental retardation, occurring in approximately 1 out of every 700 live births [4]. Individuals with Down syndrome possess a range of phenotypic characteristics, including craniofacial abnormalities, muscle hypotonia, and an increased susceptibility to infection. In addition, perhaps the most striking consequence of an extra copy of chromosome 21 is the mental retardation that, although varying in degree, is universally present in individuals with Down syndrome. This mental retardation is manifested clinically by impaired learning and memory [see reviews: 29,41]. Patients with Down syndrome also display an increased incidence of early-onset Alzheimer’s disease, with almost all patients over the age of 35 displaying characteristic Alzheimer-like neuropathology [see reviews: 2,41].
Experimental animal models are a useful resource for studying many human conditions. Mouse models in particular offer a unique perspective due to the many metabolic and anatomical similarities between mouse and human. The relatively short lifespan and short generation time of the mouse also make these animals an excellent choice in the laboratory. Perhaps more importantly for studying human aneuploid conditions, however, is the considerable genetic similarity between the two species. Specifically, substantial homology exists between human chromosome 21 (HSA21) and mouse chromosomes 10, 16, and 17, with the majority of the conserved segments found on mouse chromosome 16 (MMU16) [21,38]. The Ts65Dn mouse, developed by Muriel Davisson at The Jackson Laboratory, has a partial trisomy of MMU16. In these mice, 80% of the genes conserved between MMU16 and HSA21 are found in triplicate. Because of this high degree of homology, the Ts65Dn is generally considered the best animal model of Down syndrome [1,10]. In addition, these mice display several phenotypic abnormalities which parallel those found in humans with Down syndrome. These abnormalities include developmental delays, hyperactivity [11], craniofacial malformations [33], motor dysfunction [6], and learning deficits [18,35,40].
Working memory can be defined as a temporary system for maintaining and manipulating information; more simply, it is the memory required to perform accurately on a specific task. Some studies have reported working memory deficits in individuals with Down syndrome [25,30]. Thus, in an effort to further characterize the phenotype of the Ts65Dn mouse, it is of interest to determine whether these mice also possess working memory deficits. Several methods have been developed to study working memory in laboratory animals. One of the most widely used methods is the Morris water maze, in which the subjects are placed in a tank of water and required to remember the location of a platform hidden under the surface of the water. Studies in the Ts65Dn mouse using the Morris water maze have suggested that these mice do indeed possess working memory deficits [19,22]. However, the Morris water maze may not be the most appropriate method for studying memory, particularly in the Ts65Dn mouse. Not only can the water maze produce increased levels of stress, which in turn may adversely affect performance, but Ts65Dn mice have demonstrated both slower swimming speeds and significant thigmotaxis (swimming around the perimeter of the water tank), which may make interpretation of results difficult [6,18].
Behavior can be studied using operant conditioning procedures, which are based on the principle that responses (behavior) are controlled by their consequences. Although it can take a considerable amount of time to train animals under operant procedures, operant conditioning provides several advantages over other methods. Not only can animals be studied without the use of aversive stimuli, but testing can be performed on the same animals for extended periods of time (months or even years). The schedule of reinforcement used to study working memory in these experiments is a titrating delayed matching-to-position schedule, a modification of the delayed matching-to-sample method developed for use in pigeons [3]. Under this schedule, the animal is required to remember a response position during a delay period and respond at that same position (‘match’) following the delay. A previous study in our lab using this schedule demonstrated that young (3–6 month old) Ts65Dn mice do not show a working memory deficit when compared to littermate controls. Though initially there appeared to be a deficit in the Ts65Dn mice, the discrepancy in performance between the two groups disappeared with further training [17].
The current study represents the first longitudinal study of working memory in the Ts65Dn mouse, which is important for a number of reasons. First, little is known about the cognitive abilities of these mice as they age, and in humans, memory loss is a frequently reported side effect of age. Second, there is a decided link between Down syndrome and Alzheimer’s disease. Multiple studies have demonstrated that virtually every person with Down syndrome will eventually display the characteristic neuropathology of Alzheimer’s disease [9,24,42,43, see review: 26]. Though the Ts65Dn mouse does not exhibit amyloid plaques or neurofibrillary tangles, they do show an age-related degradation of basal forebrain cholinergic neurons (BFCN), similar to that seen in Alzheimer’s disease [5,20,27,36]. This leads to our hypothesis that an accelerated decline in working memory, compared to their euploid littermates, will be observed in Ts65Dn mice as they age. Thus, the purpose of the studies reported here was to determine whether an age-related deficit in working memory is present in the Ts65Dn mouse.
2. Materials and methods
2.1 Animals
Twenty-five male Ts65Dn mice and twenty-five male littermate control (LC) mice were obtained from The Jackson Laboratories (Bar Harbor, ME). All mice were genotyped and screened for retinal degeneration before being shipped. Beginning at approximately 3 months of age, animals were housed individually and maintained on a 12-hour light/dark cycle. The animals were given water ad libitum and food deprived to 85% of their free-feeding weights.
2.2 Apparatus
Subjects were tested in four Med Associates (St. Albans, VT) Modular Mouse Test Chambers (ENV-307A), which were housed in sound- and light-attenuating enclosures (Med Assoc., St. Albans, VT). On the front wall of each chamber there was a center dipper hole, which provided access to a 0.01 ml dipper of evaporated milk. Also on the front wall were two nose-poke holes (NPH), equally spaced on either side of the center dipper hole. There was a third NPH on the back wall of the chamber, directly opposite the front dipper hole. Each NPH (including the dipper hole) could be illuminated by an LED, and each had a beam of infrared light crossing horizontally in front of the LED. A response was recorded when a mouse inserted its nose into the NPH, interrupting the infrared beam. An audible click sounded with each response as a means of feedback. Each chamber was illuminated by a 28 V DC bulb, and equipped with a model SC628H Sonalert in series with a 100 Ω resistor that sounded a tone when incorrect responses were made.
2.3 Behavioral testing
The mice were separated into two groups: Group 1 consisted of 24 mice (12 Ts65Dn and 12 LC), while Group 2 consisted of 26 mice (13 Ts65Dn and 13 LC). At approximately 4 months of age, the mice in Group 1 began response acquisition training. The mice in Group 2 were kept under the same environmental conditions as the mice in Group 1 (food deprivation, daily handling, etc.), but did not begin response acquisition training until 15 months of age. The behavioral testing was conducted five days a week, Monday through Friday, from approximately 8:00 A.M. to 5:00 P.M. All mice were sacrificed after the conclusion of the study or if they became moribund. Data for those mice that expired or were sacrificed prior to the end of the study were included up until the point of death; in cases where the behavior declined precipitously prior to death, data were included up until the point of decline.
Initially, the animals underwent response acquisition training, in which they learned to respond in the test chamber. Under response acquisition training, each training session lasted for 30 minutes or until 50 reinforcers were delivered. During the first session of response acquisition training, an alternative fixed-ratio 1, fixed-time 60 second (alt FR1 FT60) schedule of reinforcement was utilized. Under this schedule, the mouse was reinforced (presented with a dipperful of evaporated milk) after each response on the dipper hole or after a 60-second period of no responding. During the second session, the schedule was changed to fixed-ratio 1 (FR1), such that the animals were reinforced for each response on the dipper hole. In the third and fourth sessions, the animals were reinforced only for responding on the left front NPH; in the third session, the animals were reinforced for every response (FR1) on the left NPH, while in the fourth session, they were reinforced for every 3rd response (FR3) on the left NPH. In the fifth and sixth sessions, the animals were reinforced for completing a FR3 on the right NPH. During the seventh and eighth sessions, the animals were reinforced for responding on the back NPH; in session seven, they were reinforced for every completion of a FR3, while in the eighth session, the fixed-ratio requirement was increased to 10 (FR10). For the next two sessions, the schedule of reinforcement was a FR10 random; i.e. within each session, the animals were reinforced for completing a FR10 on a randomly selected NPH (left, right, or back). Response acquisition training was considered complete when the animals could earn at least 10 reinforcers per session on two consecutive sessions on the FR10 random schedule.
Once the animals had completed response acquisition training, they were trained under a matching-to-position (MTP) schedule of reinforcement as previously described [17]. Under this schedule, each session lasted for 60 minutes or 50 trials, whichever came first. At the start of each trial, either the left or the right (randomly selected) front NPH was illuminated and the animal had to complete a fixed-ratio 5 (FR5) at that NPH. Upon completion of the FR5, the LED illuminating that NPH was extinguished, the back NPH was illuminated, and a delay period began. The first response at the back NPH after the delay period had elapsed extinguished the LED illuminating the back NPH and illuminated both left and right front NPH. If the animal responded at the same front NPH as before the delay (a ‘match’), the animal was reinforced with 5-second access to the dipper of evaporated milk. If the animal responded at the opposite front NPH (a ‘non-match’), a tone sounded, initiating a 5-second time-out period during which all lights in the chamber were extinguished. Following the time-out period the animal had to repeat that trial.
Initially, the mice were trained using a fixed 3-second delay period. However, using a fixed delay can be problematic. If a delay is selected that is too short, the animals will encounter a ‘ceiling effect’, under which they get 95–100% correct. At such a high level of accuracy, it is difficult to demonstrate improvement. If a delay is selected that is too long, accuracy will approach 50%, which in a 2-choice procedure is difficult to distinguish from chance. Hence, a titrating delay was implemented. Under the titrating schedule, the delay remained fixed at 3 seconds for the first five trials of each session. On the sixth and all subsequent trials, the length of the delay was determined by the performance on the preceding five trials. If the animal made the correct choice (‘match’) on 5 out of the 5 previous trials, the delay increased by 3 seconds for the next trial. If the animal made the correct choice on 4 out of the 5 previous trials, the delay remained the same for the next trial. If the animal made the correct choice on 3 or less out of the previous 5 trials, the delay decreased by 3 seconds for the next trial, with a minimum delay of 3 seconds. This procedure kept each animal performing at approximately 80% accuracy, which has two advantages: first, the task difficulty is standardized across subjects, and second, variation among subjects in milk presentation frequency during test sessions is reduced.
The Group 1 mice began response acquisition training at 4 months of age. After 3–4 weeks of training, when the mice were approximately 5 months old, they were started on the MTP schedule with a 3-second fixed delay period. At approximately 7 months of age, the titration schedule was implemented; however, due to an error in setting the variables in the MTP program, the titration began with a 1-second titration step (the amount by which the delay increased or decreased) rather than a 3-second step. By the time this error was discovered and the Group 1 mice were started on the full (3-second titration step) schedule, they were approximately 9 months of age.
The Group 2 mice began response acquisition training at 15 months of age. After 2–3 weeks of training, when the mice were approximately 16 months old, they were started on the MTP schedule with a 3-second fixed delay period. At approximately 17 months of age, the titration schedule was implemented with a 3-second titration step.
2.4 Drug administration
These studies were part of a larger study to examine the effects of purported cognitive enhancers on working memory. As part of this larger study, several drugs were administered at certain points in the lives of the animals. Although these drug studies will be reported in future publications, it is important to mention them here, as the drug history may have impacted the results of the study. The mice in Group 1 received drug for two sets of dose-response curves, one set administered from 10–15 months of age, and a second set from 18–23 months of age. The Group 2 mice were only administered drug for one set of dose-response curves, from 18–23 months of age. In each round of dose-response curves, four drugs were administered (expressed as their respective salts, except for rolipram), in the following order: d-amphetamine sulfate (0.1–10 mg/kg), donepezil hydrochloride (0.3–5.6 mg/kg), memantine hydrochloride (0.3–30 mg/kg), and rolipram (0.03–1 mg/kg). Thus, for Group 1, amphetamine was given at 10 months and again at 18 months, donepezil was given at 11 months and 19 months, memantine was given at 12 months and 21 months, and rolipram was given at 14 months and 22 months of age. For Group 2 mice, amphetamine was given at 18 months, donepezil at 19 months, memantine at 21 months, and rolipram at 22 months of age. For both Group 1 and Group 2 mice, at 23 months of age an acute dose-response curve for pentylenetetrazole (1–30 mg/kg) was determined. Following this acute dose-response curve, both groups underwent chronic administration of pentylenetetrazole as follows: 3 mg/kg administered daily for approximately three weeks, followed by one week without drug, then 10 mg/kg administered daily for approximately three weeks.
2.5 Data collection and statistical analyses
In order to determine how memory changed over the lifespan of these mice, several performance parameters were examined. Under initial training conditions, when the animals were subjected to a fixed 3-second delay, the percent matching accuracy per session was the main parameter of interest. Once the delay titration was implemented, several other endpoints were collected for each test session: overall session rate of responding (measured in responses per second, this was the rate at which the animals responded at the sample stimulus during the FR5 components), total number of trials completed per session, length of mean delay (measured in seconds, this was the sum of the delays for each trial divided by the number of trials), length of max delay (also measured in seconds, this was the longest delay reached in a session), and the total number of reinforcers earned. Due to the way the titration procedure was structured, the percent accuracy remained fairly constant (~80%), but this parameter was recorded nevertheless to ensure that was the case. Because the purpose of the study was to examine working memory, the main parameter of interest was the length of the mean delay per session, since it measured how long the animals could remember the correct position for a given trial.
As a result of the vast amount of data generated over the lifespan of these animals, the data were analyzed as follows: for data presented daily, the data for each mouse line were simply the means of data from the individual mice in the respective line; for data presented weekly, the data were means of individual mouse data from the respective line collected on Thursdays of the given week; for data presented monthly, the data were first averaged from individual mouse data collected on Thursdays of each month, and then the mean of the Thursday data was determined to provide a value for that month. Data from Thursdays was used due to the fact that during the administration of acute dose response curves, drug was administered on Tuesdays and Fridays; Thursday was neither a drug administration day nor a day immediately following drug administration. Thus, the data collected on Thursdays should not have been influenced by acute drug administration. Data collection for the current study ended prior to the initiation of chronic drug administration. The data were analyzed using a repeated measures general linear model, as a result of which each data point is presented as the least square mean. Statistical significance was determined using a two-way repeated measures ANOVA followed by a post hoc Tukey test.
3. Results
3.1 Group 1 mice
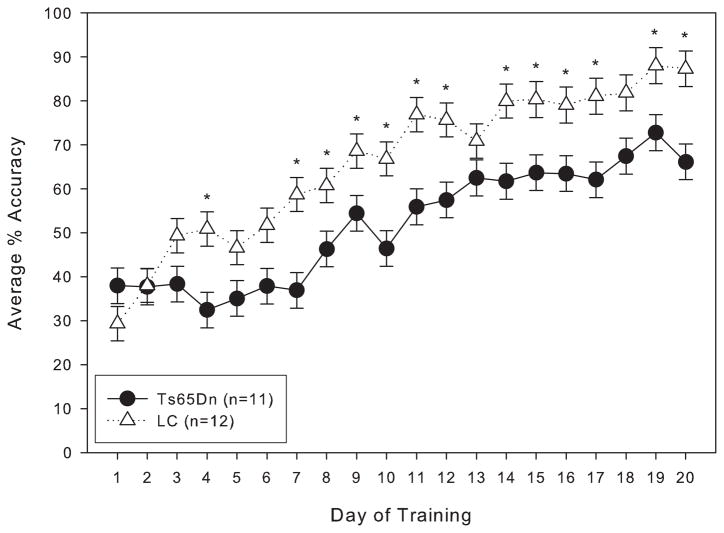
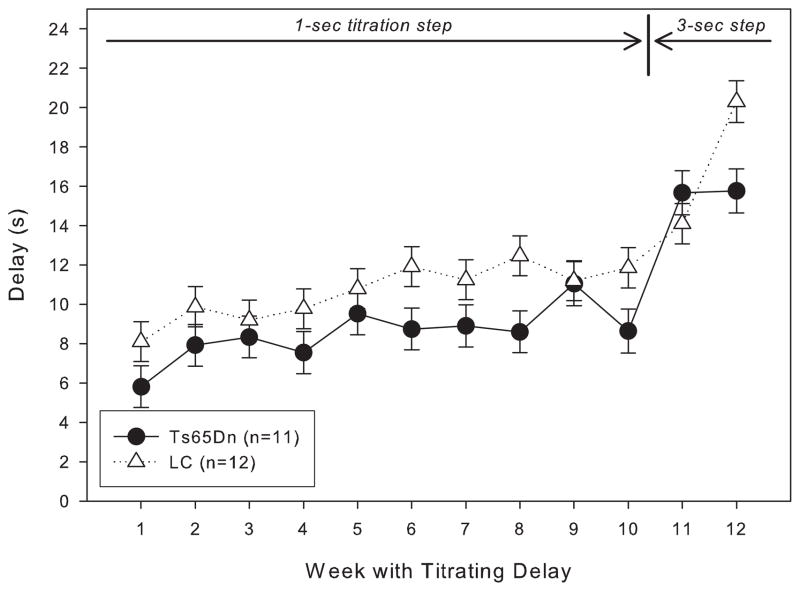
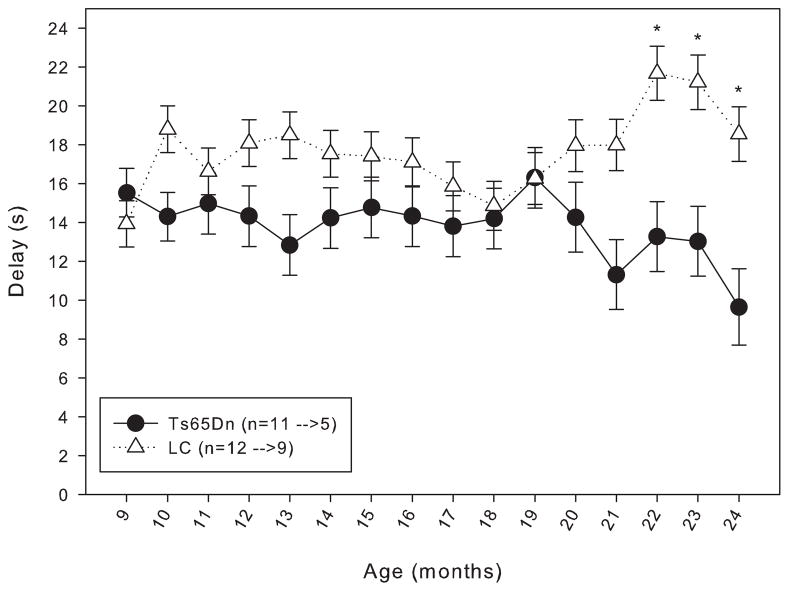
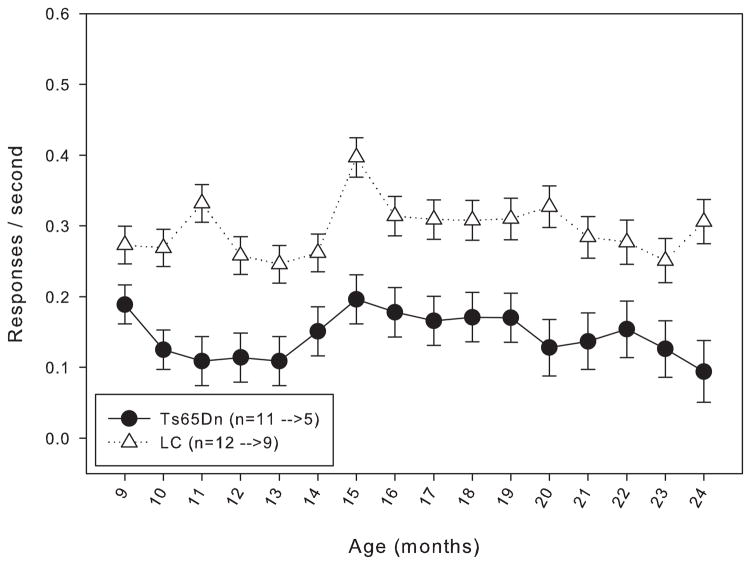
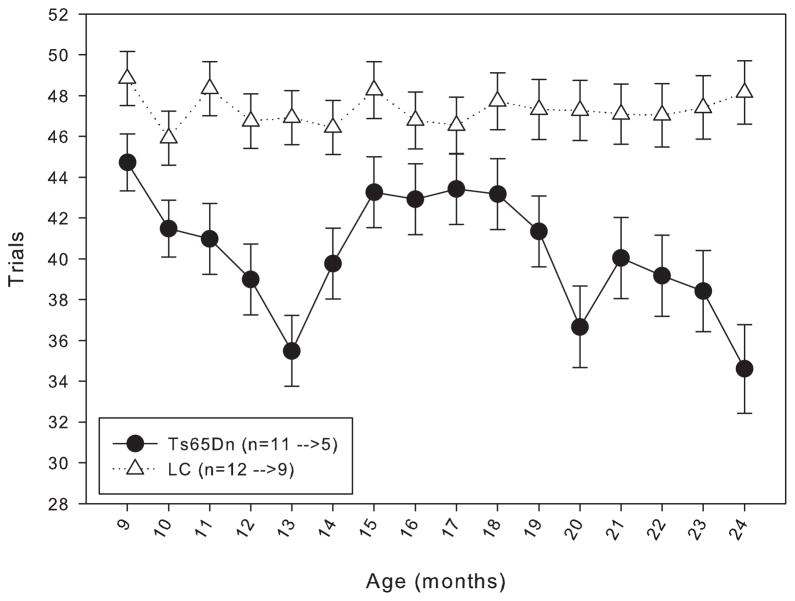
When trained under the matching-to-position schedule with a fixed 3-second delay, both Ts65Dn and LC mice initially performed at around chance accuracy. After 20 days of training, both lines had improved, but the LC displayed significantly greater matching accuracy than their trisomic counterparts (figure 1). However, within a few weeks after the implementation of the delay titration, the Ts65Dn mice were achieving mean delays per session that were not significantly different from the LC mice (figure 2). An examination of the data across the lifespan of these mice reveals that from 9 months through 21 months of age, the mean delay per session was not significantly different between Ts65Dn and LC mice (figure 3). However, beginning at 22 months of age, the littermate controls reached significantly longer mean delays than the Ts65Dn. In examining other behavioral parameters, the Ts65Dn responded at a lower rate (figure 4, top panel) and completed fewer trials (figure 4, bottom panel) than LC. Interestingly, beginning at approximately 22 months of age, a downward trend was evident in all three parameters for the Ts65Dn mice. The n for each line of mice from months 9 to 24 is shown in table 1.
Figure 1.
Average percent matching accuracy for Group 1 mice under the matching-to-position schedule of reinforcement with a fixed 3-second delay. Each data point represents the mean ± S.E. There was a significant overall effect between the two lines (F(1,19)=9.954, p<0.05), as well as a significant effect between the training days (F(1,19)=26.840, p<0.05); there was a significant interaction between line and day (F(1,19)=1.721, p<0.05). A significant difference (p<0.05) between the two lines on specific days is indicated by *.
Figure 2.
Length of the mean delay per session for Group 1 mice for the first 12 weeks under the titrating schedule. Each data point represents the mean ± S.E. There was not a significant overall effect between the two lines (F(1,11)=3.123, p>0.05), while there was a significant effect between the weeks (F(1,11)=15.304, p<0.05); there was not a significant interaction between line and week (F(1,11)=1.240, p>0.05). The arrows at the top of the graph indicate when the 1- and 3-second titration steps were in effect.
Figure 3.
Length of the mean delay per session for Group 1 mice from 9 to 24 months of age. Each data point represents the mean ± S.E. There was not a significant overall effect between the two lines (F(1,15)=2.093, p>0.05), nor was there a significant effect between the months (F(1,15)=0.842, p>0.05); there was a significant interaction between line and month (F(1,15)=2.214, p<0.05). A significant difference (p<0.05) between the two lines on specific months is indicated by *. The values for the n in the legend indicate the number of animals included in the data points at 9 months of age before the arrow, and the number of animals included in the data points at 24 months of age after the arrow.
Figure 4.
Top panel: rate of responding for Group 1 mice from 9 to 24 months of age. Each data point represents the mean ± S.E. There was a significant overall effect between the two lines (F(1,15)=9.469, p<0.05), as well as a significant effect between the months (F(1,15)=1.838, p<0.05); there was not a significant interaction between line and month (F(1,15)=0.761, p>0.05). The values for the n in the legend indicate the number of animals included in the data points at 9 months of age before the arrow, and the number of animals included in the data points at 24 months of age after the arrow.
Bottom panel: number of trials completed for Group 1 mice from 9 to 24 months of age. Each data point represents the mean ± S.E. There was a significant overall effect between the two lines (F(1,15)=6.956, p<0.05), as well as a significant effect between the months (F(1,15)=2.089, p<0.05); there was not a significant interaction between line and month (F(1,15)=1.649, p>0.05). The values for the n in the legend indicate the number of animals included in the data points at 9 months of age before the arrow, and the number of animals included in the data points at 24 months of age after the arrow.
Table 1.
Number of mice in each line for Group 1 from months 9 to 24.
| Month | n | |
|---|---|---|
| Ts65Dn | LC | |
| 9 | 11 | 12 |
| 10 | 11 | 12 |
| 11 | 8 | 12 |
| 12 | 8 | 12 |
| 13 | 8 | 12 |
| 14 | 8 | 12 |
| 15 | 8 | 11 |
| 16 | 8 | 11 |
| 17 | 8 | 11 |
| 18 | 8 | 11 |
| 19 | 8 | 10 |
| 20 | 6 | 10 |
| 21 | 6 | 10 |
| 22 | 6 | 9 |
| 23 | 6 | 9 |
| 24 | 5 | 9 |
3.2 Group 2 mice
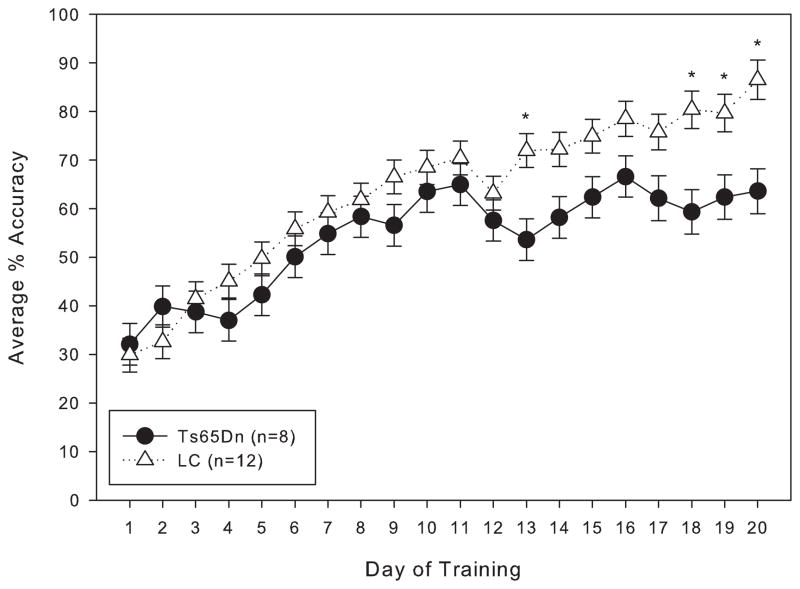
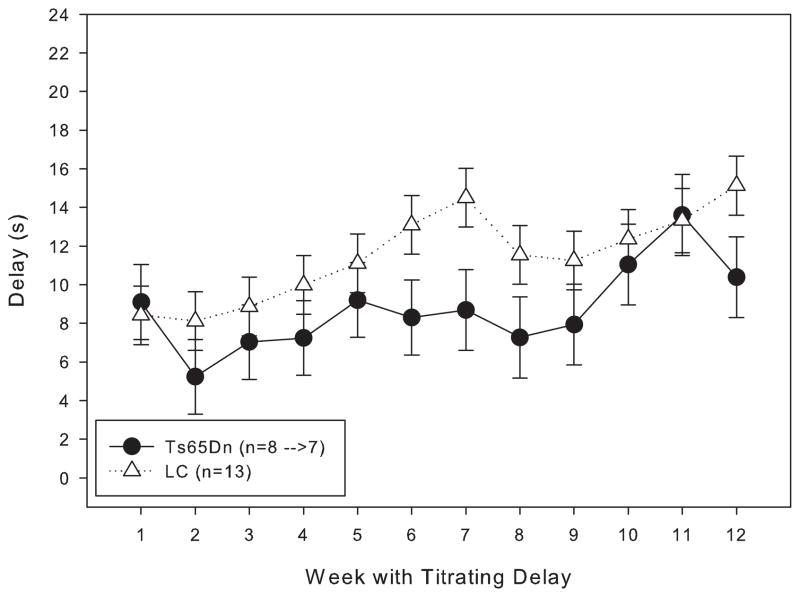
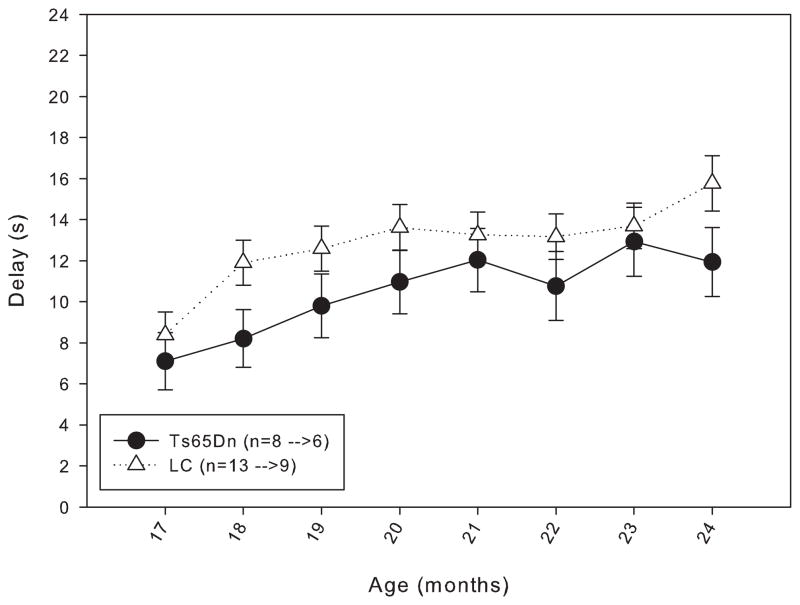
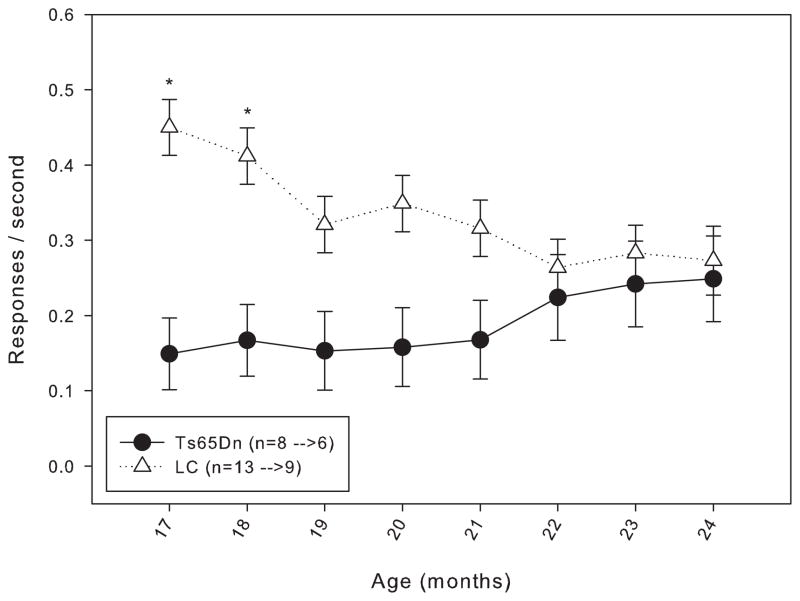
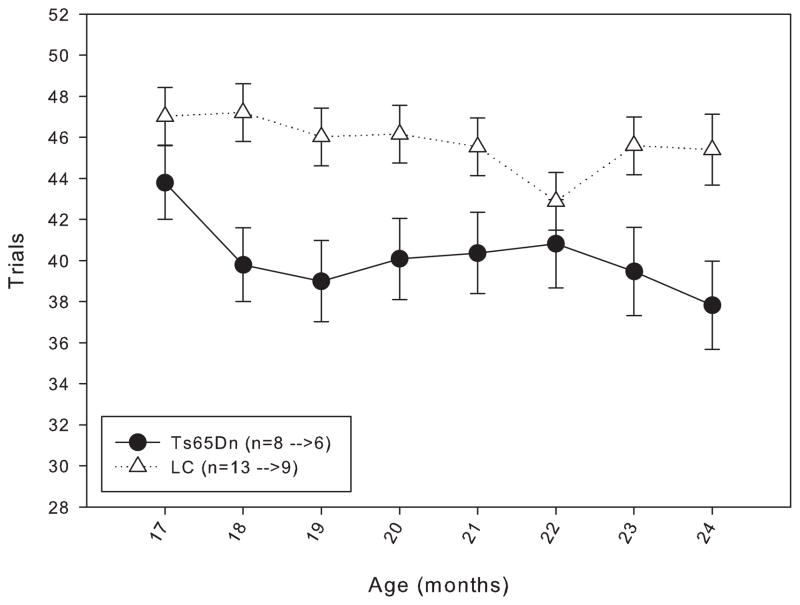
In order to determine whether daily testing from 4 months of age masked an age-related decline in working memory, the mice in Group 2 were housed without being behaviorally tested until 15 months of age. When trained under the matching-to-position schedule with a fixed 3-second delay, a trend similar to that seen in the Group 1 mice was observed: though both lines initially performed at approximately the same level of accuracy, at the end of 20 days of training, the LC mice were achieving a higher percent accuracy than the Ts65Dn mice (figure 5). However, the same trend found in the Group 1 mice persisted with the mice in Group 2, in that after a few weeks under the delay titration, both lines of mice were performing at mean delays that were statistically indistinguishable (figure 6). Data from 17 to 24 months of age in Group 2 mice revealed no significant difference in length of mean delay per session between the two lines (figure 7). The rate of responding and number of trials (figure 8, top and bottom panels) completed for the Ts65Dn mice was generally lower than that of LC, though there was not a significant overall effect between the strains for either parameter. However, the LC did respond at a significantly higher rate than the Ts65Dn during months 17 and 18. From months 17 to 24, a trend was observed in which the rate of responding in the LC and the number of trials completed in the Ts65Dn decreased. The n for each line of mice from months 9 to 24 is shown in table 2.
Figure 5.
Average percent matching accuracy for Group 2 mice under the matching-to-position schedule of reinforcement with a fixed 3-second delay. Each data point represents the mean ± S.E. There was not a significant overall effect between the two lines (F(1,19)=2.377, p>0.05), while there was a significant effect between the training days (F(1,19)=21.777, p<0.05); there was a significant interaction between line and day (F(1,19)=1.763, p<0.05). A significant difference (p<0.05) between the two lines on specific days is indicated by *.
Figure 6.
Length of the mean delay per session for Group 2 mice for the first 12 weeks under the titrating schedule. Each data point represents the mean ± S.E. There was not a significant overall effect between the two lines (F(1,11)=2.141, p>0.05), while there was a significant effect between the weeks (F(1,11)=2.479, p<0.05); there was not a significant interaction between line and week (F(1,11)=0.630, p>0.05). The values for the n in the legend indicate the number of animals available at the first week of titration before the arrow, and the number of animals available by week 12 of titration after the arrow.
Figure 7.
Length of the mean delay per session for Group 2 mice from 17 to 24 months of age. Each data point represents the mean ± S.E. There was not a significant overall effect between the two lines (F(1,7)=1.449, p>0.05), while there was a significant effect between the months (F(1,7)=4.228, p<0.05); there was not a significant interaction between line and month (F(1,7)=0.359, p>0.05). The values for the n in the legend indicate the number of animals included in the data points at 17 months of age before the arrow, and the number of animals included in the data points at 24 months of age after the arrow.
Figure 8.
Top panel: rate of responding for Group 2 mice from 17 to 24 months of age. Each data point represents the mean ± S.E. There was not a significant overall effect between the two lines (F(1,7)=3.570, p>0.05), nor was there a significant effect between the months (F(1,7)=0.510, p>0.05); there was a significant interaction between line and month (F(1,7)=2.385, p<0.05). A significant difference (p<0.05) on specific months is indicated by *. The values for the n in the legend indicate the number of animals included in the data points at 17 months of age before the arrow, and the number of animals included in the data points at 24 months of age after the arrow.
Bottom panel: number of trials completed for Group 2 mice from 17 to 24 months of age. Each data point represents the mean ± S.E. There was not a significant overall effect between the two lines (F(1,7)=2.705, p>0.05), nor was there a significant effect between the months (F(1,7)=0.933, p>0.05); there was not a significant interaction between line and month (F(1,7)=0.672, p>0.05). The values for the n in the legend indicate the number of animals included in the data points at 17 months of age before the arrow, and the number of animals included in the data points at 24 months of age after the arrow.
Table 2.
Number of mice in each line for Group 2 from months 17 to 24.
| Month | n | |
|---|---|---|
| Ts65Dn | LC | |
| 17 | 8 | 13 |
| 18 | 8 | 13 |
| 19 | 7 | 13 |
| 20 | 7 | 13 |
| 21 | 7 | 13 |
| 22 | 6 | 13 |
| 23 | 6 | 13 |
| 24 | 6 | 9 |
4. Discussion
Previous research from our lab has indicated that under a delayed matching-to-position procedure, young Ts65Dn mice display no working memory deficit when compared to euploid controls [17]. Data reported in the present study for mice in Group 1 show that we replicate these findings here: during initial training using a fixed 3-second delay, the Ts65Dn mice performed at a significantly lower percent accuracy in matching than the LC mice, suggesting that a memory deficit is present in the trisomic mice. However, the initial deficit in matching accuracy between Ts65Dn and LC was overcome with further training. Once the titration schedule was implemented, the Ts65Dn reached mean delays per session no different than those reached by the LC, and this continued until the mice were 21 months of age. An initial deficit in performance that is overcome with repeated training suggests the presence not of a memory deficit, but of a learning deficit. This finding is in accordance with other research in Ts65Dn mice, since the demonstration of a learning deficit in these mice has been reported previously by multiple investigators [18,35,40].
These findings in younger mice are important, but the main purpose of this study was to determine whether Ts65Dn mice develop a working memory deficit as they age. From 22 to 24 months of age, the length of the mean delay reached by Group 1 Ts65Dn was significantly lower than that reached by the LC, which suggests an age-related decrease in working memory. However, an examination of the other measures of performance may provide a different explanation for this phenomenon. In both rate of responding and number of trials completed in a session, Ts65Dn mice consistently performed at lower levels than LC mice throughout their lifespan. For both parameters, at approximately 22 months of age, an interesting trend of a drop in performance appears in the Ts65Dn mice. During this same period of time, observation of the mice outside of the test chamber revealed lower levels of activity and somewhat impaired motor ability in several of the Ts65Dn mice. These observations strongly indicate that the motor function of the trisomic mice was beginning to deteriorate at this point, which suggests that the difference in the length of the mean delay between Ts65Dn and LC mice during the last few months of training may be due to a decline in the overall performance of the Ts65Dn mice, rather than a memory deficit. This indicates that there is no age-related deficit in working memory in Ts65Dn mice when compared to euploid controls. A similar decrease in overall performance of Ts65Dn mice in a learning paradigm has been observed at approximately the same age – a recent study reported that both the number of reinforcers earned and the rate of responding decreased, while percent accuracy did not change, suggesting that the decrease in reinforcers earned was not due to an age related decrease in learning function, but was secondary to an increasing motor deficit [35].
Several studies have demonstrated that environmental enrichment can improve cognitive function and alter synapse formation in both animals and humans [28,31,39]. Daily testing under operant schedules of reinforcement has been shown to alter brain structures in a manner similar to other environmental enrichment [37]. Because the Group 1 mice had been tested since they were 4 months of age, it was important to determine whether this lifelong training masked any age-related memory deficit. Thus the Group 2 mice were used to control for this possibility. Initial training under the matching-to-position schedule of reinforcement with a fixed 3-second delay produced a trend similar to that seen in Group 1 mice: Ts65Dn mice attained lower percent matching accuracy than littermate controls, with the difference reaching statistical significance by the end of four weeks of training. However, after further training, the difference in performance disappeared. This again suggests the presence of a learning deficit rather than a working memory deficit in the Ts65Dn, even as aged mice. Furthermore, from months 17 to 24 there was no significant difference in length of mean delay between the two lines. It is interesting to note that the last few months of testing did not reveal the divergence in length of mean delay between the two lines as occurred in Group 1. An examination of other measures of performance may shed light on this observation. For the Group 2 mice, the number of trials completed by the Ts65Dn declined from months 17 to 24; at the same time, the littermate controls showed a decrease in the rate of responding. It is possible that these two factors balanced out so that the Ts65Dn and LC maintained similar levels of performance. One other factor may explain a difference between the two groups. As mentioned previously, the studies reported here were part of a larger study to examine the effects of purported cognitive enhancers on working memory. Due to the way the study was conducted, the mice in Group 1 received drug for two sets of dose-response curves, one set administered from 10–15 months of age, and a second set from 18–23 months of age. The Group 2 mice were only administered drug for one set of dose-response curves, from 18–23 months of age. It is possible that the additional drug administered to the mice in Group 1 influenced the results of the behavioral experiments. Nevertheless, the end result of the experiments reported here is that there appears to be no age-related deficit in working memory in Ts65Dn mice when compared to littermate controls.
Working memory in the Ts65Dn mouse has been studied using non-operant techniques, with varying results. Several labs have utilized the radial arm maze (RAM), both land and water variations, and reported that Ts65Dn mice made more working memory errors than LC [14,15,23]. In addition, some studies using the Morris water maze report longer search times for Ts65Dn in the hidden platform version, but not in the visible (or cued) version, suggesting the presence of a memory deficit in the Ts65Dn mouse [18,19,34]. In contrast, other studies using the Morris water maze report that Ts65Dn mice exhibited longer search times than LC in both the hidden and the visible platform versions of the task, suggesting that the increased escape latency in the Ts65Dn mice is not due to a memory or learning deficit [22,32]. It should be noted that in virtually every one of these prior studies, the trisomic mice showed improvement over time, and in several cases reached the level of the controls by the time the studies ended [14,18,19], suggesting a problem of learning rather than memory. In addition, as mentioned previously, the Morris water maze in particular may not be the most appropriate task for the Ts65Dn mice due to increased levels of stress and altered swimming patterns in these mice [6,18]. Thus, these prior studies do not provide a definitive answer as to the working memory ability of the Ts65Dn mouse. One major difference between these previous studies and the experiments reported here is that the present research represents the most long-term survey of working memory in the Ts65Dn mouse, following the same mice from 3 months of age to 24 months of age. Each of the previous studies of memory has been short-term, with the length of testing ranging from three to fifteen sessions. While it cannot simply be assumed that given enough time, Ts65Dn mice in all of those prior studies would have reached the same level of performance noted in littermate controls, the fact that the mice did improve over time, often reaching the level of controls, suggests that a working memory deficit in the Ts65Dn mice may not be the correct conclusion. In light of this, the data reported here add to a growing literature base suggesting that, though they may possess a deficit in learning, Ts65Dn mice have a working memory capacity no different from that of controls.
An important consideration of the findings reported here is whether or not these results further validate the Ts65Dn as a model of Down syndrome. Working memory has been studied in patients with Down syndrome using a variety of procedures, many of which cannot be used with animals (i.e. verbal procedures), making a comparison to the results of this study difficult. However, there are a few studies in which a delayed matching (or non-matching)-to-sample procedure, similar to the one used here, has been used in human Down syndrome patients [12,13]. When a group of children with Down syndrome were compared to typically developing children in a delayed non-matching-to-sample task, the children with Down syndrome took longer than typical children to reach the predetermined criterion performance. However, once they reached criterion performance, the children with Down syndrome performed at levels of accuracy no different from that of typically developing children. This finding mirrors the results from the current studies: young Ts65Dn mice took longer than age-matched LC to reach the same level of accuracy, but once at that level, no significant differences were observed in the performance of the two groups. Thus, young Ts65Dn mice appear to be a good model for the working memory of young Down syndrome patients.
Since a major purpose of the current studies was to determine whether the aged Ts65Dn mouse displayed working memory deficits, it is important to compare our results to studies using delayed matching-to-sample in adults with Down syndrome. However, few studies of this nature exist, and the results from those studies are not conclusive. In one study, Down syndrome patients over the age of 44 made more errors under a delayed matching schedule than did younger Down syndrome subjects [7]. In a larger study, some aged (over 44 years old) Down syndrome subjects performed at lower levels of accuracy than younger Down syndrome subjects; however, that was true for only 24% of the aged Down syndrome patients. The other 76% performed at the same level as that of younger Down syndrome subjects [8]. In contrast to the first two studies, a third study reported that Down syndrome patients over the age of 50 performed at levels that were statistically indistinguishable from younger Down syndrome subjects [16]. Thus, it appears that although some aged patients with Down syndrome may experience a decline in working memory as measured by a delayed matching-to-sample procedure, the majority do not. The findings reported here indicate that no working memory deficit is present in aged Ts65Dn mice, which is consistent with the third study mentioned above [16].
The results from these studies help to further elucidate the behavioral phenotype of the Ts65Dn mouse and provide further evidence regarding the suitability of these mice as a model of Down syndrome. In general, the working memory studies reported here correlate well with studies in human Down syndrome patients using delayed matching-to-sample procedures. While it takes Down syndrome patients longer to learn the task, they eventually perform as well as non-mentally impaired individuals. In addition, although there are reports that a fraction of Down syndrome patients display an age-related decline in delayed matching performance, the majority do not. Thus, these working memory experiments provide further support for the Ts65Dn as a relevant model of Down syndrome.
Research Highlights.
Ts65Dn mice took longer to learn the task than did age-matched controls
Once the task was mastered, performance was the same between groups
Ts65Dn mice do not possess an age-related working memory deficit
Acknowledgments
The authors would like to thank Dr. D. Keith Williams for providing input on statistical analyses, and both Dr. Nichole Sanders and Camron Hall for help and support in the laboratory. This work was supported by NICHD grant HD047656 (G.R. Wenger).
Footnotes
Publisher's Disclaimer: This is a PDF file of an unedited manuscript that has been accepted for publication. As a service to our customers we are providing this early version of the manuscript. The manuscript will undergo copyediting, typesetting, and review of the resulting proof before it is published in its final citable form. Please note that during the production process errors may be discovered which could affect the content, and all legal disclaimers that apply to the journal pertain.
References
- 1.Akeson EC, Lambert JP, Narayanswami S, Gardiner K, Bechtel LJ, Davisson MT. Ts65Dn - localization of the translocation breakpoint and trisomic gene content in a mouse model for Down syndrome. Cytogenet Cell Genet. 2001;93:270–276. doi: 10.1159/000056997. [DOI] [PubMed] [Google Scholar]
- 2.Antonarakis SE, Epstein CJ. The challenge of Down syndrome. Trends Mol Med. 2006;12:473–479. doi: 10.1016/j.molmed.2006.08.005. [DOI] [PubMed] [Google Scholar]
- 3.Blough DS. Delayed matching in the pigeon. J Exp Anal Behav. 1959;2:151–160. doi: 10.1901/jeab.1959.2-151. [DOI] [PMC free article] [PubMed] [Google Scholar]
- 4.Canfield MA, Honein MA, Yuskiv N, Xing J, Mai CT, Collins JS, Devine O, Petrini J, Ramadhani TA, Hobbs CA, Kirby RS. National estimates and race/ethnic-specific variation of selected birth defects in the United States, 1999–2001. Birth Defects Res A Clin Mol Teratol. 2006;76:747–756. doi: 10.1002/bdra.20294. [DOI] [PubMed] [Google Scholar]
- 5.Chen Y, Dyakin VV, Branch CA, Ardekani B, Yang D, Guilfoyle DN, Peterson J, Peterhoff C, Ginsberg SD, Cataldo AM, Nixon RA. In vivo MRI identifies cholinergic circuitry deficits in a Down syndrome model. Neurobiol Aging. 2009;30:1453–1465. doi: 10.1016/j.neurobiolaging.2007.11.026. [DOI] [PMC free article] [PubMed] [Google Scholar]
- 6.Costa ACS, Walsh K, Davisson MT. Motor dysfunction in a mouse model for Down syndrome. Physiol Behav. 1999;68:211–220. doi: 10.1016/s0031-9384(99)00178-x. [DOI] [PubMed] [Google Scholar]
- 7.Dalton AJ, Crapper DR, Schlotterer GR. Alzheimer’s disease in Down’s syndrome: Visual retention deficits. Cortex. 1974;10:366–377. doi: 10.1016/s0010-9452(74)80029-8. [DOI] [PubMed] [Google Scholar]
- 8.Dalton AJ, Crapper McLachlan DR. Incidence of memory deterioration in aging persons with Down’s syndrome. In: Berg JM, editor. Perspectives and Progress in Mental Retardation, Vol II - Biomedical Aspects. Baltimore, MD: University Park Press; 1984. pp. 55–62. [Google Scholar]
- 9.Dalton AJ, Crapper-McLachlan DR. Clinical expression of Alzheimer’s disease in Down’s syndrome. Psychiatr Clin North Am. 1986;9:659–670. [PubMed] [Google Scholar]
- 10.Davisson MT, Schmidt C, Akeson EC. Segmental trisomy of murine chromosome 16: A new model system for studying Down syndrome. In: Patterson D, Epstein CJ, editors. Molecular Genetics of Chromosome 21 and Down Syndrome. New York: Wiley-Liss; 1990. pp. 263–280. [PubMed] [Google Scholar]
- 11.Davisson MT, Schmidt C, Reeves RH, Irving NG, Akeson EC, Harris BS, Bronson RT. Segmental trisomy as a mouse model for Down syndrome. In: Epstein CJ, editor. The phenotypic mapping of Down syndrome and other aneuploid conditions. Progress in Clinical and Biological Research. Vol. 384. New York: Wiley-Liss; 1993. pp. 117–133. [PubMed] [Google Scholar]
- 12.Dawson G, Meltzoff AN. Neuropsychological correlates of early symptoms of autism. Child Dev. 1998;69:1276–1285. [PMC free article] [PubMed] [Google Scholar]
- 13.Dawson G, Osterling J, Rinaldi J, Carver L, Mcpartland J. Brief report: Recognition memory and stimulus-reward associations: Indirect support for the role of ventromedial prefrontal dysfunction in autism. J Autism Dev Disord. 2001;31:337–341. doi: 10.1023/a:1010751404865. [DOI] [PubMed] [Google Scholar]
- 14.Demas GE, Nelson RJ, Krueger BK, Yarowsky PJ. Spatial memory deficits in segmental trisomic Ts65Dn mice. Behav Brain Res. 1996;82:85–92. doi: 10.1016/s0166-4328(97)81111-4. [DOI] [PubMed] [Google Scholar]
- 15.Demas GE, Nelson RJ, Krueger BK, Yarowsky PJ. Impaired spatial working and reference memory in segmental trisomy. Behav Brain Res. 1998;90:199–201. doi: 10.1016/s0166-4328(97)00116-2. [DOI] [PubMed] [Google Scholar]
- 16.Devenny DA, Silverman WP, Hill AL, Jenkins E, Sersen EA, Wisniewski KE. Normal ageing in adults with Down’s syndrome: A longitudinal study. J Intellect Disabil Res. 1996;40:208–221. [PubMed] [Google Scholar]
- 17.Dowdy-Sanders NC, Wenger GR. Working memory in the Ts65Dn mouse, a model for Down syndrome. Behav Brain Res. 2006;168:349–352. doi: 10.1016/j.bbr.2005.11.020. [DOI] [PubMed] [Google Scholar]
- 18.Escorihuela RM, Fernández-Teruel A, Vallina IF, Baamonde C, Lumbreras MA, Dierssen M, Tobeña A, Flórez J. A behavioral assessment of Ts65Dn mice: A putative Down syndrome model. Neurosci Lett. 1995;199:143–146. doi: 10.1016/0304-3940(95)12052-6. [DOI] [PubMed] [Google Scholar]
- 19.Escorihuela RM, Vallina IF, Martínez-Cué C, Baamonde C, Dierssen M, Tobeña A, Flórez J, Fernández-Teruel A. Impaired short- and long-term memory in Ts65Dn mice, a model for Down syndrome. Neurosci Lett. 1998;247:171–174. doi: 10.1016/s0304-3940(98)00317-6. [DOI] [PubMed] [Google Scholar]
- 20.Granholm A-CE, Sanders LA, Crnic LS. Loss of cholinergic phenotype in basal forebrain coincides with cognitive decline in a mouse model of Down’s syndrome. Exp Neurol. 2000;161:647–663. doi: 10.1006/exnr.1999.7289. [DOI] [PubMed] [Google Scholar]
- 21.Hattori M, Fujiyama A, Taylor TD, Watanabe H, Yada T, Park HS, Toyoda A, Ishii K, Totoki Y, Choi DK, Soeda E, Ohki M, Takagi T, Sakaki Y, Taudien S, Blechschmidt K, Polley A, Menzel U, Delabar J, Kumpf K, Lehmann R, Patterson D, Reichwald K, Rump A, Schillhabel M, Schudy A, Zimmermann W, Rosenthal A, Kudoh J, Shibuya K, Kawasaki K, Asakawa S, Shintani A, Sasaki T, Nagamine K, Mitsuyama S, Antonarakis SE, Minoshima S, Shimizu N, Nordsiek G, Hornischer K, Brandt P, Scharfe M, Schon O, Desario A, Reichelt J, Kauer G, Blocker H, Ramser J, Beck A, Klages S, Hennig S, Riesselmann L, Dagand E, Haaf T, Wehrmeyer S, Borzym K, Gardiner K, Nizetic D, Francis F, Lehrach H, Reinhardt R, Yaspo ML. The DNA sequence of human chromosome 21. Nature. 2000;405:311–319. doi: 10.1038/35012518. [DOI] [PubMed] [Google Scholar]
- 22.Holtzman DM, Santucci D, Kilbridge J, Chua-Couzens J, Fontana DJ, Daniels SE, Johnson RM, Chen K, Sun Y, Carlson E, Alleva E, Epstein CJ, Mobley WC. Developmental abnormalities and age-related neurodegeneration in a mouse model of Down syndrome. Proc Natl Acad Sci U S A. 1996;93:13333–13338. doi: 10.1073/pnas.93.23.13333. [DOI] [PMC free article] [PubMed] [Google Scholar]
- 23.Hunter CL, Bimonte HA, Granholm AC. Behavioral comparison of 4 and 6 month-old Ts65Dn mice: Age-related impairments in working and reference memory. Behav Brain Res. 2003;138:121–131. doi: 10.1016/s0166-4328(02)00275-9. [DOI] [PubMed] [Google Scholar]
- 24.Lai F, Williams RS. A prospective study of Alzheimer disease in Down syndrome. Arch Neurol. 1989;46:849–853. doi: 10.1001/archneur.1989.00520440031017. [DOI] [PubMed] [Google Scholar]
- 25.Laws G. Working memory in children and adolescents with Down syndrome: evidence from a colour memory experiment. J Child Psychol Psychiatry. 2002;43:353–364. doi: 10.1111/1469-7610.00026. [DOI] [PubMed] [Google Scholar]
- 26.Lott IT, Head E. Down syndrome and Alzheimer’s disease: A link between development and aging. Ment Retard Dev Disabil Res Rev. 2001;7:172–178. doi: 10.1002/mrdd.1025. [DOI] [PubMed] [Google Scholar]
- 27.Megias M, Verduga R, Dierssen M, Florez J, Insausti R, Crespo D. Cholinergic, serotonergic and catecholaminergic neurons are not affected in Ts65Dn mice. Neuroreport. 1997;8:3475–3478. doi: 10.1097/00001756-199711100-00012. [DOI] [PubMed] [Google Scholar]
- 28.Moser MB. Making more synapses: A way to store information? Cell Mol Life Sci. 1999;55:593–600. doi: 10.1007/s000180050317. [DOI] [PMC free article] [PubMed] [Google Scholar]
- 29.Nadel L. Down’s syndrome: a genetic disorder in biobehavioral perspective. Genes Brain Behav. 2003;2:156–166. doi: 10.1034/j.1601-183x.2003.00026.x. [DOI] [PubMed] [Google Scholar]
- 30.Numminen H, Service E, Ahonen T, Ruoppila I. Working memory and everyday cognition in adults with Down’s syndrome. J Intellect Disabil Res. 2001;45:157–168. doi: 10.1046/j.1365-2788.2001.00298.x. [DOI] [PubMed] [Google Scholar]
- 31.Pham TM, Söderström S, Winblad B, Mohammed AH. Effects of environmental enrichment on cognitive function and hippocampal NGF in the non-handled rats. Behav Brain Res. 1999;103:63–70. doi: 10.1016/s0166-4328(99)00019-4. [DOI] [PubMed] [Google Scholar]
- 32.Reeves RH, Irving NG, Moran TH, Wohn A, Kitt C, Sisodia SS, Schmidt C, Bronson RT, Davisson MT. A mouse model for Down syndrome exhibits learning and behaviour deficits. Nat Genet. 1995;11:177–184. doi: 10.1038/ng1095-177. [DOI] [PubMed] [Google Scholar]
- 33.Richtsmeier JT, Baxter LL, Reeves RH. Parallels of craniofacial maldevelopment in Down syndrome and Ts65Dn mice. Dev Dyn. 2000;217:137–145. doi: 10.1002/(SICI)1097-0177(200002)217:2<137::AID-DVDY1>3.0.CO;2-N. [DOI] [PubMed] [Google Scholar]
- 34.Sago H, Carlson EJ, Smith DJ, Rubin EM, Crnic LS, Huang T, Epstein CJ. Genetic dissection of region associated with behavioral abnormalities in mouse models for Down syndrome. Pediatr Res. 2000;48:606–613. doi: 10.1203/00006450-200011000-00009. [DOI] [PubMed] [Google Scholar]
- 35.Sanders NC, Williams DK, Wenger GR. Does the learning deficit observed under an incremental repeated acquisition schedule of reinforcement in Ts65Dn mice, a model for Down syndrome, change as they age? Behav Brain Res. 2009;203:137–142. doi: 10.1016/j.bbr.2009.04.031. [DOI] [PMC free article] [PubMed] [Google Scholar]
- 36.Seo H, Isacson O. Abnormal APP, cholinergic and cognitive function in Ts65Dn Down’s model mice. Exp Neurol. 2005;193:469–480. doi: 10.1016/j.expneurol.2004.11.017. [DOI] [PubMed] [Google Scholar]
- 37.Slikker W, Jr, Paule MG, Ali SF, Scallet AC, Bailey JR. Behavioral, neurochemical and neurohistological effects of chronic marijuana smoke exposure in the nonhuman primate. In: Murphy LL, Bartke A, editors. Marijuana/Cannabinoids: Neurophysiology and Neurobiology. Boca Raton: CRC Press; 1992. pp. 219–273. [Google Scholar]
- 38.Toyoda A, Noguchi H, Taylor TD, Ito T, Pletcher MT, Sakaki Y, Reeves RH, Hattori M. Comparative genomic sequence analysis of the human chromosome 21 Down syndrome critical region. Genome Res. 2002;12:1323–1332. doi: 10.1101/gr.153702. [DOI] [PMC free article] [PubMed] [Google Scholar]
- 39.Vogel W, Kun KJ, Meshorer E. Effects of environmental enrichment and environmental deprivation on cognitive functioning in institutionalized retardates. J Consult Psychol. 1967;31:570–576. doi: 10.1037/h0025166. [DOI] [PubMed] [Google Scholar]
- 40.Wenger GR, Schmidt C, Davisson MT. Operant conditioning in the Ts65Dn Mouse: Learning. Behav Genet. 2004;34:105–119. doi: 10.1023/B:BEGE.0000009480.79586.ee. [DOI] [PubMed] [Google Scholar]
- 41.Wiseman FK, Alford KA, Tybulewicz VLJ, Fisher EMC. Down syndrome--recent progress and future prospects. Hum Mol Genet. 2009;18:R75–R83. doi: 10.1093/hmg/ddp010. [DOI] [PMC free article] [PubMed] [Google Scholar]
- 42.Wisniewski KE, Dalton AJ, Crapper McLachlan DR, Wen GY, Wisniewski HM. Alzheimer’s disease in Down’s syndrome: Clinicopathologic studies. Neurology. 1985;35:957–961. doi: 10.1212/wnl.35.7.957. [DOI] [PubMed] [Google Scholar]
- 43.Wisniewski KE, Wisniewski HM, Wen GY. Occurrence of neuropathological changes and dementia of Alzheimer’s disease in Down’s syndrome. Ann Neurol. 1985;17:278–282. doi: 10.1002/ana.410170310. [DOI] [PubMed] [Google Scholar]


