Abstract
The lateral flow test has become the standard bioassay format in low-resource settings because it is rapid, easy to use, low in cost, uses reagents stored in dry form, and is equipment-free. However, lateral flow tests are often limited to a single chemical delivery step and not capable of the multi-step processing characteristic of high performance laboratory-based assays. To address this limitation, we are developing a paper network platform that extends the conventional lateral flow test to two dimensions; this allows incorporation of multi-step chemical processing, while still retaining the advantages of conventional lateral flow tests. Here we demonstrate this format for an easy-to-use, signal-amplified sandwich format immunoassay for the malaria protein PfHRP2. The card contains reagents stored in dry form such that the user need only add sample and water. The multiple flows in the device are activated in a single user step of folding the card closed; the configuration of the paper network automatically delivers the appropriate volumes of i) sample plus antibody conjugated to a gold particle label, ii) a rinse buffer, and iii) a signal amplification reagent to the capture region. These results highlight the potential of the paper network platform to enhance access to high-quality diagnostic capabilities in low-resource settings in the developed and developing worlds.
Keywords: two-dimensional paper networks, multi-step assays, paper microfluidics, lateral flow tests, chemical signal amplification, gold enhancement of gold nanoparticles, immunoassay
1.1 Introduction
There is a compelling need in resource-limited settings for equipment-free diagnostics. A major challenge to creating a diagnostic device that is free of dedicated equipment is to transport fluids within the device without the commonly used active pumping systems. Capillary pumping is the method of fluid transport in the simple lateral flow tests that have been used in low-resource settings for decades. Lateral flow strip tests have been developed for many applications ranging from testing for pregnancy and drugs of abuse to disease detection. The main advantages of these strips are that they are rapid, easy to use, low cost, use reagents stored in dry form, and equipment-free. Though lateral flow tests fulfill many of the ASSURED criteria [1], they have been criticized for both their inability to multiplex (i.e., assay for multiple analytes from a single sample) and their inability to perform multi-step chemical processing with a resultant poor sensitivity for many analytes of clinical importance [2, 3].
In 2008, the Whitesides group introduced the use of microfluidic paper-based analytical devices (μPADS)--two and three-dimensional paper-based structures that enable colorimetric assays (e.g. for detection of glucose and protein) with multiplexing capability [4, 5]. Additional work in the area of paper-based assay development has focused on alternate fabrication methods [6, 7], implementing multiplexed assays for the detection of additional biomarkers using one-step colorimetric reactions (e.g. nitrite, uric acid, and lactate) [8, 9], or performing the simultaneous analysis of multiple controls for on-device calibration [10].
The utility of conventional lateral flow tests would be greatly enhanced by enabling additional chemical processing steps. For example, chemical signal amplification has been used to improve the limit of detection (LOD) in laboratory-based bioassays such as ELISA. There have been several investigations of the utility of colorimetric signal amplification systems for enhancing the sensitivity of conventional lateral flow tests either by subsequent immersion into a signal amplification reagent [11], or more recently, by flowing solutions across the width of the detection region of the lateral flow strip [12–14]. However, in these studies, the user was still required to perform numerous steps, including the handling and mixing of multi-component reagent systems, and multiple timed user steps after test initiation, thus limiting the appropriateness of the formats for use at the point of care (POC).
We have previously demonstrated several aspects of two-dimensional paper networks (2DPNs) for implementing automated multi-step processing [15–18]. A key feature of the 2DPN is the configuration of the network, composed of multiple inlets per detection region, which functions as a program for the timed delivery of multiple reagent volumes within the network. Using a 2DPN, we demonstrated that the sequential delivery of multiple reagents, including a signal amplification reagent, in a mock system, resulted in an amplified signal [16]. We further demonstrated an improved limit of detection (LOD) using a 2DPN format based on a conventional lateral flow strip for human chorionic gonadotropin (hCG) detection [19] in a format that required the application of wet reagents and a timed user-step after test initiation. In the current study, we demonstrate a fully-automated amplified 2DPN assay for the detection of Plasmodium falciparum histidine rich protein 2 (PfHRP2) that includes all reagents stored dry. In addition, characterization of the reproducibility of the method of automated volume metering and the robustness of longer-term dry storage of the signal amplification reagents are presented. The 2DPN assay card is as easy to use as a conventional lateral flow test; the user need only apply sample and water, and then fold the device closed in a single-step activation of the multiple processing steps.
2.1 Materials and Methods
The “paper” (i.e. we use this term broadly to encompass all porous materials traditionally used in the lateral flow industry) devices are composed of a nitrocellulose (Millipore, Billerica, MA) network, glass fiber source/storage pads (Ahlstrom, Helsinki, Finland), a cellulose wicking pad (Millipore, Billerica, MA), and Mylar™ (Fraylock, San Carlos, CA) as the housing. All components were cut to appropriate shapes on a CO2 laser cutting system (Universal Laser Systems, Scottsdale, AZ). A web camera (Logitech, Fremont, CA) and a high-resolution scanner (Epson, Nagano, Japan) were used to acquire image data.
Assay components
The assay used a standard sandwich format. A murine antibody to Plasmodium falciparum histidine rich protein 2 (PfHRP2) (Immunology Consultants Laboratory, Portland, OR) was patterned with a piezoelectric inkjet printer (Scienion, Berlin, Germany) at a concentration of 1 mg/mL onto the detection region of a 3-inlet paper network at the test line. A second murine antibody to PfHRP2 (Immunology Consultants Laboratory, Portland, OR) conjugated to a gold nanoparticle (BBInternational, Cardiff, UK) served as a label. An anti-mouse antibody was printed at a concentration of 0.1 mg/mL at the control line. Mock samples were created by spiking known concentrations of the recombinant malaria protein PfHRP2 (CTK Biotech, San Diego, CA) into fetal bovine serum (Invitrogen, Carlsbad, CA). Tris-buffered saline with Tween® 20 (TBST) was used as the rinse buffer. Patterned membranes were treated to minimize nonspecific adsorption by soaking in a solution of 0.25% BSA, 0.25% PVP, 5% sucrose, and 15 mM NaN3 in phosphate buffered saline for 30 min and then dried at 37°C overnight. A commercially-available gold enhancement (GE) reagent (Nanoprobes, Yaphank, NY) was used as the signal amplification reagent. For dry storage, an appropriate volume of each reagent was added to a glass fiber pad and dried at 37°C overnight. For the conjugate dry storage, the conjugate at optical density (OD) 10.2 (specified by the vendor BBI at 520 nm) was combined with 1% BSA in TBS, 5% sucrose in water, and 5% trehalose in water in volume ratios of 7:1:1:1, respectively, and 10 μl of the mixture dried in a 5 mm × 5 mm pad. For the rinse buffer dry storage, 10 μl of TBST was dried in a 5 mm × 5 mm pad. For the GE reagent dry storage, an equal volume (9 μl) of each of the four components was added to a 4 mm × 4 mm pad. For the LOD characterization experiments, the pads were stored in a dessicator at 24°C for up to 2 days before incorporation into the 2DPN card. Rehydration of reagents on the 2DPN card was accomplished using water at the time of use.
Release profile of fluid from the source pads
Fluid release from glass fiber source pads was characterized as a function of time. Source pads were placed at the base of a nitrocellulose strip. A wicking pad was positioned at the downstream end of the strip. A volume of colored fluid, either 10 μl or 40 μl, was added to the pad (either 5 mm × 5 mm or 8 mm × 8 mm, respectively), and the fluid front within the nitrocellulose was monitored as a function of time. For each case, replicates of N=5 (5 mm × 5 mm) or N=4 (8 mm × 8 mm) were run. ImageJ (Research Services Branch, NIH) was used to measure the position of the fluid front as a function of time.
Rehydrated gold enhancement reagent
Experiments were performed to determine the robustness of the gold enhancement reagents to longer-term dry storage. The signal due to rehydrated dry reagent and fresh reagent were compared after 1 and 4 weeks of dry storage in a dessicator at 24°C. Briefly, the solution of conjugate was combined with 1% BSA in TBS in a volume ratio of 1:1. The solution was passed through a 0.45 μm filter and then patterned onto the detection region of a nitrocellulose strip to act as the signal to be amplified. The pads with the gold enhancement reagents stored dry were layered at the base of the strip, similar to in the 2DPN assay card, and a wicking pad was added to the downstream end of the strip. A volume of 40 μl of water was used to rehydrate the dry gold enhancement reagents, and the same volume of fresh gold enhancement reagent (9 μl of each of three components, and 13 μl of the buffer component) was prepared and added to the comparison test. The detection region was scanned (1200 dpi) at 0, 5, 10, and 20 min and run in replicates of N=4. Images were processed using a custom analysis program (Matlab, Natick, MA). The algorithm for defining the test line region of interest (ROI) was as follows. First, in a graphical display of the test region image, the user marked the center of a fiducial line. A starting location for the center of the test line ROI was set at 140 pixels upstream of the mark and the ROI was swept over a 20-pixel range (along the direction of sample flow) about the starting position. For each location of the test line ROI, the average grayscale intensity was calculated and the test line ROI was set at the location of the minimum average grayscale intensity. Once this test line ROI was defined, a reference ROI of the same size was then defined 50 pixels upstream of the test line ROI and the average grayscale intensity of the reference ROI was measured. Each ROI was 50 pixels by 30 pixels. The signal was defined as the average grayscale intensity in the test line subtracted from the average grayscale intensity in the control line.
2DPN assay cards
For each assay card, 10 μl of sample was added to the sample pad, 10 μl of water was added to the buffer pad, and 40 μl of water was added to the source pad upstream of the signal amplification reagent pads. The card was then folded such that each of the pads made contact with the appropriate inlet. Regions around the paper network contain adhesive that seals the device closed. The detection region of the card was then scanned (1200 dpi) at 40 min. Each of the concentrations (40, 20, 10, 5, and 0 ng/mL for the amplified case and 40, 20, 10, and 0 ng/mL for the unamplified case) were run in replicates of N=4 for a total of 36 tests. An amplified test was considered to have run properly if the control line contained purple, indicating that both the conjugate and the gold enhancement reagent had arrived at the detection region. Only one of the cards did not run properly according to this criterion. Images were again processed using the custom analysis program with the following algorithm. First, in a graphical display of the test region image, the user marked the center of the control line. A starting location for the center of the test line ROI was set at 86 pixels upstream of the mark and the ROI was swept over a 20-pixel range (along the direction of sample flow) about the starting position. For each location of the test line ROI, the average grayscale intensity was calculated, and the test line ROI was set at the location of the minimum average grayscale intensity. Once this test line ROI was defined, a reference ROI of the same size was then defined 20 pixels upstream of the test line ROI and the average grayscale intensity of the reference ROI was measured. Each ROI was 50 pixels by 10 pixels. The assay signal was defined as the average grayscale intensity in the test line ROI subtracted from the average grayscale intensity in the reference ROI. The average signal and standard deviation for each concentration was calculated. The slope near zero of the average signal vs. concentration curve was calculated for the amplified (lowest 3 concentrations) and the unamplified cases (all 4 concentrations). An estimate of the LOD was calculated, assuming the signal of the zero concentration samples followed an approximately Gaussian distribution, using , where σ is the standard deviation of the zero concentrations and S is the slope of the response curve. An estimate of the uncertainty in the LOD was calculated assuming standard propagation of error , where δσ is the uncertainty in the standard deviation of the zero concentrations and δS is the standard error of the slope. An estimate of the statistical significance that the LOD s for the amplified and unamplified cases arise from different distributions was calculated using the Herrnstein’s ρ statistic. Briefly, LOD data were simulated using a Monte Carlo approach based on sampling (N=1×10⁶) two Gaussian distributions, with means and standard deviations given by the LOD s and δLOD s above. The simulated data sets were then used to calculate the ρ statistic, the fraction of pairs for which the LOD for the amplified assay is greater than the LOD for the unamplified assay, and related to the area of overlap in the two LOD distributions.
3.1 Results and Discussion
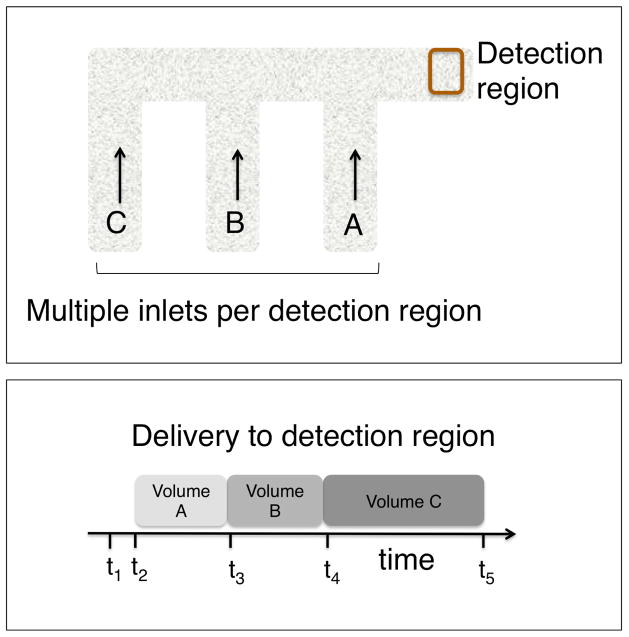
The power of the 2DPN lies in its capability to perform automated multi-step processing. The upper panel of Figure 1 shows a schematic of a 3-inlet 2DPN with multiple inlets per detection region. The path length from an inlet to the detection region increases from right to left. Simultaneous application of reagents to the multiple inlets results in the sequential delivery of the reagents to the detection region in a programmed sequence as shown schematically in the lower panel of Figure 1. The programming of additional steps with additional reagents can be implemented through straightforward extension of the paper network.
Figure 1.
(Top) Sequential delivery in a 2DPN. The 2DPN with multiple inlets per detection region enables the implementation of automated multi-step processes. (Bottom) The path length from an inlet to the detection region increases from right to left, such that simultaneous application of reagents to the inlets results in the programmed delivery of first reagent A, next reagent B, and then reagent C. The dimensions of the network can be adjusted to accept the volumes required for a given application. Sequential application of multiple reagents to the detection region can be implemented to perform multi-step processing.
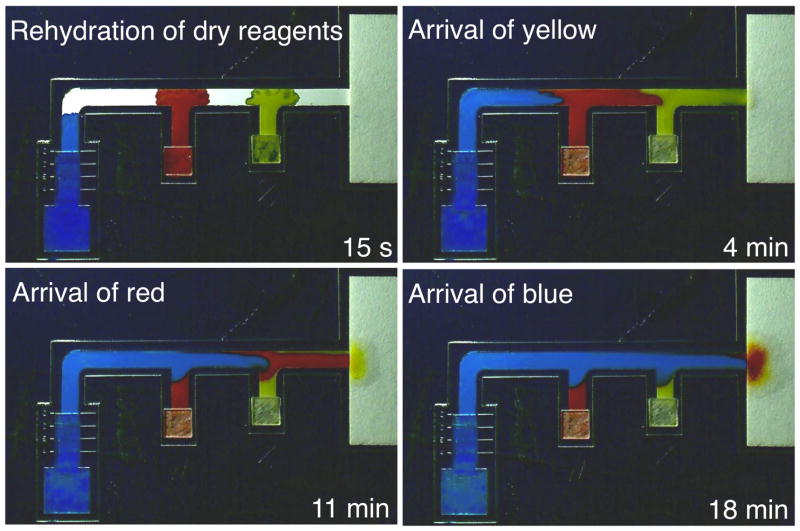
Figure 2 shows programmed sequential delivery in a 3-inlet 2DPN. Activation of simultaneous fluid flows into the inlets resulted in staging of the fluids in the horizontal leg for sequential delivery to the detection region. The fluids arrived in the order yellow, red, and then blue.
Figure 2.
Visualization of multiple flows in a 2DPN. Image series at different time points showing various stages of sequential delivery of the three fluids. Activation of simultaneous fluid flows into the inlets resulted in a staging of the fluids in the horizontal leg and delivery of yellow, red, and then blue. The colored fluid volumes applied to the pads were 10 μl of yellow, 10 μl of red, and 40 μl of blue. The contrast and brightness of the images were adjusted for display.
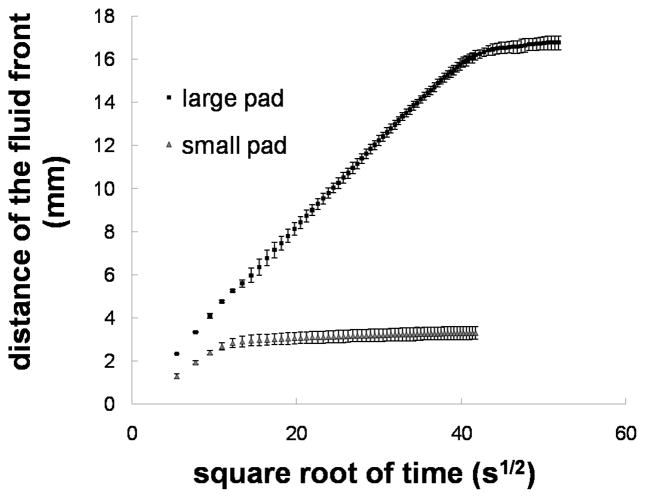
The method of volume metering used in the 2DPN card format demonstrated here is based on reproducible fluid release from pads of varying fluid capacities. Figure 3 shows a plot of the fluid release profiles from glass fiber source pads of two different fluid capacities, ~40 μl and 10 μl. The plot shows that flow follows the Washburn relation, i.e. the distance traveled by the fluid front is proportional to the square root of time. The coefficient of variation for times greater than 30 s was less than 10% for both cases. The rate of fluid volume released into the nitrocellulose can be tuned by varying the cross-sectional area of the inlet. The distance traveled by the fluid front, d, is approximately related to the volume delivered, V, at each time point, t by the relation V(t) ~ PAd(t), where P is the porosity and A is the cross-sectional area of the strip. However, since the saturation of fluid within the porous matrix is known to be less than 100%, and decreases with increasing distance from the source [20], the formula overestimates the volume delivered at later times.
Figure 3.
Volume metering using pads of varying fluid capacities. The plot shows the average distance of the fluid front vs. time for a larger capacity source pad, ~40 μl (squares), and a smaller capacity source pad, ~10 μl (triangles). The plot shows that flow follows the Washburn relation until the shut-off volume is reached. Each data point is the average of 4 (large pad) or 5 (small pad) measurements and the error bars represent the standard deviation. The coefficient of variation for times greater than 30 s was less than 10%.
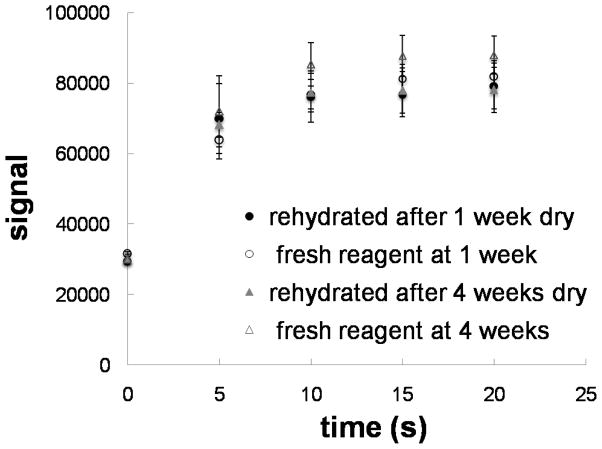
Another feature of the 2DPN format demonstrated here is the storage of all reagents in dry form on the card. The specific gold enhancement reagent used here was a four-component system that must be combined immediately prior to use. Thus, on-card dry storage significantly simplifies ease of use. Each of the components was stored dry in a separate pad; the pads were layered in the card such that application of water upstream resulted in rehydration of each component and mixing for downstream delivery to the capture region. A mock assay was performed in which the antibody conjugated to the gold particle labels was patterned in the capture region and the signal evaluated at multiple time points. The plot of Figure 4 shows the signal versus time from rehydrated gold enhancement reagent after 1 and 4 weeks of dry storage. The signal due to fresh gold enhancement reagent is also shown for comparison. The signals from the rehydrated and fresh gold enhancement reagents were within 15% of one another.
Figure 4.
Dry storage and rehydration of the gold enhancement reagent. The plot shows the average signal versus time of the rehydrated gold enhancement reagent after dry storage for 1 week (solid circles) and after dry storage for 4 weeks (solid triangles). Also shown for comparison is the average signal due to fresh gold enhancement reagent at 1 week (hollow circles) and at 4 weeks (hollow triangles). Each data point is the average of 4 measurements and the error bars represent the standard deviation. The average signals from the rehydrated and fresh gold enhancement reagents agreed well at all time points, to within 15% of one another.
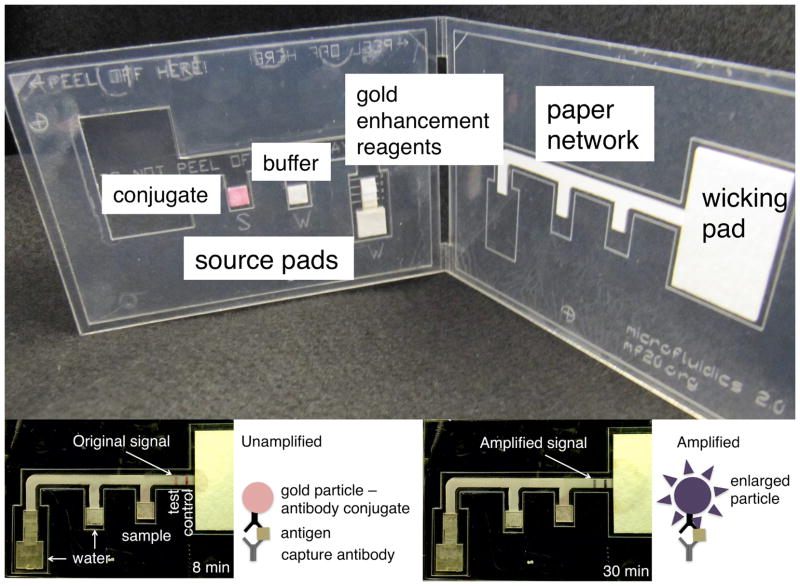
Figure 5 shows an example of a 2DPN card for the detection of the malaria protein PfHRP2 with the main components of the card labeled. The 2DPN card was designed to perform two additional processing steps--automated delivery of rinse and signal amplification reagents--for improved LOD in an easy-to-use format. The 3-inlet network and wicking pad were located on one side of the folding card, while the source pads were located on the opposite side of the folding card. The source pads contained dry reagents, conjugate, buffer, and gold enhancement reagents, from left to right, respectively. The user steps were to simply add sample and water to appropriate places on the card, then fold the device in a single activation step. This set of user steps is comparable in ease of use to commercially-available conventional lateral flow tests and is much less complex than the many timed user steps required to operate alternate microfluidic formats proposed for performing signal amplification steps [14]. After the activation of the multiple flows in the 2DPN card, the sample plus antibody conjugated to a gold particle label was first delivered to the detection region. The signal produced at this stage is comparable to the signal from a conventional lateral flow test. Following this was the delivery of a rinse to the detection region to remove non-specific adsorption. Finally, the signal amplification reagent was delivered to the detection region to produce an amplified signal. Note the control line served to verify to the user that both the conjugate and the gold enhancement reagent arrived at the detection region. Specifically, the control line should contain purple for the test to be considered valid (e.g. no line or a pink line indicate that at least one reagent did not flow through the detection region, see Figure 6A at the far right).
Figure 5.
Easy-to-use 2DPN card format demonstrated for an amplified immunoassay. (Top) Conjugate, buffer, and the gold enhancement reagent components were stored dry on the card for rehydration at the time of use. The user steps are comparable to those required to run a conventional unamplified lateral flow strip test. The user steps were 1) add sample to the pad labeled “S” (~10 μl), 2) add water to the two pads labeled “W” (~10 μl to the smaller one and ~40 μl to the larger one), and 3) fold the device closed to activate the multiple flows. (Bottom) 2DPN assay results for an analyte concentration of 200 ng/mL. The left panel shows the original pink signal after 8 min due to formation of a conventional sandwich structure with a gold particle label in the detection region. The right panel shows the amplified, significantly darkened purple signal after 30 min. The signal amplification reagent used is a commercially-available gold enhancement reagent that results in the deposition of metallic gold onto the orginal particle labels to achieve larger particle labels and an amplified signal.
Figure 6.
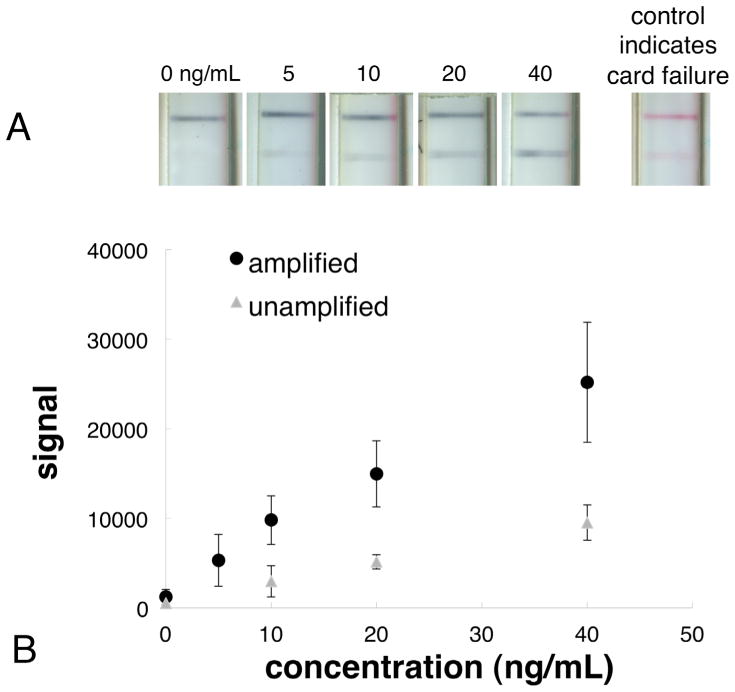
2DPN assay results. (A) Image series of the detection region for different concentrations of PfHRP2. At the far right is an example of an amplified test that did not run properly as indicated by a non-purple control line. (B) Plot of the average signal for each concentration of the 2DPN card with rinse and amplification at 40 min (black circles). Also shown for comparison is a control case in which additional water rather than gold enhancement reagent was run in the 2DPN card format, unamplified assay (gray triangles). Each data point is the average of 4 measurements (with the exception of the data point for 20 ng/mL, which is an average of 3 measurements) and the error bars represent the standard deviation. The limit of detection of the amplified 2DPN malaria card was improved almost 4-fold over the unamplified case.
The detection region of the amplified assay for a concentration series of the analyte is shown in Figure 6A. The signal-versus-concentration curves for the 2DPN cards for the amplified and the unamplified assays are shown in Figure 6B. The limit of detection of the amplified 2DPN malaria card using the gold enhancement reagent was 2.9±1.2 ng/mL, an almost 4-fold improvement over the unamplified case (10.4±4.4). The ρ statistic, related to the overlap of the estimated LOD distributions for the amplified and unamplified assays was 0.05. For context, the LOD of the amplified assay is similar to that reported for a PfHRP2 ELISA of 4 ng/mL [21].
The commercially-available gold enhancement system used here was chosen for ease of use, and has shown promise in other microfluidic formats [22, 23]. However, it is important to note that the 2DPN card format demonstrated here can also be used to implement other signal amplification methods, including silver enhancement of gold nanoparticles [24, 25] and the enzymatic system of horseradish peroxidase/tetramethylbenzidine [26], that have been reported to be useful in lateral flow and other formats, and have great potential for further improvement in LOD.
4.1 Conclusion
We have demonstrated a 2DPN card format that automatically performs the multi-sequence processes required for rinse and signal amplification steps. The 2DPN format is easy to use with all reagents stored dry on card and is appropriate for use in resource-limited settings. The methods demonstrated here could be used to implement a number of other multi-step sample processes in 2DPNs for increased paper-based assay capabilities and performance. Further, for added utility in POC applications, the paper network devices could be straightforwardly modified to accept whole blood samples by the addition of a commercially-available Vivid™ filter (Pall) to remove red cells, white cells, and platelets.
Acknowledgments
We thank Stephen Ramsey, Barry Lutz, Peter Kauffman, Jen Osborn, and Dean Stevens for helpful discussions and SR for assistance with the Monte Carlo analysis. We gratefully acknowledge the support of NIH Grants RC1EB010593 and R01AI096184.
References
- 1.Peeling R, Holmes K, Mabey D, Ronald A. Sexually Transmitted Infections. 2006;82:v1–v6. doi: 10.1136/sti.2006.024265. [DOI] [PMC free article] [PubMed] [Google Scholar]
- 2.Posthuma-Trumpie GA, Korf J, van Amerongen A. Analytical and Bioanalytical Chemistry. 2009;393:569–582. doi: 10.1007/s00216-008-2287-2. [DOI] [PubMed] [Google Scholar]
- 3.O’Farrell B. In: Lateral Flow Immunoassay. Wong R, Tse H, editors. Humana Press; New York: 2009. pp. 1–33. [Google Scholar]
- 4.Martinez AW, Phillips ST, Butte MJ, Whitesides GM. Angewandte Chemie-International Edition. 2007;46:1318–1320. doi: 10.1002/anie.200603817. [DOI] [PMC free article] [PubMed] [Google Scholar]
- 5.Martinez AW, Phillips ST, Whitesides GM. Proceedings of the National Academy of Sciences of the United States of America. 2008;105:19606–19611. doi: 10.1073/pnas.0810903105. [DOI] [PMC free article] [PubMed] [Google Scholar]
- 6.Fenton E, Mascarenas M, Lopez G, Sibbett S. Applied Materials and Interfaces. 2009;1:124–129. doi: 10.1021/am800043z. [DOI] [PubMed] [Google Scholar]
- 7.Abe K, Kotera K, Suzuki K, Citterio D. Analytical and Bioanalytical Chemistry. 2010;398:885–893. doi: 10.1007/s00216-010-4011-2. [DOI] [PubMed] [Google Scholar]
- 8.Li X, Tian JF, Shen W. Analytical and Bioanalytical Chemistry. 2010;396:495–501. doi: 10.1007/s00216-009-3195-9. [DOI] [PubMed] [Google Scholar]
- 9.Dungchai W, Chailapakul O, Henry CS. Analytica Chimica Acta. 2010;674:227–233. doi: 10.1016/j.aca.2010.06.019. [DOI] [PubMed] [Google Scholar]
- 10.Wang W, Wu WY, Wang W, Zhu JJ. Journal of Chromatography A. 2010;1217:3896–3899. doi: 10.1016/j.chroma.2010.04.017. [DOI] [PubMed] [Google Scholar]
- 11.Horton JK, Swinburne S, O’Sullivan MJ. J Immunol Methods. 1991;140:131–4. doi: 10.1016/0022-1759(91)90135-3. [DOI] [PubMed] [Google Scholar]
- 12.Zhang C, Zhang Y, Wang S. Journal of Agricultural and Food Chemistry. 2006;54:2502–2507. doi: 10.1021/jf0531407. [DOI] [PubMed] [Google Scholar]
- 13.Cho JH, Han SM, Paek EH, Cho IH, Paek SH. Analytical Chemistry. 2006;78:793–800. doi: 10.1021/ac051453v. [DOI] [PubMed] [Google Scholar]
- 14.Cho I-H, Seo S-M, Paek E-H, Paek S-H. Journal of Chromatography B. 2010;878:271–277. doi: 10.1016/j.jchromb.2009.07.016. [DOI] [PubMed] [Google Scholar]
- 15.Fu E, Lutz B, Kauffman P, Yager P. Lab on a Chip. 2010;10:918–920. doi: 10.1039/b919614e. [DOI] [PMC free article] [PubMed] [Google Scholar]
- 16.Fu E, Kauffman P, Lutz B, Yager P. Sensors and Actuators B-Chemical. 2010;149:325–328. doi: 10.1016/j.snb.2010.06.024. [DOI] [PMC free article] [PubMed] [Google Scholar]
- 17.Fu E, Ramsey SA, Kauffman P, Lutz B, Yager P. Microfluidics and Nanofluidics. 2011;10:29–35. doi: 10.1007/s10404-010-0643-y. [DOI] [PMC free article] [PubMed] [Google Scholar]
- 18.Osborn J, Lutz B, Fu E, Kauffman P, Stevens D, Yager P. Lab on a Chip. 2010;10:2659–2665. doi: 10.1039/c004821f. [DOI] [PMC free article] [PubMed] [Google Scholar]
- 19.Fu E, Liang T, Houghtaling J, Ramachandran S, Ramsey SA, Lutz B, Yager P. Analytical Chemistry. 2011 doi: 10.1021/ac201950g. dx.doi.org/10.1021/ac201950g. [DOI] [PMC free article] [PubMed] [Google Scholar]
- 20.Williams R. Journal of Colloid and Interface Science. 1981;79:287–288. [Google Scholar]
- 21.Kifude CM, Rajasekariah HG, Sullivan DJ, Stewart VA, Angov E, Martin SK, Diggs CL, Waitumbi JN. Clinical and Vaccine Immunology. 2008;15:1012–1018. doi: 10.1128/CVI.00385-07. [DOI] [PMC free article] [PubMed] [Google Scholar]
- 22.Lei KF, Butt YKC. Microfluidics and Nanofluidics. 2010;8:131–137. [Google Scholar]
- 23.Lei KF, Wong KS. Instrumentation Science & Technology. 2010;38:295–304. [Google Scholar]
- 24.Yan J, Pan D, Zhu CF, Wang LH, Song SP, Fan CH. Journal of Nanoscience and Nanotechnology. 2009;9:1194–1197. doi: 10.1166/jnn.2009.c118. [DOI] [PubMed] [Google Scholar]
- 25.Yeh CH, Hung CY, Chang TC, Lin HP, Lin YC. Microfluidics and Nanofluidics. 2009;6:85–91. [Google Scholar]
- 26.Kolosova AY, De Saeger S, Eremin SA, Van Peteghem C. Analytical and Bioanalytical Chemistry. 2007;387:1095–1104. doi: 10.1007/s00216-006-0991-3. [DOI] [PubMed] [Google Scholar]


