Abstract
This paper proposes the use of a k-space method to obtain the correction for transcranial ultrasound beam focusing. Mirroring past approaches, A synthetic point source at the focal point is numerically excited, and propagated through the skull, using acoustic properties acquired from registered computed tomograpy of the skull being studied. The received data outside the skull contains the correction information and can be phase conjugated (time reversed) and then physically generated to achieve a tight focusing inside the skull, by assuming quasi-plane transmission where shear waves are not present or their contribution can be neglected. Compared with the conventional finite-difference time-domain method for wave propagation simulation, it will be shown that the k-space method is significantly more accurate even for a relatively coarse spatial resolution, leading to a dramatically reduced computation time. Both numerical simulations and experiments conducted on an ex vivo human skull demonstrate that, precise focusing can be realized using the k-space method with a spatial resolution as low as only 2.56 grid points per wavelength, thus allowing treatment planning computation on the order of minutes.
1. Introduction
Transcranial ultrasound has been actively studied in recent years due to its many promising therapeutic applications, such as the treatment of brain tumors (Fry 1977, Jolesz et al. 2005, Pernot et al. 2007, Cohen et al. 2007, Jolesz 2009, Damianou et al. 2009, Colen & Jolesz 2010), thrombolytic stroke treatment (Behrens et al. 2001), and drug delivery (Hynynen et al. 2006, Kinoshita et al. 2006). However, the skull has been a barrier to precise focusing in the brain, due to its variable, and highly contrasting acoustic properties, as compared with brain tissue, and skin, typically leading to severe phase abberations. When an ultrasound beam passes through the skull without correction, the focus is generally shifted and secondary peaks can be significantly increased. These effects degrade therapeutic performance and may potentially harm the tissue outside of the desired focus.
Thanks to the development of phased arrays, several approaches have been proposed to overcome the difficulty of accurately focusing ultrasound in the brain. Clement & Hynynen (2002b) introduced a layered wavevector-frequency domain model to numerically propagate ultrasound from a hemisphere-shaped transducer through the skull using input from computerized tomography (CT) scans of the head (Clement & Hynynen 2002a) to estimate the structural and acoustic properties of the skull. While this approach (Clement & Hynynen 2002b) is well established below 1 MHz and has been applied clinically (Martin et al. 2009, McDannold et al. 2010), its performance is not expected to be optimal at higher frequencies, due to its incapability to take the internal structure of the skull into account (Marquet et al. 2009). Aubry et al. (2003) modeled the wave propagation through the skull using a finite-difference time-domain (FDTD) method, again using the CT imaging, then time-reverse the signal received outside the skull in order to create a tight focus inside the brain (Thomas & Fink 1996, Marquet et al. 2009). In this way, the variable internal structure of the skull bone is considered. This particular method requires a second ionizing modality to facilitate the phase correction, as well as excellent registration between these two modalities. Without precise registration, the beam focusing could be suboptimal (Aubry et al. 2003). These model-based methods can also be extremely time-consuming. For example, a 2009 study by Marquet et al. (2009) reported a two hour computation time to perform a 3D simulation through the skull. To overcome these drawbacks, point-target based algorithms have been proposed. For example, acoustic droplet vaporization (ADV) has been suggested as a potential in situ point-target for aberration correction, nevertheless a prior injection is required (Haworth et al. 2008) and viability in vivo has yet to be established. In a more recent paper (Gateau et al. 2010), a two-step adaptive focusing technique was also investigated. In the first step, the FDTD- and CT-based phase correction method was used to introduce a cavitation bubble by a high intensity pulse. The second step is to use the acoustic emission of the bubble to maximize the pressure amplitude at the target point.
The present study concentrates on improving the computational efficiency of the CT-based correction method. Instead of using conventional FDTD approach, a k-space method (Mast et al. 2001, Mast 2002, Tabei et al. 2002, Cox et al. 2007) is used to simulate the wave propagation through the skull. An inherent advantage of the k-space method is that, it can accurately calculate the phase abberation from the skull even if a coarse mesh is used. On the other hand, FDTD needs very fine mesh to capture the phase information, which inevitably leads to a long computation time and becomes demanding of the computational resource. An efficient computational algorithm is especially useful if the ultrasound beam needs to be focused at multiple locations relatively far away from each other, and the simulation may need to be carried out multiple times.
The paper is structured as follows: In Sec.II, the theory of the k-space method is briefly revisited. Section III discusses simulation results for wave propagation through the skull using the k-space method and its application for time-reversal transcranial focusing. Section IV presents the experimental results and Section V concludes the paper.
2. Theory
For a fluid medium with inhomogeneous acoustic properties, the linearized acoustic wave equation can be written as
| (1) |
where p is the sound pressure, c is the sound speed, δ is the sound diffusivity, and ρ is the ambient density. All material are assumed to be spatially varying functions. The equation inherently assumes a thermoviscous fluid, as the relaxation mechanism is not considered. However, it can be readily modified to include power law absorption and dispersion (Treebya & Cox 2010).
By using the normalized wave field (Mast et al. 2001), the first-order derivative term is eliminated and Eq.(1) becomes
| (2) |
where c0 is the background speed of sound.
Following the approach originally described by Mast et al. (2001), an auxiliary field is defined by w = f + v, where . Eq. (2) can then be reduced to
| (3) |
where
| (4) |
Fourier transformations of Eq. (3) in the spatial domain yields the k-space equation
| (5) |
where , W, V, Q, and D are the spatial Fourier transform of w, v, q and d, respectively, which can be readily calculated using a fast Fourier transform algorithm. This step is crucial, as in this way the differentiation in the wave equation is calculated by the Fourier transform as opposed to the conventional finite-difference approximation, which is known to have a relatively large linear phase error (dispersion error) (Liu 1998). On the other hand, the k-space method can be viewed as a limiting case of an infinite-order accurate finite-difference method, which theoretically only requires two nodes per wavelength to achieve exact solutions for wave equations with smoothly varying coefficients (Liu 1998).
Equation (5) can be solved in a nonstandard finite difference approach (Mast et al. 2001, Tabei et al. 2002),
| (6) |
where Δt is the temporal step-size. The stability condition was given as (Mast et al. 2001)
| (7) |
where CFL is the Courant-Friedrichs-Lewy number cmaxΔt/Δx.
To calculate D (or d), the following first order backward difference approximation was employed,
| (8) |
Finally, an absorption layer is built into the algorithm to effectively eliminate the wrap-around artifact (Kosloff & Kosloff 1986, Mast 2002). The equation for the absorbing layer can be written in f as
| (9) |
where γ is an absorption term (frequency independent). In this study, we have used (Kosloff & Kosloff 1986)
| (10) |
where U0 is a constant (2.0 in the present study), α is a decay factor (0.1 in the present study), and n denotes the distance in number of grid points from the boundary. This equation was also implemented by the k-space method.
To close this section, it is noted that a slightly different k-space algorithm (Tabei et al. 2002, Tillet et al. 2009) was also proposed based on the first-order wave equations, which was shown to be more accurate when the contrast is large, but requires extra computation and storage of the particle displacement vector.
3. Numerical simulations
3.1. Evaluation of the k-space method for transcranial wave propagation
It is well known that the k-space method is highly accurate for homogeneous media or weakly inhomogeneous media even when there are only two grid points per wavelength (Mast et al. 2001), as opposed to 8–10 grid points per wavelength required by the conventional 4th order FDTD algorithm. However, its accuracy quickly deteriorates as the contrast in the acoustic media becomes large, which is the case for transcranial wave propagation, as the speed of sound and density are much larger than the brain tissue. Therefore, it is crucial to first test the k-space method for transcranial wave propagation with varied grid point sizes and to find the optimal spatial resolution.
In order to test the k-space wave propagation code with extremely fine spatial resolution, a 2D problem was studied. Densities in the skull were acquired from CT scans while other acoustic properties were obtained utilizing the empirical equations (Aubry et al. 2003, Marquet et al. 2009):
| (11) |
where H is the Hounsfield unit, ψ is the porosity, cwater is the speed of sound in water, cbone is the maximum speed of sound in the skull (set to be 2900 m/s here), abs is the absorption coefficient, absmin and absmax are 0.02dBmm−1 and 1dBmm−1, respectively. To convert abs to the diffusivity δ, δ = abs × 2 × c3/ω2 was used (Hamilton & Blackstock 1998). Finally, β is set to be 0.5 (Aubry et al. 2003). The choices for these acoustic parameters come from available literature. For example, The cortical bone was found to have an average speed of sound around 2471 ± 90m/s near 1 MHz (Pichardo et al. 2011), so cbone was chosen such that the average speed of sound is in this range. The minimal and maximal values for absorption used were 0.2db/mm and 8dB/mm at 1.5Mhz (Aubry et al. 2003). The minimal and maximal values in this study were therefore chosen to be smaller because the primary frequency in this study is lower, i.e., 1 MHz. Even though the numbers 0.02dB/mm and 1dB/mm are empirical, additional simulations considering a range of absorption coefficients yielded no significant impact on the focusing profile (side lobes, accuracy of the focusing), which is the main concern in this paper. However, it is further noted that in this section, diffusivity was not considered (set to zero). This is a necessary step since time-reversal theory is invalid if an odd order time derivative (diffusivity in this case) exists. As will be shown later, the diffusivity is considered when simulating wave propagation from the transducer to the skull in the next section.
The current code does not simulate the shear wave propagation. Nevertheless, shear waves can be neglected when the incident angle is small (<20 degree) (Clement et al. 2004), which is the case in our study.
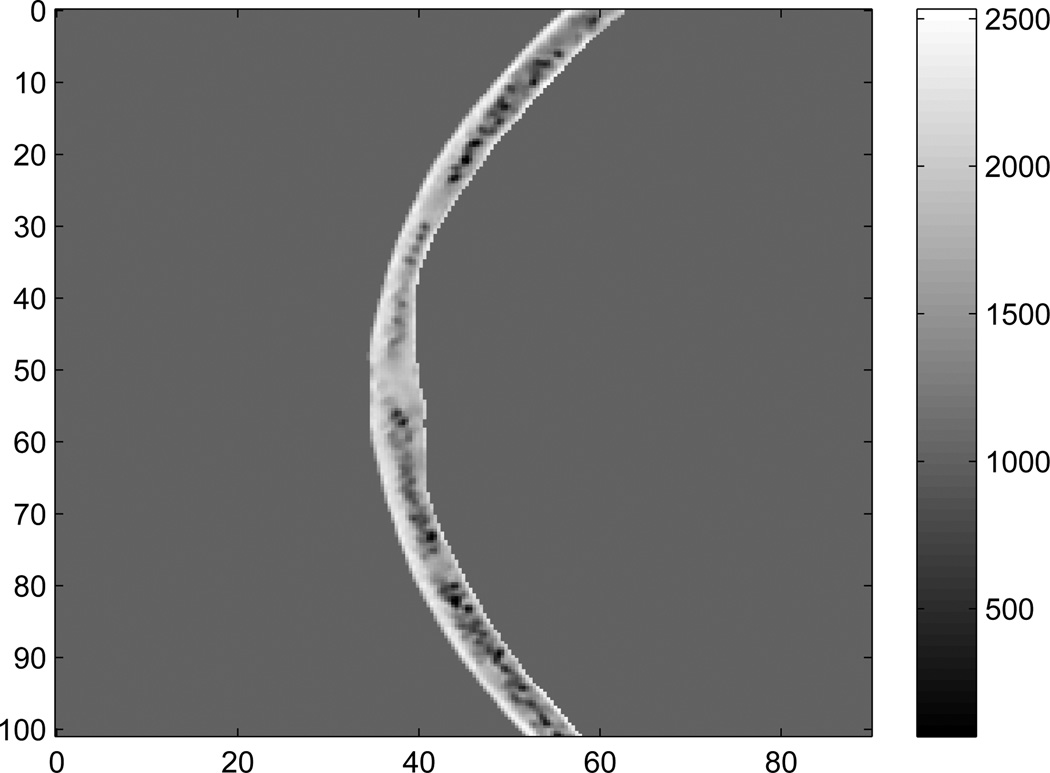
Figure 1 shows a 2D cross-section of skull density as determined from CT Houndsfeld units. Note that at a few locations the densities in the skull are smaller than the water, and there are two potential reasons: The skulls are stored in a Formaldehyde solution (ρ = 0.8g/cm3), which may be present within bone cavities. Also, there are a few locations (e.g. the sinus cavities) that may contain air bubbles.
Figure 1.
Density (kg/m3) of one slice of the skull used for 2D simulation. The axes are in mm.
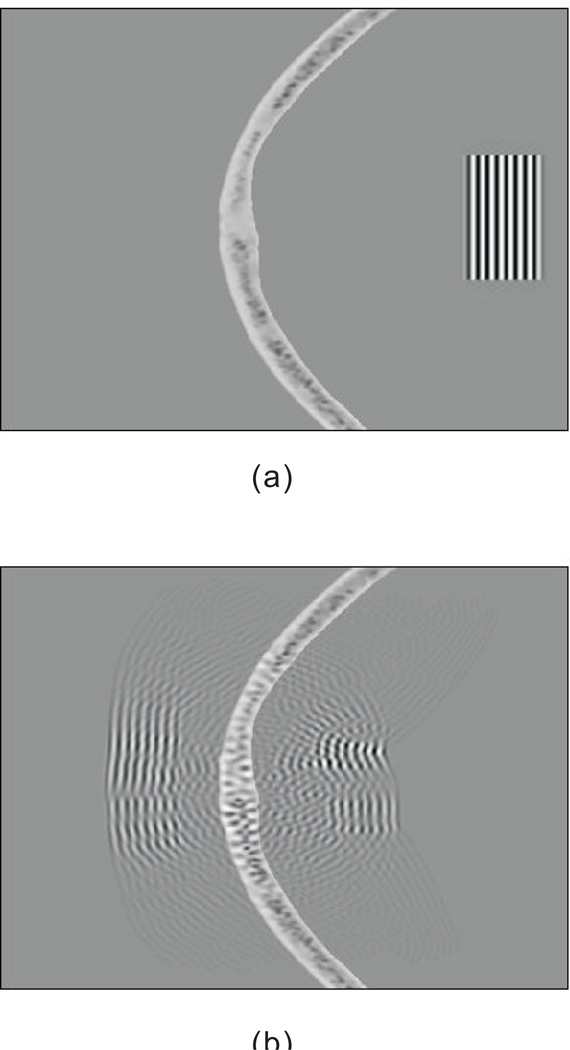
A 8-cycle quasi-plane wave with a center frequency of 1Mhz was first generated inside the skull, and propagated towards the outside of the skull. To mimic experimental condition, the skull was considered to be submerged in water. Figure 2 illustrates the simulation at two different times, showing severe distortion and scattering due to the skull.
Figure 2.
Propagation of a quasi-plane wave through a skull in 2D. (a) time 0µs, (b)time 37 µs.
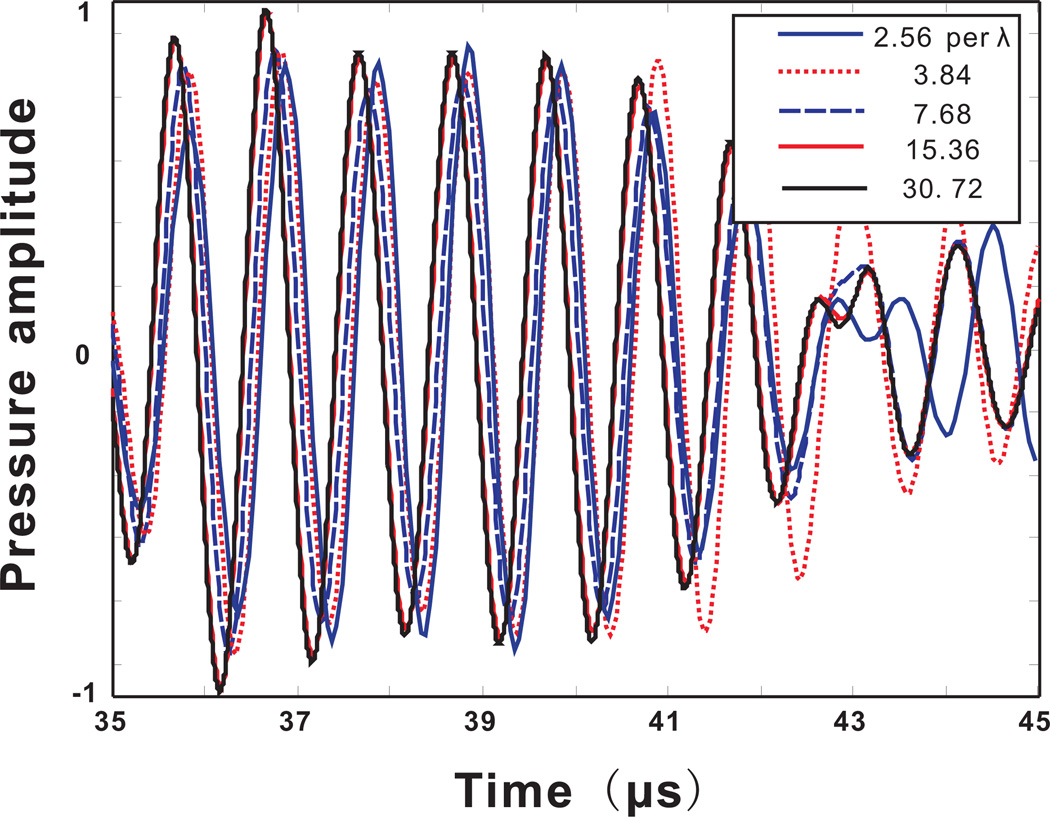
To assess the accuracy of the model as a function of spatial resolution, pressures were recorded at a fixed location outside the skull (20 mm, 38.3 mm in the coordinates of Figure 1). Five different spatial resolutions were considered. The original spatial resolution given by the CT scan was 3.84 grid points per wavelength at 1Mhz in water. The wavelength λ in this case corresponds to 1.5mm. Throughout the paper, the resolution is always calculated based on this wavelength, unless otherwise mentioned. Noting that the wavelength in the skull is generally higher than in water or tissue, this choice of a reference wavelength assures that a spatial resolution, once deemed appropriate for simulating wave propagation in water, will also be suitable for the simulation in the skull. The original slice resolution, not used in the 2D case though, was 1mm. The acoustic properties of the skull were linearly interpolated to have 2.56, 7.68, 15.36 and 30.72 grid points per wavelength. Note that, to satisfy the Nyquist frequency, the spatial resolution cannot go below 2 grid points per wavelength. The time step was fixed and the Courant-Friedrichs-Lewy (CFL) number, i.e., cmaxΔt/Δx, was 0.25. For comparison, an FDTD calculation was also carried out, where the spatial derivative was calculated based on a fourth order approximation. The leap-frog algorithm was used for time-stepping and the CFL number was 0.2.
Figure 3 shows the pressure calculated by the k-space method at the point of measurement. Considering the results at the highest resolution as the reference, a coarse mesh introduced some slight phase and amplitude errors. For example, for the lowest spatial resolution, the phase error is around T/5 where T is the period. It was predicted that these errors would be small, as compared to error caused by noise and alignment under physical conditions. This prediction will later be verified in Sec.4. The results seem to converge well as the spatial resolution approaches the maximum. It also appears that a spatial resolution at 7.68 grid points per wavelength may be sufficient for obtaining relatively reliable results (phase error smaller than T/8 (Aubry et al. 2003)), providing a good tradeoff between computation accuracy and efficiency.
Figure 3.
(Color online)Acoustic pressure measured at a location outside the skull. Calculated from the k-space method with different spatial resolutions.
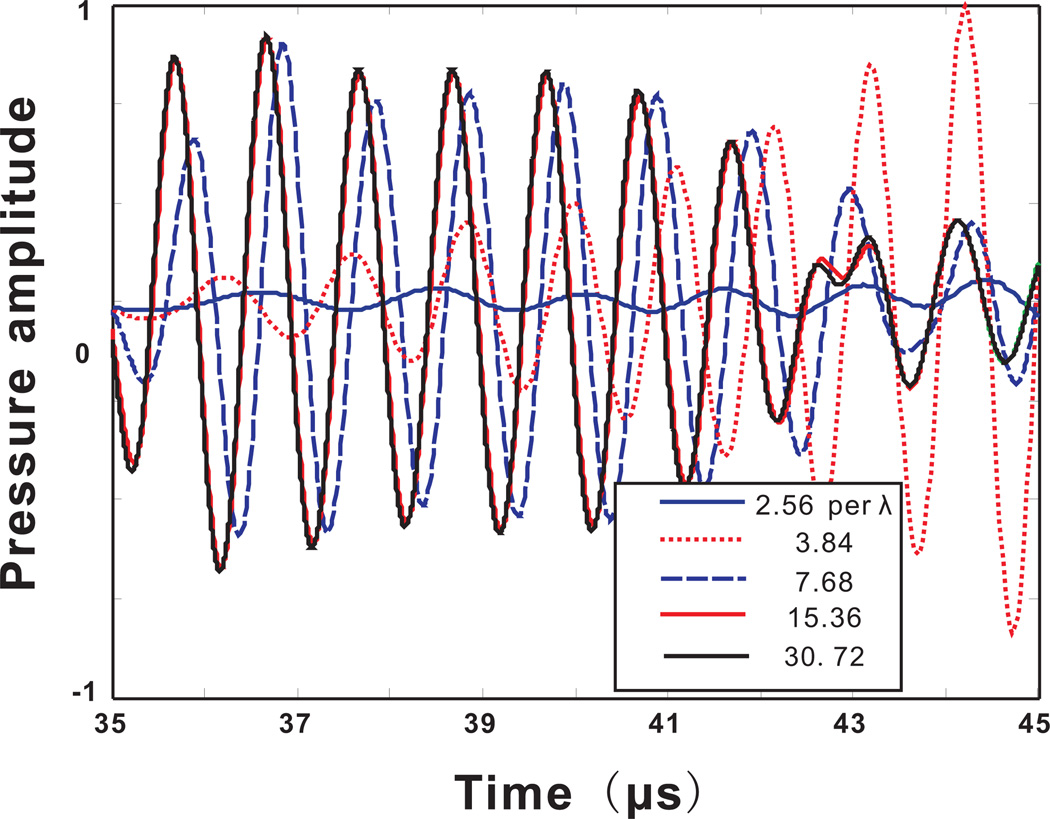
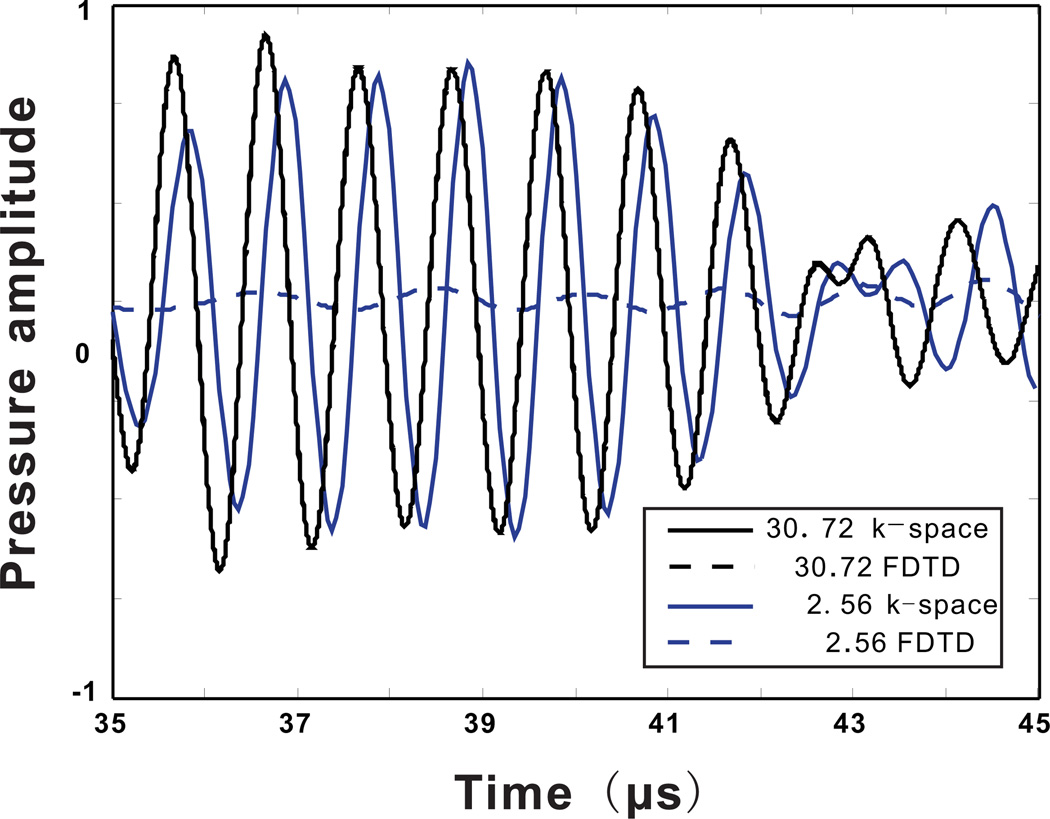
Figure 4 presents results calculated by the FDTD method. In the case of a coarse mesh, FDTD generated a result that is greatly contaminated by the phase error, which seems to dominate over any other errors. Figure 5 shows the results for both the k-space and the FDTD method for the spatial resolutions of 2.56 and 30.72 grid points per wavelength. At the spatial resolution of 30.76 grid points per wavelength, the k-space and FDTD method yield similar results. There is also excellent agreement when using 16 grid points per wavelength. In contrast, at a low spatial resolution, the FDTD method is significantly less accurate. The reason why the FDTD method at a low spatial resolution gives such low pressure amplitudes is because of the large dispersion error, so the large pressure amplitude can only be seen in a much later time which is not included in the current time-frame.
Figure 4.
(Color online)Acoustic pressure measured at a location outside the skull. Calculated from the FDTD method with different spatial resolutions.
Figure 5.
(Color online)Comparison between the k-space and FDTD method for ultrasound simulation through the skull using two different spatial resolutions. One with 30.72 grid points per wavelength, one with 2.56 grid points wavelength.
Additional comparisons (not shown here) also indicate that the k-space method with a spatial resolution of 7.68 grid points per wavelength contain less error than the FDTD method at the same resolution,e.g.,T/8 vs T/6 for phase error.
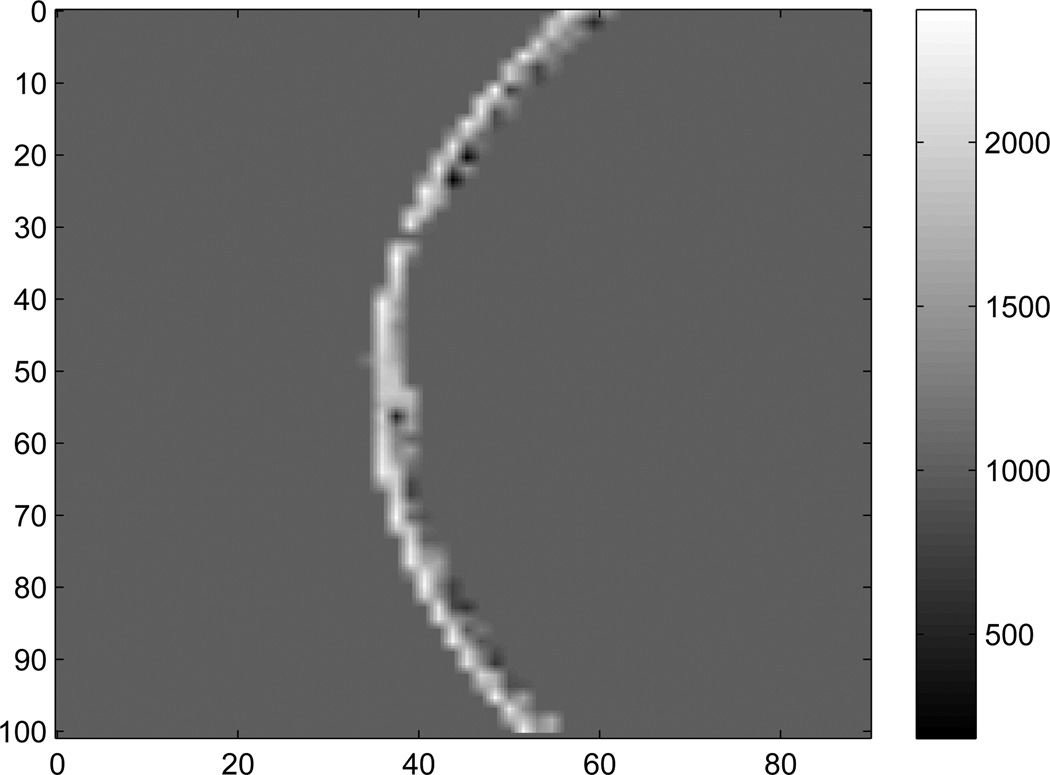
As the resolution decreases, not only does numerical model become less accurate, but also the fine-structure of the skull becomes lost. To close this section, we test whether or not it is necessary to model the fine-structure of the skull. A 4-cycle quasi-plane wave with a center frequency of 400Khz was generated inside the skull, and numerically propagated using the k-space method towards outside of the skull. At this frequency, the original CT scan resolution is 1/9.6 of the wavelength, and the simulation is expected to be accurate without interpolations according to the study above. Two separate simulations were carried out. The first one employed the original CT scan resolution, while the second one interpolated the skull profile so that the internal structure resolution became 1/2.4 of the wavelength and then, the spatial resolution was interpolated back again to be the same in the first simulation. In this case, these two simulations have the same accuracy in terms of their numerical algorithm, but the second one discarded the fine structure of the skull. Figure 6 shows the density of the skull for the second simulation, which can be directly compared with Fig. 1.
Figure 6.
Density (kg/m3) of one slice of the skull used for 2D simulation without the fine-structure of the skull. The axes are in mm.
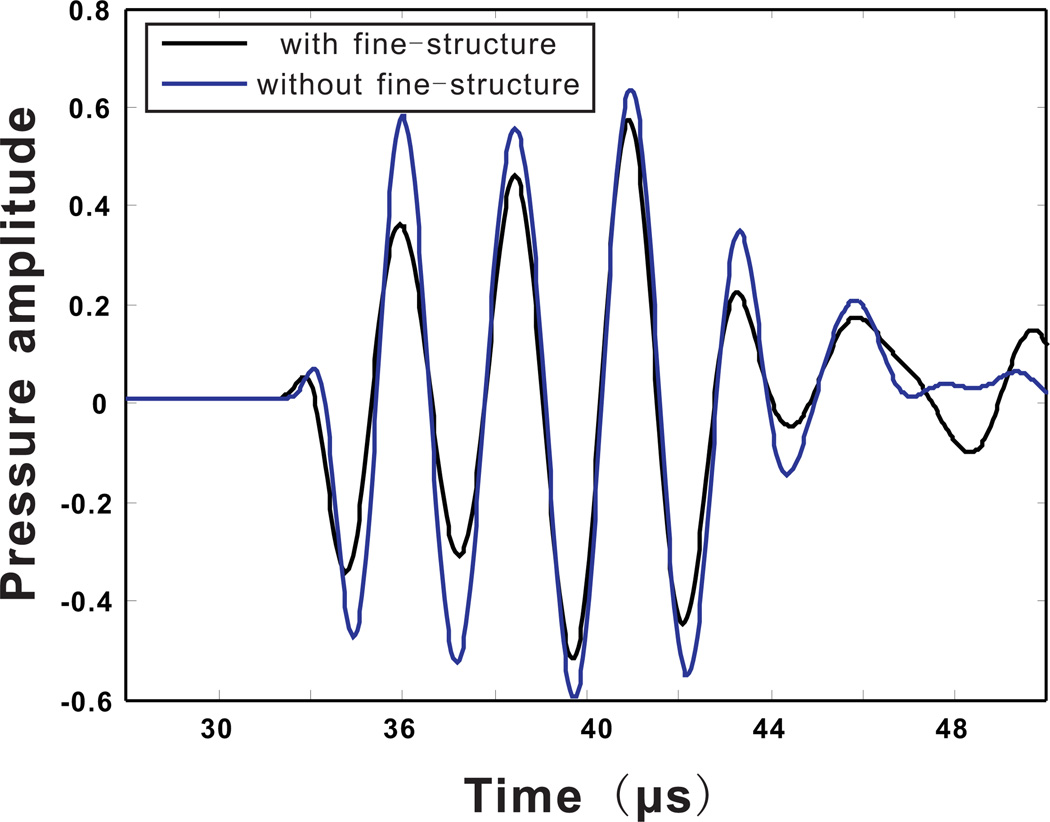
The sound pressure was again recorded at (20 mm, 38.3 mm), and is plotted in Fig. 7. It can be seen that some amplitude errors occur. However, even without considering the fine-structure in the skull, the phase of the pressure can still be predicted. This is important for phase correction in transcranial focusing.
Figure 7.
(Color online)Acoustic pressure measured at a location outside the skull. Calculated from the k-space method with and without the internal fine-structure of the skull.
Even though only one frequency was tested here, the conclusion at 400Khz can be extended to other frequencies. In this study, a low resolution that is 1/2.4 wavelength was employed, however, this is the wavelength in the water. The wavelength in the skull is actually larger because of the speed of sound is larger, and the CT resolution is in fact approximately 1/4 wavelength in the skull, in an average sense. A microstructure that is smaller than this CT resolution, i.e., 1/4 wavelength, should not strongly affect the acoustic transmission or reflection, because it is moderately sub-wavelength. Therefore it is expected that neglecting the fine microstructure (with a size smaller than about half of the wavelength in water) in the skull at other frequencies is also a reasonable simplification.
3.2. Phase correction using the time-reversal technique and the k-space method
To estimate the appropriate phase correction for transcranial beam focusing, a point source was excited at the desired focus, and the propagation through the skull was simulated using the FDTD method with the CT imaging as the input (Aubry et al. 2003). The time-reversal technique utilizes the fact that the lossless wave equation only has a second order time derivative, indicating that if p(t) is a solution to the equation, p(−t) is also a solution (Fink & Prada 2001). Therefore if received acoustic signal can be emitted in a time-reversed manner, the point source (a focal point) can be reconstructed. It has been found that in the last section that k-space method produces much less numerical errors compared with the FDTD method at a low spatial resolution. Therefore, it is hypothesized that it is feasible to obtain the phase correction using the k-space method with a coarse spatial resolution. This section aims to verify this hypothesis. It is noted that the amplitude change due to the attenuation in the skull is not corrected in the current algorithm.
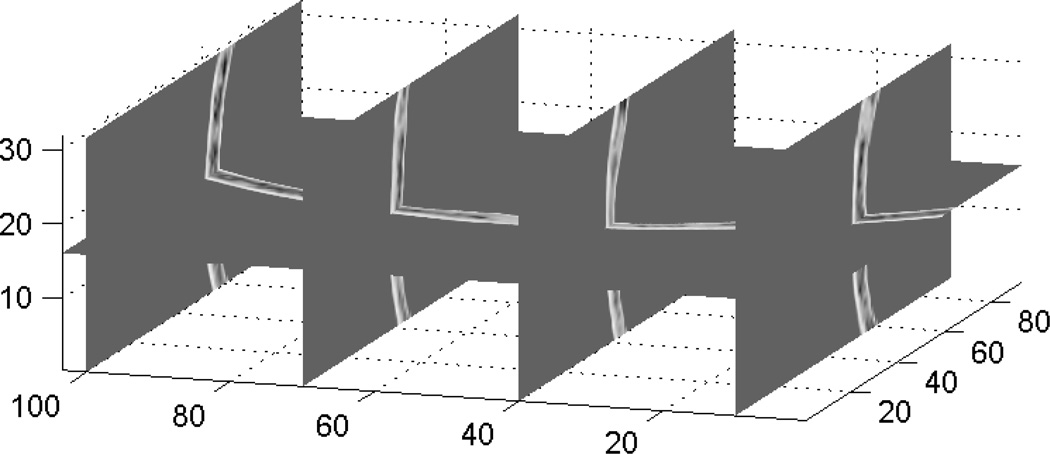
To account for the out-of-plane refraction, 3D full simulations were carried out. Figure 8 shows the portion of the 3D skull used for the simulation. The center of this portion of the skull is shown in Fig. 1. The focus was set at 50mm below the skull and the virtual receivers were 10mm away from the skull surface.
Figure 8.
A 3-D spatial representation of the sound speed distribution deduced from CT scans and used as input data for the full 3D simulation. The axes are in mm.
Five separate simulations using the k-space method were carried out. The first one used a fine spatial resolution (7.68 grid points per wavelength) for both backward (from inside of the skull to outside) and forward (from outside of the skull to inside) wave propagations. A higher spatial resolution leads to a prohibitive computational burden. Once again, the diffusivity was only considered in the forward propagation.
For the backward propagation, the computational dimension was 47mm × 100mm × 31mm, and the matrix size was 241 × 517 × 159. This relatively small matrix size was allowed because: 1. The virtual receiver array was considered to be small, and the size approximately corresponds to the 1D array that our lab currently possesses (details can be found in Sec. 4) 2. The propagation in the tissue can be modelled by faster simulation approaches, e.g., a ray-tracing code (Marquet et al. 2009). Therefore, the k-space method was only applied to simulate the wave propagation through the skull and to a plane (transducer plane) close to the skull.
The second and third simulations used two relatively coarse spatial resolutions (2.56 and 3.84 grid points per wavelength) for the backward propagation and the fine spatial resolution for the forward propagation. The matrix sizes were 83 × 171 × 53 and 121 × 259 × 77, respectively.
The fourth simulation used the fine spatial resolution for both propagations, however, the medium was considered homogeneous in the backward propagation, i.e., the skull was not considered and no correction was applied. In the last simulation, a coarse spatial resolution (2.56 grid points per wavelength) was used for the backward propagation and the fine spatial resolution was used for the forward propagation. In this simulation, the backward propagation was implemented by FDTD.
In the second, the third and the last simulations, the signal outside the skull obtained from the coarse mesh based simulation was linearly interpolated as the input to the forward propagation with the fine resolution. The fourth simulation provides a reference as to how much the focus can be distorted by the phase abberation from the skull.
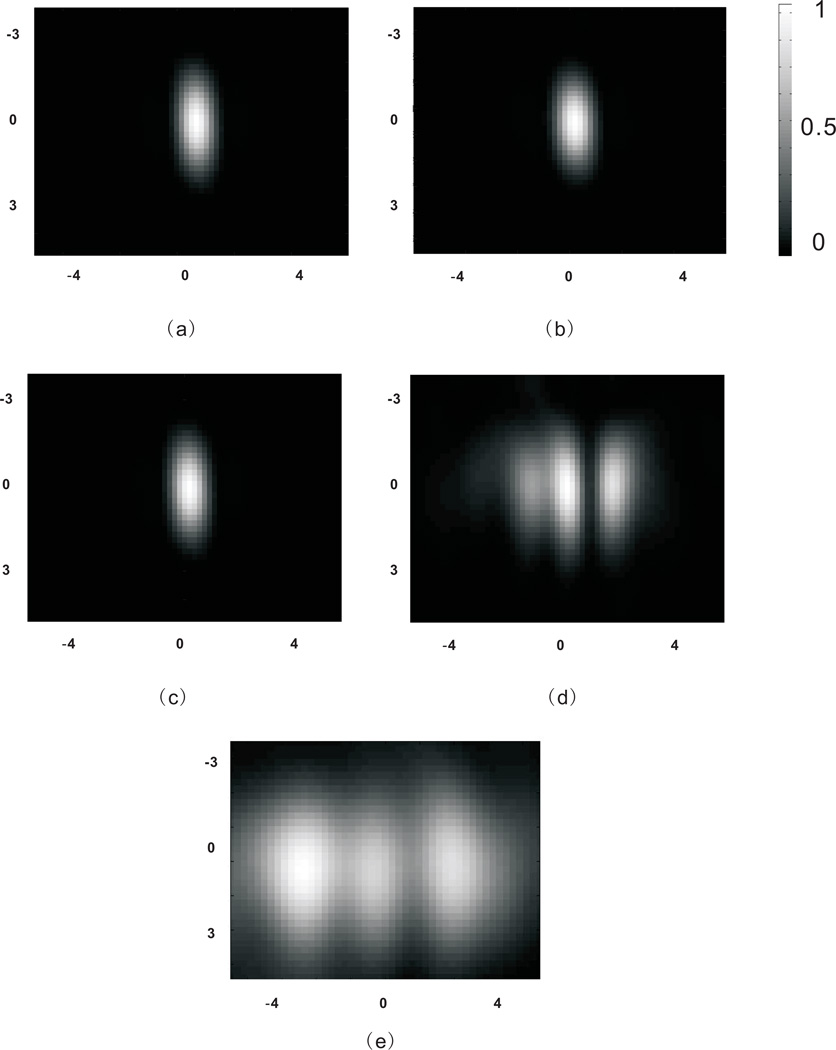
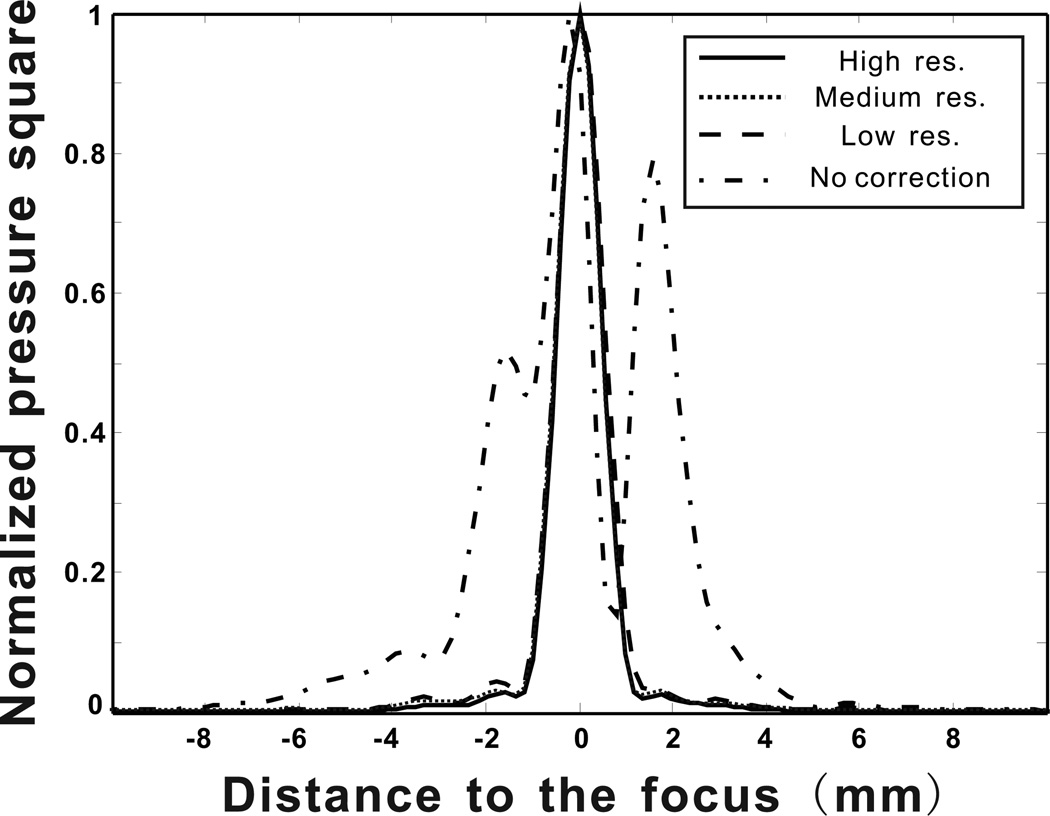
Figure 9 shows the pressure square distribution on the focal plane for every case considered. It can be observed that a tight focus can be generated only if phase correction was applied. The backward propagation calculated using medium (3.84 grid points per wavelength) and low (2.56 grid points per wavelength) spatial resolutions seem to be able to provide sufficient information for phase corrections, as visually there is no difference between these calculations using different resolutions. On the other hand, the simulation with the low spatial resolution from FDTD shows poor focusing through the skull. To further compare these cases, Fig. 10 shows the pressure square distribution along a line crossing the focal point (the result with FDTD is not shown because its inaccuracy is proven in Fig.9). It can be seen that the calculation with coarse spatial resolutions produces only slightly higher side lobes, while the one without considering the skull suffers from a strong defocusing effect. In overall, calculations based on all resolutions can focus the ultrasound beam through the skull. However, the one with the low spatial resolution is much less time-consuming, which only took 17 seconds. The one with the medium spatial resolution took 1.8 minutes and the high spatial resolution took 24 minutes. The algorithm was implemented using Matlab on a XP 64-bit operating system. The hardware consisted of four dual-core 2.67GHz Xeon processors, and 24GB of RAM.
Figure 9.
Normalized pressure square distribution on the focal plane. (a) With high spatial resolutions for both forward and backward propagations. (b) With medium spatial resolution for backward propagation and high spatial resolution for forward propagation. (c) With low spatial resolution for backward propagation and high spatial resolution for forward propagation. (d) With high spatial resolutions for both forward and backward propagations, however, the skull was not considered for the backward propagation. (e) With low spatial resolution for backward propagation using FDTD and high spatial resolution for forward propagation. The axes are in mm.
Figure 10.
Pressure square distribution along a line crossing the focal point from four different calculations.
This result is significant, as the computation time at the high spatial resolution was reduced by a factor of 84 when the low spatial resolution was used. Even though for the real application where a much larger hemispherical array will be used, indicating a larger computational domain, the proposed approach can still be efficient and can potentially lead to a quasi-real-time transcranial beam focusing. For the FDTD method, the computation time is similar to the k-space method for the same spatial resolution. However, as shown in Fig. 9, the FDTD method implemented at a low resolutions produces very large errors that prevent its application for time-reversal transcranial beam focusing.
4. Experimental verifications
The goal of this section is to experimentally verify the transcranial focusing using the k-space method with a coarse spatial resolution.
4.1. Methods
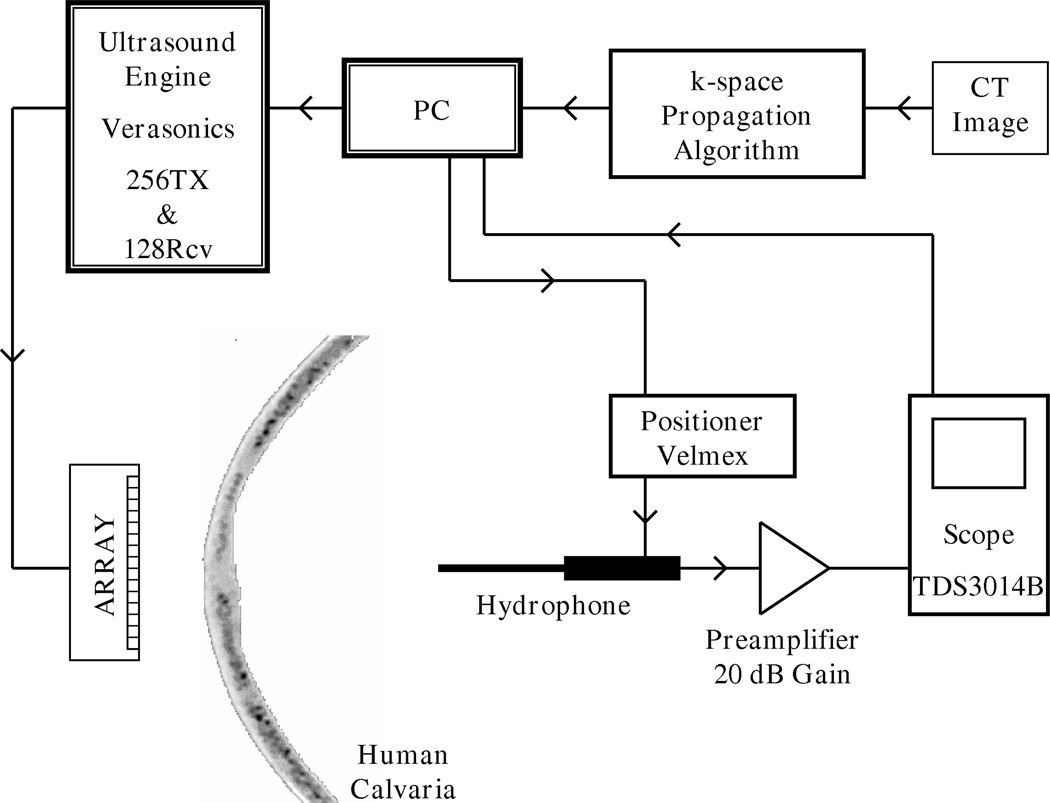
Previous studies, which proposes FDTD as a numerical solution method, used a 1D array for the experimental verification of transcranial ultrasound propagation problem (Aubry et al. 2003). In order to be consistent with these studies and for comparison, a 1D, linear ultrasound imaging transducer array (Material Systems Inc., Littleton, MA) was used in the experiments. This custom transducer is operating at frequencies (≤·1 MHz) lower than commercially available ultrasound probes (Meral & Clement 2010). The transducer consists of 128 linear elements, whose element width is 0.65 mm, pitch is 0.75 mm and element height in the elevation direction is 20 mm. An ultrasound engine (Verasonics, Redmond, WA) with custom modifications allowing it to perform at megahertz frequencies and below was used to operate the transducer array. The ultrasound engine has the capability of transmitting and receiving from 128 independently controlled channels. A hydrophone (400µm Onda Corporation, Sunnyvale, CA), mounted on a 3 axis positioner system (Velmex, Bloomfield, NY) was used to scan the acoustic pressure field of a focused beam created inside the skull. Hydrophone signal was amplified by 20 dB (AH-2010, Onda Corporation, Sunnyvale, CA), recorded by a digital oscilloscope (TDS3014B, Tektronix, Inc., Beaverton, OR) and transferred to Matlab for further processing. An ex-vivo, formalin fixed human calvaria, stored in 10% buffered formalin solution and room temperature was used in the experiments. This skull is identical to the one used in Section 3 whose properties were computed from CT images. Distinct patterns of the skull geometry that were identified from the CT images were used to roughly align the skull with respect to the array as close as it was positioned in the simulations. However success of the numerical algorithm relies on precisely positioning the skull by constraining its three translational, three rotational degrees of freedom. Distance between the skull and transducer array (z- axis) is defined as 10 mm during the simulations, this value was maintained constant with a gauge block during positioning. Exact location of the skull section that was used in the simulations are known from CT images, based on this information skull was positioned in y- axis to align this section coincident with the imaging plane. Rotation of the skull about x- and y- axes were also measured from a set of CT images, these two rotation angles were also applied to the skull’s position. Lateral (x- axis) position of the skull ensured by capturing an ultrasound image of skull with the array and comparing it with the simulation section (Fig. 1). Finally, rotation of the skull around z- axis was manually controlled while other constrains were maintained. Hydrophone was used to scan a line of the focal plane and skull’s rotational position was iterated based on the measured pressure profile. Measurements were done in a water tank filled with deionized water. A schematic of the experimental setup is presented in Fig. 11.
Figure 11.
Schematic of the experimental setup.
A simulated focused field was created inside the skull and numerically back propagated to the array which was located 10 mm away from the skull, as described in Section 3. The back-propagated pressure signal was recorded at 128 different locations corresponding to the center of array elements. These signals were then time reversed to obtain the signals that needed to be transmitted from the array to create the focus inside the skull. Verasonics system can transmit tri-state pulses at a given voltage level (+V, 0, −V), these pulses are defined by their period, duty cycle and number of cycles. The resulting transmitted waveform is broadband and has higher order hormonics. The pulse-train can be individually defined for each transmit channel. Eventhough it is not possible to create the simulated signals of k-space propagation algorithm exactly, it is made sure that the phase of the transmitted signal is matching the phase of the simulated signal at the center frequency, 1 MHz. The phase of the transmitted signal is computed from the simulations and converted into a time delay for each channel. Also amplitude of an emitting channel cannot be changed during transmission, prohibiting any kind of amplitude modulation. Therefore each channel’s signal was set to a constant voltage, based on the maximum voltage it will emit. Once phase and amplitude for each channel was computed and applied, a pulse with 8-cycles at 1 MHz was emitted.
4.2. Results
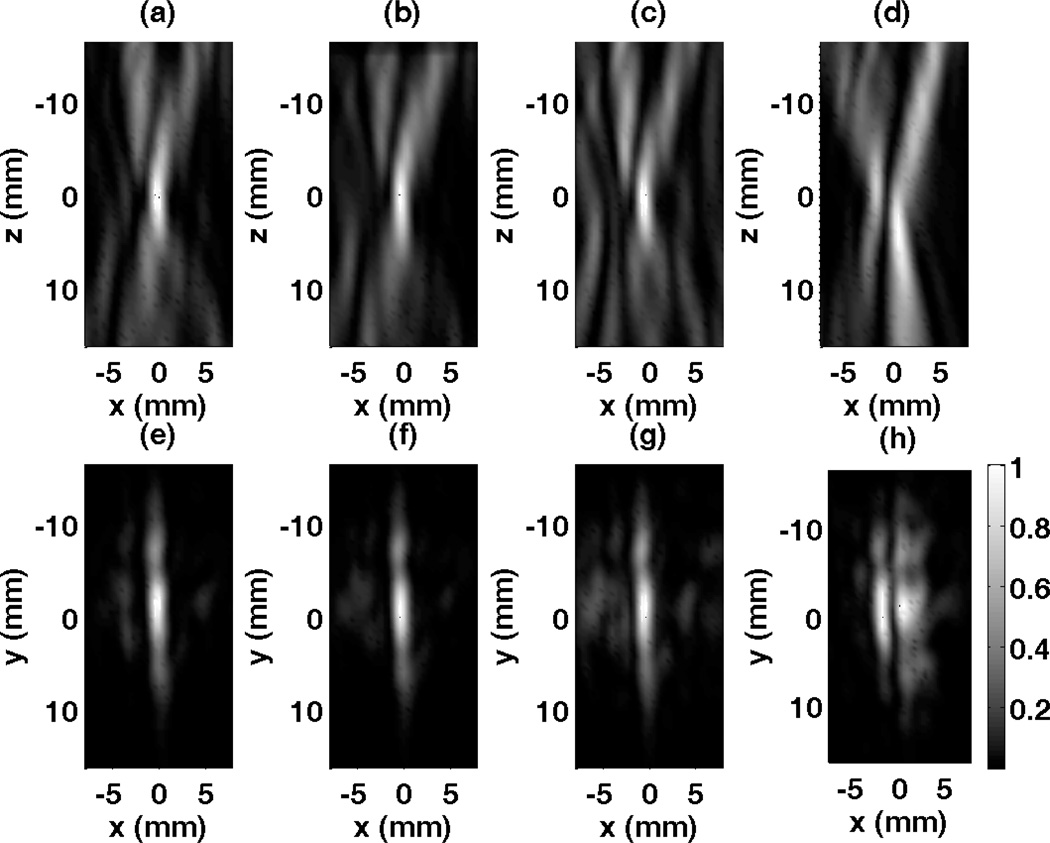
The array was driven with the numerically computed focusing pulse of 8 cycles at 1 MHz center frequency and the resulting acoustic field of a focused beam inside the skull was measured for the xz- (axial) and xy- (focal) planes. These two orthogonal planes have the area of 16 mm by 32 mm for both xz- and xz- with a 0.4 mm (< λ/4) scan step-size in all directions. Measured pressure data is squared and averaged in time to obtain a single pressure square value for each measurement point. Field measurements of the focused pulse based on the signals computed with a high spatial resolution k-space model, medium spatial resolution k-space model and low spatial resolution model are given in Figure 12, as well as field from signals computed without considering the skull. First row of results presented in Fig. 12 belong to xz- plane and k-space propagation models with three different levels of resolution successfully restore the focus at its desired location. In the plane of consideration the focus, instead of being a point, is an elongated strip in the axial direction due to the array geometry and specifications. Second row of results corresponds to the xy- plane pressure distribution results and recovered focus with three k-space propagation models can be seen. The relatively large height of the array elements (20 mm) results in a pressure distribution resembling a strip rather than a point at the focal plane.
Figure 12.
Normalized measurement results for the focused beam using various corrections methods. (a) Scan of the axial plane (x-z) using high resolution k-space method, (b) medium resolution k-space method, (c) low resolution k-space method, (d) without considering the skull. Focal plane (x-y) measurements using (e) high resolution k-space method, (f) medium resolution k-space method, (g) low resolution k-space method, (h) without considering the skull.
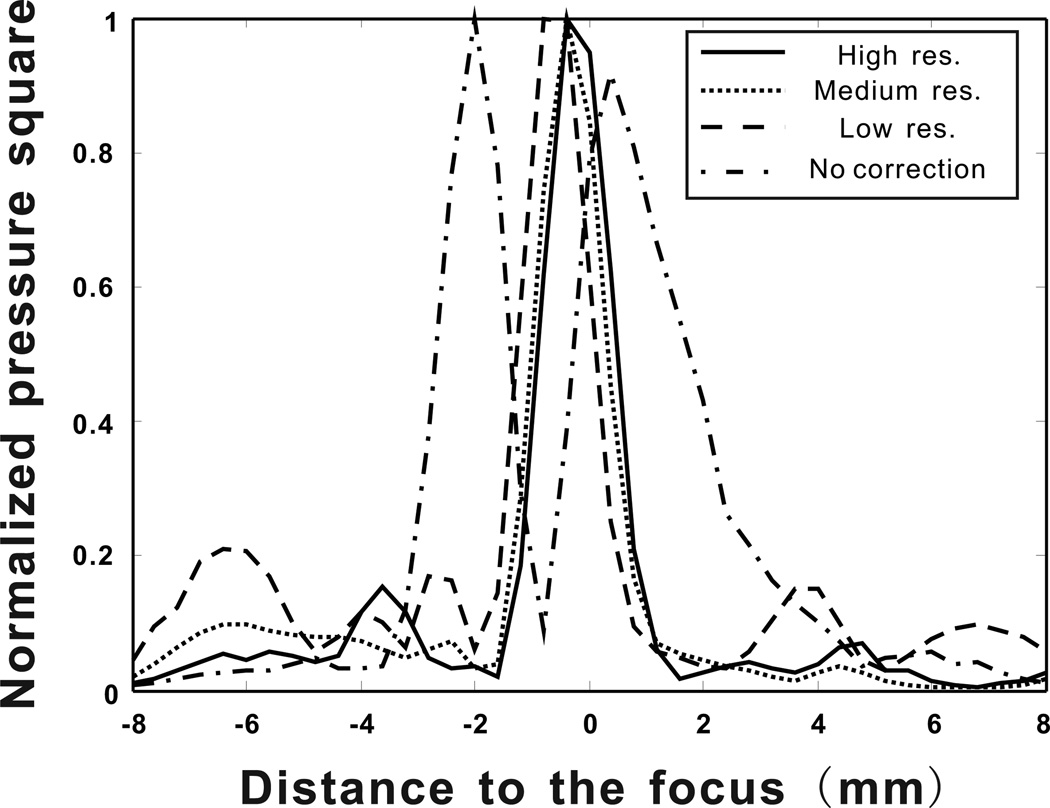
The precision of the correction algorithm was assessed by the shape of the focus as well as the side-lobe amplitudes (Aubry et al. 2003). Therefore results for pressure square distribution measurements along a line crossing the focal point are given in Fig. 13 for examining the shape of the different foci. Again, measurement results obtained using the signals computed with four different k-space propagation models are presented. For the high spatial resolution k-space algorithm, a focal spot with a full-width at half-maximum (FWHM) of 1.84 mm, in lateral direction, is obtained. The highest side lobe has an amplitude of −8.12 dB with respect to the main peak. For medium spatial resolution k-space algorithm, FWHM and side lobe amplitudes are measured as 1.86 mm and −10.03 dB respectively. Similarly, for the focal spot based on the low spatial resolution k-space propagation model, FWHM is 1.84 mm and the side lobe level is −6.76 dB. The position of focal spot shifts less than 0.4 mm, between high and low spatial resolution simulations. In the case where propagation through the skull is ignored in the k-space simulation a split focus is observed 2.4 mm apart from each other, second one having an amplitude of 92% of the first one. This situation could be disasterous in therapeutic applications such as ablation of brain tumors. For comparison a focused beam is created and back propagated in water, these signals are used to measure the ideal focus that can be obtain using the described technique and hardware. This ideal focus has a FWHM of 1.65 mm and side-lobe level at −12 dB. Even though results slightly vary, focusing signals computed with all three levels of resolution provides optimal focusing in the skull. Finally, the medium resolution is observed to have lower side lobes than the high resolution case. This may possibly result from the registration between the array and the skull. The registration was done manually, therefore inevitably introducing errors. If these errors canceled out errors manifested from using the medium spatial resolution, this might make the medium resolution case appear more accurate.
Figure 13.
Pressure square distribution measurements along a line crossing the focal point for four different scenarios (High resolution, medium resolution, low resolution k-space model and k-space propagation without the skull).
5. Conclusion
This paper investigated the feasibility of using a k-space method for transcranial beam focusing. Density data from CT images were used as the input to the numerical algorithm to simulate the wave propagation from a point source at the focal point. The received signal outside the skull was time reversed and sent back to the brain and create a sharp focus. Compared with the conventional FDTD method, which utilizes the finite difference to calculate the spatial derivative, the k-space method used the Fourier transform which resulted in a significantly reduced dispersion error even for a coarse spatial resolution.
A convergence study was first carried out for a quasi-plane wave propagation through the skull. Both k-space method and FDTD method were tested. It was found that for very fine spatial resolution (more than 10 grid points per wavelength), these two methods match very well. However, at a low spatial resolution, the k-space method was observed to produce considerably less numerical error. For this reason, we conclude that k-space method is a rapid and accurate alternative to the FDTD method for transcranial focusing. This numerical and experimental study found that, the k-space method implemented with a relatively low spatial resolution can still facilitate precise focusing inside the brain, without a significant loss of accuracy. This is advantageous, as a low spatial resolution indicates a short computation time. Indeed, the computation time at a fine spatial resolution (7.68 grid points per wavelength) can be reduced by a factor of around 80 if implemented at the lowest spatial resolution tested (2.56 grid points per wavelength).
In all current ongoing clinical trials the phase aberration correction is performed while the patient is inside the MRI, just prior to treatment (McDannold et al. 2010). In this case the MRI, CT and ultrasound reference frames are all co-registered. The significant time saved due to faster modeling could be highly beneficial from the standpoint of reduced patient stress as well as the time (and therefore cost) of an MR-guided procedure.
Acknowledgements
This work was supported by NIH Grant R01 EB0003268.
Contributor Information
Yun Jing, Email: yjing2@ncsu.edu, Department of Mechanical and Aerospace Engineering, North Carolina State University, Raleigh, NC 27695 USA.
F. Can Meral, Department of Radiology, Harvard Medical School, Brigham and Womens Hospital, 75 Francis St, Boston, MA 02115, USA.
Greg. T. Clement, Department of Radiology, Harvard Medical School, Brigham and Womens Hospital, 75 Francis St, Boston, MA 02115, USA
References
- Aubry JF, Tanter M, Pernot M, Thomas JL, Fink M. J. Acoust. Soc. Am. 2003;113:84–93. doi: 10.1121/1.1529663. [DOI] [PubMed] [Google Scholar]
- Behrens S, Spengos K, Daffertshofer M, Schroeck H, Dempfle CE, Hennerici M. Ultrasound in Medicine and Biology. 2001;27:1683–1689. doi: 10.1016/s0301-5629(01)00481-1. [DOI] [PubMed] [Google Scholar]
- Clement GT, Hynynen K. Ultrasound in Medicine and Biology. 2002a;28:617–624. doi: 10.1016/s0301-5629(02)00503-3. [DOI] [PubMed] [Google Scholar]
- Clement GT, Hynynen K. Phys. Med. Biol. 2002b;47:1219–1236. doi: 10.1088/0031-9155/47/8/301. [DOI] [PubMed] [Google Scholar]
- Clement GT, White PJ, Hynynen K. J. Acoust. Soc. Am. 2004;115:1356–1364. doi: 10.1121/1.1645610. [DOI] [PubMed] [Google Scholar]
- Cohen ZR, Zaubermann J, Harnof S, Mardor Y, Nass D, Zadicario E, Hananel A, Castel D, Faibel M, Ram Z. Neurosurgery. 2007;60:593–600. doi: 10.1227/01.NEU.0000245606.99946.C6. [DOI] [PubMed] [Google Scholar]
- Colen RR, Jolesz FA. Neuroimaging Clinics of North America. 2010;20(3):355–366. doi: 10.1016/j.nic.2010.05.003. [DOI] [PubMed] [Google Scholar]
- Cox B, Arridge SR, Beard PC. J. Acoust. Soc. Am. 2007;121:3453–3464. doi: 10.1121/1.2717409. [DOI] [PubMed] [Google Scholar]
- Damianou C, Ioannides K, Hadjisavvas V, Mylonas N, Couppis A, Iosif D. IEEE Transactions on Ultrasonics, Ferroelectrics, and Frequency Control. 2009;56:1189–1198. doi: 10.1109/TUFFC.2009.1160. [DOI] [PubMed] [Google Scholar]
- Fink M, Prada C. Inverse problems. 2001;17:R1–R38. [Google Scholar]
- Fry FJ. Ultrasound in Medicine and Biology. 1977;3:179–184. doi: 10.1016/0301-5629(77)90069-2. [DOI] [PubMed] [Google Scholar]
- Gateau J, Marsac L, Pernot M, Aubry JF, Tanter M, Fink M. IEEE Trans. Biomed. Eng. 2010;57:134–144. doi: 10.1109/TBME.2009.2031816. [DOI] [PMC free article] [PubMed] [Google Scholar]
- Hamilton MF, Blackstock DT. San Deigo, CA: Academic Press; 1998. [Google Scholar]
- Haworth KJ, Fowlkes JB, Carson PL, Kripfgans OD. Ultrasound in Medicine and Biology. 2008;34:435–445. doi: 10.1016/j.ultrasmedbio.2007.08.004. [DOI] [PMC free article] [PubMed] [Google Scholar]
- Hynynen K, McDannold N, Vykhodtseva N, Raymond S, Weissleder R, Jolesz FA, Sheikov N. J. Neurosurgery. 2006;105:445–454. doi: 10.3171/jns.2006.105.3.445. [DOI] [PubMed] [Google Scholar]
- Jolesz FA. Annual Review of Medicine. 2009;60:417–430. doi: 10.1146/annurev.med.60.041707.170303. [DOI] [PMC free article] [PubMed] [Google Scholar]
- Jolesz FA, Hynynen K, McDannold N, Tempany C. Magnetic Resonance Imaging Clinics of North America. 2005;13(3):545–560. doi: 10.1016/j.mric.2005.04.008. [DOI] [PubMed] [Google Scholar]
- Kinoshita M, McDannold N, Jolesz F, Hynynen K. Proc. Natl. Acad. Sci. 2006;103:11719–11723. doi: 10.1073/pnas.0604318103. [DOI] [PMC free article] [PubMed] [Google Scholar]
- Kosloff R, Kosloff D. J. Comp. Phys. 1986;63:363–376. [Google Scholar]
- Liu QH. IEEE Transactions on Ultrasonics, Ferroelectrics, and Frequency Control. 1998;45:1044–1055. doi: 10.1109/58.710587. [DOI] [PubMed] [Google Scholar]
- Marquet F, Pernot M, Aubry JF, Montaldo G, Marsac L, Tanter M, Fink M. Physics in Medicine and Biology. 2009;54:2597–2613. doi: 10.1088/0031-9155/54/9/001. [DOI] [PubMed] [Google Scholar]
- Martin E, Jeanmonod D, Morel A, Zadicario E, Werner B. Ann. Neurol. 2009;66:858–861. doi: 10.1002/ana.21801. [DOI] [PubMed] [Google Scholar]
- Mast TD. Acoustics Research Letters Online. 2002;3:53–58. [Google Scholar]
- Mast T, Souriau L, Liu D, Tabei M, Nachman A, Waag RC. IEEE Transactions on Ultrasonics, Ferroelectrics, and Frequency Control. 2001;48:341–354. doi: 10.1109/58.911717. [DOI] [PubMed] [Google Scholar]
- McDannold N, Clement GT, Black PM, Jolesz FA, Hynynen K. Neurosurgery. 2010;66:323–332. doi: 10.1227/01.NEU.0000360379.95800.2F. [DOI] [PMC free article] [PubMed] [Google Scholar]
- Meral FC, Clement GT. IEEE Symposium on Ultrasonics; 2010. pp. 1984–1987. [Google Scholar]
- Pernot M, Aubry JF, Tanter M, Boch AL, Marquet F, Kujas M, Seilhean D, Fink M. J. Neurosurg. 2007;106:1061–1066. doi: 10.3171/jns.2007.106.6.1061. [DOI] [PubMed] [Google Scholar]
- Pichardo S, Sin VW, Hynynen K. Phys. Med. Biol. 2011;56:219–250. doi: 10.1088/0031-9155/56/1/014. [DOI] [PMC free article] [PubMed] [Google Scholar]
- Tabei M, Mast TD, Waag RC. J. Acoust. Soc. Am. 2002;111:53–63. doi: 10.1121/1.1421344. [DOI] [PubMed] [Google Scholar]
- Thomas JL, Fink M. IEEE Transactions on Ultrasonics, Ferroelectrics, and Frequency Control. 1996;43:1122–1129. doi: 10.1109/58.156175. [DOI] [PubMed] [Google Scholar]
- Tillet JC, Daoud MI, Lacefield JC, Waag RC. J. Acoust. Soc. Am. 2009;126:1231–1244. doi: 10.1121/1.3158857. [DOI] [PMC free article] [PubMed] [Google Scholar]
- Treebya BE, Cox BT. J. Acoust. Soc. Am. 2010;127:2741–2748. doi: 10.1121/1.3377056. [DOI] [PubMed] [Google Scholar]


