

Abstract
Background
Deficiency of micronutrients is common in refugee populations.
Objectives
Identify deficiencies and whether provided supplements and wheat flour fortified with 10 micronutrients impacts upon status among breast-feeding women from Maela refugee camp.
Methods
Two sequential cross-sectional studies were conducted in different groups of lactating mothers at 12 weeks postpartum. The first survey was before and the second 4–5 months after micronutrient fortified flour (MFF) had been provided to the camp (in addition to the regular food basket). Iron status and micronutrients were measured in serum, whole blood, and in breast milk samples.
Results
Iron and zinc deficiency and anemia were highly prevalent while low serum retinol and thiamine deficiency were rarely detected. Iron and zinc deficiency were associated with anemia, and their proportions were significantly lower after the introduction of MFF (21 vs. 35% with soluble transferrin receptor (sTfR) >8.5 mg/L, P = 0.042, and 50 vs. 73% with serum zinc <0.66 mg/L, P = 0.001). Serum sTfR, whole-blood thiamine diphosphate (TDP) and serum β-carotene were significant predictors (P < 0.001) of milk iron, thiamine and β-carotene, respectively. Lower prevalence of iron deficiency in the MFF group was associated with significantly higher iron and thiamine in breast milk.
Conclusions
High whole-blood TDP and breast milk thiamine reflected good compliance to provided thiamine; high prevalence of iron deficiency suggested insufficient dietary iron and low acceptance to ferrous sulfate supplements. MFF as an additional food ration in Maela refugee camp seemed to have an effect in reducing both iron and zinc deficiency postpartum.
Keywords: Micronutrients, Lactation, Refugee, Iron, Zinc, Anemia
Introduction
Deficiency of iron and micronutrients affects people in nearly all developing countries and is highly prevalent in long-term refugees and internally displaced populations [1–3]. Since 1984, 1,000s of displaced people mainly of Karen ethnic origin, from neighboring Myanmar, have taken refuge in Thailand. Maela camp, located in Mae Ramat district, Tak province, Northern Thailand, is the largest settlement with up to 50,000 inhabitants [4]. This is the 2nd most protracted refugee situation, after Afghanistan, in Asia. In 1988, thiamine deficiency was recognized as a major cause of infantile mortality, which could be reduced considerably with supplementary food rations and thiamine supplements for those women with clinical signs of beriberi [5]. Iron and micronutrient deficiency remains prevalent as nutrition relies mainly on the provided food basket consisting of rice, split mung beans, fermented fish, iodized salt, soybean oil and dried chilies [6, 7]. Deficiency of thiamine and vitamin A as well as a high prevalence of anemia has been documented in pregnant and postpartum women in this population [8–10]. Pregnant and lactating women are provided with additional food rations (split mung beans, dried fish) and micronutrient supplements (iron, folate and thiamine) by the Thai Burma Border Consortium (TBBC) and the Shoklo Malaria Research Unit (SMRU), respectively. In July 2004, whole wheat flour fortified with 10 micronutrients (MFF) was introduced by the TBBC as a monthly supplement to the standard food basket. The purpose of the study was to (1) confirm that lactating women are deficient in micronutrients in this population, (2) identify predictors of micronutrient concentrations in blood and breast milk and (3) assess whether wheat flour fortified with 10 micronutrients impacts upon micronutrient status.
Methods
Study design and sample size
The present study was conducted at the antenatal clinics of SMRU in Maela camp, 50 km north of Mae Sot at the Thai Myanmar Border, and was part of a larger project to evaluate the impact of food ration distribution and provided supplements among pregnant and postpartum women. It was approved by the Faculty of Tropical Medicine of Mahidol University (TM-IRB 04/2004), and the Oxford Tropical Research Ethics Committee, University of Oxford (OXTREC 009-04). The two cross-sectional surveys among breast-feeding women were sequential and exhaustive within Maela camp and occurred before and after introduction of MFF. The first group was enrolled between June 1, 2004, and July 5, 2004, before MFF was introduced into the camp (PreMFFw). Eligibility for the first survey included breast-feeding women in week 12 postpartum who delivered term, normal, singleton infants. These women were provided with the general and supplementary food ration and micronutrient supplements, and gave written informed consent (n = 86). Four mothers refused to participate to the survey, one baby was bottle-fed and the remaining 24 families either moved out of the camp (n = 9) or could not be found at their designated address (n = 15). The second survey included 99 women who delivered after the introduction of MFF according to the criteria of the first cohort. The sampling of these women (MFFw) took place from October to November 2004 (Fig. 1).
Fig. 1.
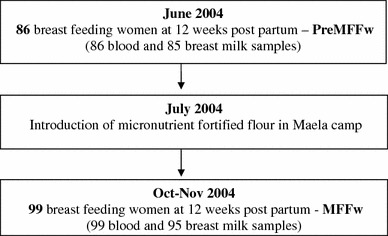
Participant flow chart
Food rations and supplements
In 2004, the general monthly food ration for adults in the Thai-Burmese border refugee camps included: 16 kg rice, 1.5 kg split mung beans, 1 kg fermented fish paste, 300 g iodized salt (50 mg iodine/kg), 1 L soybean oil and 125 g of dried chillies. Pregnant and lactating women were provided with weekly supplementary food rations of 500 g split mung beans and 300 and 200 g of dried fish, respectively. Supplements that were provided weekly during pregnancy included iron (7 × 600 mg iron sulfate), folic acid (7 × 5 mg) and thiamine (7 × 100 mg thiamine mononitrate). At delivery, all women received systematically vitamin A (200,000 IU) in the form of retinyl palmitate and thiamine (7 × 100 mg/week) was still provided for postpartum women. In July 2004, an additional monthly food ration for adults of 1.4 kg of micronutrient fortified wheat flour (MFF) consisting of 75% whole wheat, 25% soy bean flour and a premix of basic vitamins and minerals (Table 1) was introduced in Maela camp; there was a concomitant reduction of 500 g in the monthly ration of split mung beans and 1 kg reduction in rice. An estimation of daily intakes of micronutrients by the monthly provided food basket (15 kg polished rice, 1 kg split mung beans, 1 kg fermented fish paste, 1 L of soy bean oil), supplementary food rations for postpartum women (weekly 500 g split mung beans and 200 g dried fish), introduced MFF (1.4 kg/month) as well as of provided micronutrient supplements (iron, folic acid and thiamine in pregnancy and thiamine in postpartum) in comparison with FAO/WHO recommendations is given in Table 1.
Table 1.
Estimated daily intake of micronutrients by provided food basket, food supplements, MFF and supplements in comparison with FAO/WHO recommendation
| Micronutrient | Food basket | Food suppl. | MFFa | RDIb |
|---|---|---|---|---|
| Vitamin A, μg REc (%) | 121 (14) | 14.6 (2) | 235 (38) | 850 |
| α-TEsd, mg (%) | 5.6 (75) | 0.47 (6) | – | 7.5 |
| Thiamine, mg (%) | 0.26 (17) | 0.44 (29) | 0.34 (23) | 1.5 |
| Riboflavin, mg (%) | 0.22 (14) | 0.35 (22) | 0.30 (19) | 1.6 |
| Nicotinamide, mg (%) | 1.8 (11) | 3.8 (22) | 4.2 (25) | 17 |
| Folic acid, μg (%) | 186 (37) | 377 (75) | 68 (14) | 500 |
| Ascorbic acid, mg (%) | 3.4 (5) | 7.5 (11) | 22.4 (32) | 70 |
| Cobalamin, μg (%) | 1.7 (61) | 4.9 (175) | 0.56 (20) | 2.8 |
| Zinc, mg (%) | 1.7 (18) | 2.5 (26) | 2.7 (28) | 9.5 |
| Iron, mg (%) | 4.3 (36) | 4.9 (41) | 4.5 (38) | 12 |
| Calcium, mg (%) | 275 (28) | 209 (21) | 51 (5) | 1,000 |
| Supplements in pregnancy | RDI pregnancy | |
|---|---|---|
| Iron, mg (%) | 221 (221) | 100 |
| Folic acid, mg (%) | 5 (800) | 0.60 |
| Thiamine, mg (%) | 92 (6,600) | 1.40 |
| Supplements in postpartum | RDI postpartum | |
|---|---|---|
| Thiamine, mg (%) | 92 (6,100) | 1.50 |
Micronutrients are given in micro- or milligram, and their contributions as percentage of RDI are shown in brackets. Food values were taken from the Thai Food composition database (Institute of Nutrition, Mahidol University, 2001), USDA National Nutrient Database for Standard Reference, Release 23 (2010, http://www.nal.usda.gov/fnic/foodcomp/search/) and Souci, Fachmann, Kraut [46]. Monthly food basket contained 15 kg (polished) rice, 1 kg mung beans, 1 kg fermented fish, 1 L soybean oil and 125 g of dried chilies. Supplemental weekly food ration contained 500 g split mung beans and 200 g dried fish. Daily provided micronutrient supplements during pregnancy consisted of 600 g ferrous sulfate (221 g elemental iron), 5 mg folic acid and 100 mg thiamine mononitrate (92 mg thiamine). Daily provided thiamine in postpartum consisted of 100 mg thiamine mononitrate
aMicronutrients in the premix were based on the recommendation by World Food Programme; final values in MFF include concentrations given for wheat flour (Type 1700) and soya flour (full fat) [46]
bFAO/WHO recommended daily intakes (RDI), 0–3 months lactation [43]
c RE Retinol equivalents (1 RE = 1 μg retinol or 12 μg beta-carotene)
d α-TEs α-Tocopherol Equivalents (1 mg α-TE = 1 mg d-α-tocopherol or 2 mg d-β-tocopherol or 10 mg d-γ-tocopherol or 33.3 mg d-δ-tocopherol or 3.3 mg d-α-tocotrienol)
Blood and breast milk sample collection
Capillary blood was taken for hematocrit and measured on site in Maela camp. Non-fasting blood samples including EDTA-whole blood and whole blood for serum were collected between 10.00 am and 12.00 pm by venepuncture into trace element-free vacutainers that were wrapped in aluminum foil. Breast milk samples were collected by manual expression into glass tubes (Pyrex), again wrapped in aluminum foil in order to protect against degradation of photosensitive substances (vitamins and carotenoids) by direct sunlight. Whole blood, serum and breast milk were portioned into Eppendorf tubes and frozen at −20 °C in Maela camp before being transported to the SMRU office in Mae Sot to be stored at −80 °C. Samples were sent (on dry ice) to the University of Hohenheim, Stuttgart (Biological Chemistry and Nutrition) for analysis of micronutrients; aliquots of serum were transferred to DBS-Tech, Willstaett for determination of iron status parameter and acute phase proteins.
Laboratory investigations
Ferritin, soluble transferrin receptor, C-reactive protein and α-1 glycoprotein
Serum ferritin (SF) and soluble transferrin receptor (sTfR), as indicators for iron status, and the acute phase proteins C-reactive protein (CRP) and α-1 glycoprotein (AGP) were measured by ELISA using polyclonal (DAKO, Finland: SF, CRP, AGP) and monoclonal (Hytest, Finland: sTfR) antibodies [11]. Serum quality material (Liquicheck, BIORAD) was used for quantification, and all assays were done in duplicate. Serum pools measured as a quality control (n = 8/96-well plate) gave between-assay coefficients for SF, sTfR, CRP and AGP of ≤4%. Iron deficiency was defined by SF <12 μg/L or sTfR >8.5 mg/L [12]. Hemoglobin was estimated by hematocrit values, and anemia was defined as hemoglobin <120 g/L [13]. Concentrations of CRP >5 μg/L and AGP >1 g/L indicated an acute phase response by infection or inflammation [14]. Parameters such as serum ferritin or retinol known to be affected by infection were not corrected. Instead, elevated CRP (>5 μg/L) and AGP (>1 g/L) were used as independent factors in multivariate regression analysis. Further significant differences in blood parameters between the groups (PreMFFw vs. MFFw) were reassessed after exclusion of those women with elevated CRP and/or AGP.
Iron, zinc and copper
Iron in breast milk was analyzed by inductively coupled plasma optical emission spectrometry (ICP-OES) after microwave-heated digestion. Samples of 1 mL were mineralized with concentrated nitric acid for 2 h in a closed-pressurized high performance microwave digestion unit (Milestone Ultra Clave II), diluted with high-purity water and analyzed on a Varian Vista Pro Radial. All glass and plastic tubes were soaked in 1% EDTA solution, washed with distilled water, then soaked in 5% nitric acid and finally rinsed with ultrapure water (18 mΩ) before being used for the analysis on iron and trace elements. Pooled samples (n = 20) analyzed on iron along the 180 breast milk samples gave a CV of 6.0%.
Zinc and copper in serum and breast milk were analyzed by inductively coupled plasma mass spectrometry (ICP-MS). Serum samples (0.1 mL) spiked with internal standard (10 μg/L Rhodium (III) chloride, Merck, Darmstadt) were diluted with de-ionized water and analyzed by ICP-MS (Elan 6000, Perkin Elmer Sciex). Calibration with ICP multi-element standard solution VI (CertiPur, Merck, Darmstadt) was done on each day of analysis. Human control sera (Seronorm Trace Elements, SERO AS, Norway) analyzed for zinc agreed well (0.939 ± 0.054, n = 5) with the certified value (0.94 mg/L). For internal quality control, pooled serum was analyzed within each batch (n = 20) of samples giving inter-batch CV’s for zinc and copper of 5.3 and 4.1%, respectively. Serum zinc <0.66 mg/L was used to indicate zinc deficiency among non-pregnant women [15]. Zinc and copper in breast milk (0.5 mL) were analyzed using internal standard (Rh) and 5% (v:v) tertiary amines-EDTA reagent (CFA-C Reagent, Spectrasol, Warwick, NY) as described by Nobrega [16]. Pooled milk (n = 25) analyzed along the 180 specimens gave CV’s of 3.6% for zinc and of 5.2% for copper.
Retinol, α-tocopherol and β-carotene
Retinol, α-tocopherol and β-carotene in serum and breast milk were determined by HPLC. Serum samples of 40 μL were extracted (vortex mixed) with 200 μL ethanol–butanol (50:50 vol/vol) containing tocol as internal standard; after centrifugation, supernatants were analyzed using reverse phase HPLC and UV–VIS detection as previously described [10]. Pooled serum analyzed within each batch (n = 12) of samples gave inter-batch CVs for the respective vitamins of <6%. Breast milk samples of 0.5 mL were saponified, extracted with hexane, evaporated and finally dissolved in ethanol-acetonitrile (25:75 vol/vol) for HPLC analysis as recently described [17]. Retinol and β-carotene were detected by UV–VIS (at 325 and 450 nm, respectively) while α-tocopherol was measured by fluorescence (Ex/Em at 298/328 nm). For calibration, three different serum pools with assigned values set against Standard Reference Material (SRM 968c, NIST, Gaithersburg, MD) and confirmed by pure standards were treated according to milk samples. Pooled breast milk samples (n = 19) analyzed within each batch (n = 10) gave inter-batch CVs for retinol, β-carotene and α-tocopherol of <9%. Serum retinol <1.05 μmol/L and breast milk retinol ≤1.05 μmol/L or ≤28 μmol/kg milk fat (≤8 μg/g milk fat) were considered indicative of low vitamin A status and low breast milk vitamin A content [18].
Cholesterol and triglycerides
Serum cholesterol and triglycerides were analyzed by enzymatic methods using diagnostic kits (ABX, Esslingen) adapted for the Cobas Mira auto analyzer. The methods described by Lucas et al. [19] were used to determine milk fat triglycerides. Pooled serum and milk analyzed along with each batch of samples gave between-assay CVs for serum cholesterol, serum triglycerides and milk triglycerides of 2.1, 7.6 and 4.8%, respectively.
Thiamine
Thiamine and its phosphate esters in 0.5 mL of whole blood or breast milk were analyzed using precolumn derivatization, reversed-phase liquid chromatography and fluorescence detection [20]. The separation of thiamine and its phosphate esters thiamine monophosphate (TMP) and thiamine diphosphate (TDP) was achieved using a 5 μm analytical column (Grom-Sil 120 ODS-4 HE, 125 × 4 mm, Grom, Germany) and a mobile phase consisting methanol [17.5% (v:v) for whole blood and 27.5% (v:v) for milk] and phosphate buffer (pH 7) at a flow rate of 0.8 mL/min. External calibration curves from TDP, TMP and thiamine hydrochloride standards (Sigma Chemicals) were used for quantification. For internal quality control, pools of whole blood and milk were analyzed within each batch (n = 12) of samples giving inter-batch CV’s for whole blood TDP of <7% and for TMP and thiamine in milk of <5%. Whole blood TDP <35 μg/L (<75 nM), adapted to lowest total thiamine and whole blood TDP reported for Europe and Japan [21, 22], and TDP <50 μg/L, the 20th percentile of TDP levels in the present study, were considered as cutoff values for deficient and low thiamine status, respectively. Breast milk thiamine <100 μg/L was considered indicative of thiamine deficiency [23].
Statistical analysis
All statistical analysis was carried out using SPSS software (SPSS Inc., Chicago, IL; Version 11.5). Characteristics of the study population were described by the mean (SD) and median [range], as appropriate. Percentages were given for categorical and binary data. Data on biochemical measurements that were not normally distributed were log or square root transformed, as needed and described using geometric means (95% CI). The Student’s t test was used to compare iron and micronutrient status between postpartum women who were provided with the micronutrient fortified flour (MFFw) and those who were not (PreMFFw). The chi-squared test was used to compare the prevalence of deficiencies. Independent predictors of blood and milk micronutrients and respective deficiencies were identified using linear and logistic regression. A forward stepwise approach was used and only variables with P values <0.05 were retained in the final models. The following covariates were included in the initial models: maternal age, height and weight, parity, smoking status, constant consumption (2–3 times/day) of fish paste, years of living in the camp and in Thailand, mother’s religion (Christian, Buddhist or Muslim), weeks of individual supplements provided at the time of blood draw, acute phase proteins (AGP >1 g/L, CRP >5 mg/L), hemoglobin, anemia and blood micronutrients. The fit of each linear regression model was checked by visual inspection of the residuals. Appropriate fit of logistic regression models was confirmed using the Hosmer–Lemeshow goodness-of-fit test after grouping the data by predicted probabilities of deficiency into ten approximately equal-sized groups (Stata Base Reference Manual (K–Q), Release 9. 2005. Texas: StataCorp LP).
Results
Maternal characteristics of women at 12 weeks postpartum in the PreMFFw and MFFw groups did not differ significantly (Table 2). Iron and zinc deficiency and anemia were highly prevalent (≥21, ≥50 and ≥34%, respectively) while low serum retinol and thiamine deficiency were rarely detected (Table 3). Women in the MFFw group had a more reassuring iron and micronutrient profile than the PreMFFw. The MFFw had a mean concentration of sTfR that was significantly lower and serum zinc that was significantly higher than the PreMFFw; this was also reflected in a significantly lower proportion of women with iron (sTfR >8.5 mg/L) and zinc deficiency (<0.66 mg/L). Serum retinol, α-tocopherol and cholesterol as well as mean TDP were slightly higher, and the proportion of women with thiamine deficiency (TDP <35 μg/L) was significantly lower in MFFw compared to preMFFw group.
Table 2.
Characteristics of both study populations at 12 weeks postpartum (all P > 0.05)
| Characteristics | PreMFFw (n = 86) | MFFw (n = 99) |
|---|---|---|
| Age (years) | 27 (16–41) | 27 (17–46) |
| Parity (n) | 3 (1–9) | 3 (1–10) |
| BMI (kg/m2) | 21.1 ± 2.7 | 21.9 ± 2.7 |
| <18.5 [% (n)] | 7 (6) | 5 (5) |
| ≥23.0 [% (n)] | 27 (24) | 35 (35) |
| in Maela (years) | 7 (1–18) | 8 (1–16) |
| in Thailand (years) | 10 (1–30) | 11 (1–36) |
| Smokers [% (n)] | 29 (25) | 32 (32) |
| Buddhist [% (n)] | 42 (36) | 38 (38) |
| Christian [% (n)] | 44 (38) | 44 (44) |
| Muslim [% (n)] | 13 (11) | 17 (17) |
| Fish pastea [% (n)] | 62 (53) | 62 (61) |
| FFAb (weeks) | 29 (1–34) | 29 (8–37) |
| B1c (weeks) | 41 (13–46) | 41 (20–49) |
Values are median (range), mean ± SD or percentage (n)
aFermented fish paste consumed as a dip with each meal: 2–3 times/day
bFFA, weeks of provided ferrous sulfate (7 × 600 mg) and folic acid (7 × 5 mg) in pregnancy
cB1, weeks of provided thiamine mono-nitrate (7 × 100 mg) in pregnancy and postpartum
Table 3.
Iron status, serum micronutrients and whole-blood thiamine diphosphate (TDP) of lactating women prior to (PreMFFw) and after (MFFw) the introduction of micronutrient fortified flour (MFF)
| Serum | PreMFFw (n = 86) | MFFw (n = 98) | P value |
|---|---|---|---|
| sTfRa (mg/L) | 8.06 (7.60–8.54) | 7.27 (6.86–7.70) | 0.014 |
| >8.5 mg/l [% (n)] | 35 (30) | 21 (21) | 0.042 |
| Ferritin (μg/L) | 41.8 (33.6–50.5) | 38.2 (31.7–46.2) | 0.53 |
| <12 μg/L [% (n)] | 13 (11) | 16 (16) | 0.50 |
| AGP > 1 g/L [% (n)] | 17 (15) | 14 (14) | 0.81 |
| CRP > 5 mg/L [% (n)] | 7 (6) | 6 (6) | 0.56 |
| Zinc (mg/L) | 0.604 (0.58–0.63) | 0.646 (0.62–0.68) | 0.046 |
| <0.66 mg/L [% (n)] | 73 (63) | 50 (49) | 0.001 |
| Copper (mg/L) | 1.18 (1.13–1.22) | 1.16 (1.13–1.20) | 0.63 |
| Cholesterol (mmol/L) | 4.65 ± 0.91 | 4.82 ± 0.99 | 0.21 |
| Triglycerides (mmol/L) | 0.99 (0.92–1.10) | 1.01 (0.92–1.11) | 0.74 |
| Retinol (μmol/L) | 1.59 ± 0.40 | 1.69 ± 0.47 | 0.10 |
| <1.05 μmol/L [% (n)] | 6 (5) | 6 (6) | 0.93 |
| α-Tocopherol (μmol/L) | 13.1 (12.4–13.9) | 14.1 (13.3–14.9) | 0.10 |
| β-Carotene (μmol/L) | 0.176 (0.15–0.21) | 0.166 (0.15–0.19) | 0.58 |
| α-Tocopherol/cholesterol (μmol/L/mmol/L) | 2.88 ± 0.54 | 2.98 ± 0.63 | 0.25 |
| Whole blood | (n = 86) | (n = 99) | |
|---|---|---|---|
| Hemoglobinb (g/L) | 124.5 ± 11.0 | 124.4 ± 9.5 | 0.92 |
| <120 g/L [% (n)] | 37 (31) | 34 (32) | 0.68 |
| TDP (μg/L) | 67.4 ± 21.9 | 69.0 ± 17.7 | 0.57 |
| <35 μg/L [% (n)] | 8 (7) | 1 (1) | 0.017 |
| TDP/Hbb (ng/g) | 545 ± 179 | 554 ± 137 | 0.67 |
Values are mean ± SD, geometric mean (95% CI) or percentage (n)
a sTfR Soluble transferrin receptor
b n = 83 in PreMFFw and n = 96 in MFFw; TDP/Hb thiamine diphosphate per hemoglobin
Blood samples with elevated acute phase proteins (n = 31 with AGP >1 g/L and/or CRP >5 mg/L) were associated with significantly higher mean serum ferritin (66.6 vs. 35.4 μg/L) and copper (1.36 vs. 1.13 mg/L) but significantly lower mean serum retinol (1.43 vs. 1.68 μmol/L) and β-carotene (0.113 vs. 0.185 μmol/L). After exclusion of those women with elevated AGP and/or CRP, the lower prevalence of iron deficiency in the MFFw was even more distinct (19 vs. 38% sTfR >8.5 mg/L, P = 0.014) and the lower prevalence of zinc deficiency than in PreMFFw (45 vs. 55% with serum zinc <0.66 mg/L, P = 0.004) still persisted.
The positive impact on iron and zinc status in the MFFw group remained significant after adjustment for significant covariates (Table 4). Low TDP increased the risk of both high sTfR (>8.5 mg/L) and low serum ferritin (<12 mg/L). Smoking and low serum retinol indicated risk of high sTfR and low serum ferritin, respectively. Anemia was associated with iron and zinc deficiency and was predicted by infection (AGP >1 g/L).
Table 4.
Risk factors for iron deficiency (sTfR >8.5 mg/L, ferritin <12 μg/L), zinc deficiency (zinc <0.66 mg/L), anemia (hemoglobin <120 g/L) and low whole-blood TDP (<50 μg/L) in postpartum, by outcome
| Blood parameter | Odds ratio | 95% CI | P value |
|---|---|---|---|
| sTfR >8.5 mg/La | |||
| TDP <50 μg/L | 2.38 | 1.02, 5.56 | 0.044 |
| Age (years) | 0.90 | 0.84, 0.96 | 0.002 |
| Smoking (=1) | 3.35 | 1.39, 8.10 | 0.007 |
| Hb <120 g/L | 2.26 | 1.09, 4.71 | 0.029 |
| MFFw (=1) | 0.46 | 0.22, 0.95 | 0.037 |
| Ferritin <12 μg/Lb | |||
| TDP <50 μg/L | 5.03 | 1.87, 13.4 | 0.001 |
| Retinol <1.05 μmol/L | 7.03 | 1.22, 40.5 | 0.029 |
| Hb <120 g/L | 2.72 | 1.10, 6.73 | 0.030 |
| Zinc <0.66 mg/Lc | |||
| MFFw (=1) | 0.34 | 0.18, 0.65 | 0.001 |
| Hb <120 g/L | 3.17 | 1.56, 6.42 | 0.001 |
| Hemoglobin <120 g/Ld | |||
| Zinc <0.66 mg/L | 3.58 | 1.73, 7.41 | 0.001 |
| Ferritin <12 μg/L | 3.43 | 1.39, 8.42 | 0.007 |
| AGP >1 g/L | 3.03 | 1.25, 7.38 | 0.014 |
| TDP <50 μg/Le | |||
| Ferritin <12 μg/L | 4.49 | 1.77, 11.4 | 0.002 |
| In Maela (years) | 1.16 | 1.02, 1.32 | 0.020 |
| Christian (=1) | 0.39 | 0.16, 0.94 | 0.035 |
Risk factors are listed in the order they were entered in the (forward) models
asTfR (soluble transferrin receptor) >8.5 mg/L, n = 48/178 (27%)
bSerum ferritin <12 μgL, n = 27/148 (18%), women with AGP >1 g/L and/or CRP >5 mg/L were excluded
cSerum zinc <0.66 mg/L, n = 108/178 (61%)
dHemoglobin <120 g/L (anemia), n = 64/178 (36%)
eTDP <50 μg/L, n = 33/178 (19%)
Iron and thiamine in breast milk were significantly higher in the MFFw group (Table 5). Improvement of tissue iron in the MFFw group (lower sTfR) was associated with a significantly higher milk iron (per volume and per milk fat) than in the PreMFFw group. The prevalence of deficient total thiamine in breast milk (<100 μg/L) was low and significantly lower after the introduction of MFF. Women in the MFFw group had a higher prevalence of fat adjusted low retinol and a lower mean milk β-carotene than women in PreMFF group. α-Tocopherol, retinol and β-carotene but also iron and zinc in breast milk were strongly influenced by the concentration of milk fat (R 2 = 43, 33, 21, 21 and 8%, respectively), and all micronutrients except zinc were significantly correlated to respective biomarkers in blood (Table 6). Zinc in breast milk was high despite low serum zinc and affected by the daily consumption of fish paste. Whole-blood TDP adjusted for hemoglobin explained 24 and 26% of the variance (R 2) in thiamine and total thiamine (thiamine + TMP) in breast milk.
Table 5.
Iron, zinc, fat soluble vitamins and thiamine in breast milk of lactating refugee women at 3 months postpartum
| Breast milk | preMFFw (n = 85) | MFFw (n = 95) | P value |
|---|---|---|---|
| Iron (mg/L) | 0.242 (0.218–0.268) | 0.288 (0.253–0.329) | 0.038 |
| Milk fat (g/L) | 24.4 ± 10.4 | 23.8 ± 9.5 | 0.69 |
| Iron/milk fat (mg/kg) | 10.8 (10.1–11.8) | 13.2 (11.7–14.9) | 0.009 |
| Zinc (mg/L) | 1.78 (1.62–1.94) | 1.79 (1.64–1.94) | 0.92 |
| Zinc/milk fat (mg/kg) | 76.2 (68.2–85.0) | 78.3 (70.1–87.5) | 0.72 |
| Copper (mg/L) | 0.278 ± 0.075 | 0.280 ± 0.066 | 0.83 |
| Copper/milk fat (mg/kg) | 11.9 (10.7–13.3) | 12.4 (11.3–13.6) | 0.57 |
| Retinol (μmol/L) | 1.09 (0.98–1.19) | 1.01 (0.90–1.12) | 0.32 |
| ≤1.05 μmol/L [% (n)] | 52 (44) | 53 (50) | 0.91 |
| Retinol/milk fat (μmol/kg) | 46.2 (43.1–49.4) | 43.2 (39.4–47.4) | 0.26 |
| ≤28 μmol/kg [% (n)] | 5 (4) | 16 (15) | 0.016 |
| α-Tocopherol (μmol/L) | 3.68 (3.30–4.07) | 3.51 (3.16–3.87) | 0.52 |
| α-Tocopherol/fat (μmol/kg) | 154.9 (142.7–168.2) | 150.7 (139.7–162.6) | 0.63 |
| β-Carotenea (μmol/L) | 0.014 (0.012–0.016) | 0.010 (0.008–0.011) | 0.001 |
| β-Carotene/fata (μmol/kg) | 0.587 (0.497–0.694) | 0.427 (0.380–0.481) | 0.002 |
| Thiamine (μg/L) | 100.6 (81.7–118.1) | 129.4 (114.9–144.8) | 0.026 |
| TMPb (μg/L) | 178.1 ± 68.4 | 176.8 ± 49.5 | 0.34 |
| Total thiamineb (μg/L) | 265.6 ± 129.9 | 290.8 ± 83.5 | 0.13 |
| <100 μg/L [% (n)] | 8 (7) | 1 (1) | 0.020 |
Figures are mean ± SD, geometric mean (95% CI) or percentage (n)
a n = 77 for PreMFFw, and n = 82 for MFFw
b TMP thiamine monophosphate; Total thiamine, sum of thiamine and TMP
Table 6.
Multivariate linear regression analysis on micronutrients in breast milk
| Breast milk, N = 179 | β Coefficient | 95% CI | P value | R 2 change |
|---|---|---|---|---|
| Iron (ln mg/L) | ||||
| Milk fat (g/L) | 0.028 | 0.021, 0.035 | <0.001 | 0.214 |
| sTfR (ln mg/L) | −0.590 | −0.845, −0.334 | <0.001 | 0.086 |
| Zinc (√ mg/L) | ||||
| Milk fat (g/L) | 0.007 | 0.003, 0.011 | <0.001 | 0.076 |
| Age (years) | −0.009 | −0.015, −0.004 | 0.002 | 0.041 |
| Fish paste (=1) | 0.099 | 0.021, 0.177 | 0.014 | 0.030 |
| Retinol (√μM) | ||||
| Milk fat (g/L) | 0.016 | 0.012, 0.019 | <0.001 | 0.328 |
| Serum retinol (μM) | 0.127 | 0.056, 0.198 | 0.001 | 0.046 |
| α-Tocopherol (√μM) | ||||
| Milk fat (g/L) | 0.030 | 0.025, 0.036 | <0.001 | 0.426 |
| β-Carotenea (ln μM) | ||||
| Serum β-carotene (ln μM) | 0.547 | 0.420, 0.674 | <0.001 | 0.213 |
| Milk fat (g/L) | 0.031 | 0.022, 0.039 | <0.001 | 0.194 |
| MFFw (=1) | −0.279 | −0.443, −0.116 | 0.001 | 0.042 |
| Thiamineb (√μg/L) | ||||
| TDP/Hbc, (ng/g) | 0.012 | 0.009, 0.016 | <0.001 | 0.240 |
| MFFw (=1) | 1.092 | 0.043, 2.141 | 0.041 | 0.019 |
| Total B1d (μg/L) | ||||
| TDP/Hb (ng/g) | 0.360 | 0.269, 0.451 | <0.001 | 0.263 |
a n = 159
b n = 176
c TDP/Hb thiamine diphosphate per hemoglobin
dTotal B1 (total thiamine), sum of thiamine and thiamine monophosphate
Discussion
There was a high prevalence of iron deficiency and anemia in lactating women despite the routine provision of ferrous sulfate supplements during pregnancy. This suggests low iron intake by the food rations, inadequate dietary sources of iron (meat) and potential enhancers of iron absorption (ascorbic acid), iron loss from parasitic infections (helminths), prevalent hemoglobinopathies, low acceptance to provided supplements or some combination of these factors in this postpartum population. Most of the estimated daily iron intake from the food basket and supplementary food was covered by mung beans (6/9.2 mg) which are high in phytates known to inhibit iron absorption. MFF contributed in theory to one-third (4.5/12 mg) of recommended daily iron intake. Ascorbic acid and vitamin A in the flour might have been responsible for effective iron absorption [24, 25].
The strongest predictors of iron deficiency were having low whole-blood TDP, low serum retinol, anemia and being a smoker. There is a possibility that low whole-blood TDP may be associated with hemoglobinopathies or with G6PD deficiency [26] or that this group do not comply with supplements in general. The strong correlation of iron deficiency with anemia suggests the need to improve iron status which MFF was observed to do. Nevertheless, one-fifth of the women were still iron deficient with a concurrent high risk for anemia and other micronutrient deficiencies after distribution of MFF. This suggests that more than one approach is likely to be necessary to combat this problem [27, 28].
Zinc deficiency was highly prevalent in breast-feeding women from Maela camp reflecting a deficit of good food sources for zinc (red meat) and a predominantly plant-based staple food (mung beans) with high amounts of phytates known to have an inhibitory effect on zinc absorption [29]. Similar to iron, >50% of the estimated daily zinc intake from food rations derived from mung beans (2.4/4.2 mg). The theoretic zinc intake by MFF (2.7 mg/day) was higher but still not sufficient to reach the recommended daily intake (9.5 mg). Serum ferritin, zinc and copper and breast milk concentrations of iron, zinc and copper as well as the proportion of women with anemia were in the same range as similar reports from rural Vietnam [30], Peru and Nepal [31, 32].
Iron in the flour did not appear to affect zinc absorption [33] and both iron and zinc status significantly improved (lower sTfR, higher milk iron and higher serum zinc) after the introduction of the MFF. Despite MFF, 50% of women still demonstrated zinc deficiency which is a concern as zinc deficiency is associated with impaired fetal growth [34]. The concentration of zinc in breast milk was adequate despite low serum zinc of the mothers suggesting an active transfer from serum to breast milk [35]. The daily consumption of fermented fish paste, which is usually eaten together with rice and vegetables, was positively associated with milk zinc and could therefore be an important source of zinc and enhancers (organic acids) of zinc absorption.
Milk retinol was higher than reported for Karen and Lahu hill tribes (<0.8 μmol/L) from Chiang Mai province, Thailand [36], and milk α-tocopherol was higher than in breast milk of Spanish mothers at day 40 of lactation [37]. The variability of retinol and α-tocopherol in breast milk samples of the present study was highly predicted by milk fat concentrations. The proportions of low or deficient milk retinol (≤1.05 μmol/L) decreased considerably using the milk fat adjusted cut off (≤28 μmol/kg fat). On the basis of serum retinol (6% < 1.05 μmol/L) and of fat adjusted milk retinol (5 and 16% ≤ 28 μmol/kg fat), there is little evidence of severe vitamin A deficiency among lactating mothers from Maela camp.
Higher β-carotene in serum and milk in the PreMFFw group rather than in the MFFw group is most likely due to the fact that samples of mothers in the PreMFFw group were collected at the end of the dry season when β-carotene-rich mango fruits were still available [38–40]. The intake of β-carotene-rich vegetables, oils and fruits is recommended in order to meet the vitamin A requirement for mothers and their breast-fed infants whose diet excludes the consumption of meat, liver and eggs [41]. Higher β-carotene intake in PreMFFw group might have been responsible for the significantly lower prevalence of low fat adjusted milk retinol than in the MFFw group.
Whole-blood TDP in postpartum women from Maela was in the upper range of adult females from Norway to Japan [22, 42], which suggest good compliance to high doses of oral thiamine mononitrate (100 mg daily compared to recommended daily nutrient intakes for thiamine of 1.5 mg for lactating women [43]). Whole-blood TDP was highly positively correlated with thiamine and thiamine mono-phosphate in breast milk. Higher thiamine in the milk of those mothers who were provided with MFF suggests an additional impact by MFF despite the provision of high-dose thiamine supplements. In the present study, the mean total thiamine in milk was higher than reported for European [44] and vitamin supplemented well-nourished American mothers [45]. This is not unexpected as thiamine supplementation of pregnant and lactating women was the main response to the extremely high mortality (18% of all births) from infantile Beriberi (1987–1990 40% of all infant mortality) previously reported in this population [5].
Ideally, the same group would be studied before and after the introduction of MFF but this was not possible because you can only measure women at 3 months postpartum once. A randomized controlled design was also ruled out as the ration was distributed to the whole camp. Seasonal or other confounding factors may have affected the group differences observed and this is acknowledged for β-carotene. The data on supplements were what was supplied to the woman not what was actually ingested. There was no change in the method of providing supplements or educational programmes during the period of the survey apart from MFF promotion to the camp population. As these factors hold true for both groups of women and as the baseline characteristics of mothers were very similar, the observed changes in iron and micronutrient status are most likely to be due to only major dietary change, i.e., MFF. The possible role of hemoglobinopathies in the etiology of anemia has not been assessed in this population but is also a factor that could not be influenced by supplements or MFF. Further studies plan to determine the contribution of hemoglobinopathies to anemia in this population.
The introduction of MFF in Maela camp reduced iron and zinc deficiency in postpartum women. The lower prevalence of iron deficiency in the MFFw group was simultaneously associated with significantly higher iron and thiamine in breast milk. Despite MFF and a high compliance to antenatal visits and provision of very high levels of iron and vitamin supplementation, anemia and deficiency of iron and zinc remain a significant burden in Maela Refugee camp women.
Acknowledgments
The present study was financially supported by the Wellcome Trust of Great Britain and the Eiselen Foundation in Ulm, Germany. The authors’ responsibilities were as follows: Wolfgang Stuetz, Verena Ilona Carrara, Rose McGready and Francois Henry Nosten designed the study; Verena Ilona Carrara supervised study enrollment and data and sample collection; Wolfgang Stuetz, Juergen Georg Erhardt and Joern Breuer were responsible for the laboratory investigations; Wolfgang Stuetz, Verena Ilona Carrara and Sue Jean Lee analyzed data and performed statistical analysis; Wolfgang Stuetz, Sue Jean Lee and Rose McGready wrote the manuscript; and Verena Ilona Carrara, Joern Breuer, Hans Konrad Biesalski and Francois Henry Nosten provided significant advice and critically edited the manuscript.
Conflict of interest
None of the authors had a personal or financial conflict of interest.
Open Access
This article is distributed under the terms of the Creative Commons Attribution Noncommercial License which permits any noncommercial use, distribution, and reproduction in any medium, provided the original author(s) and source are credited.
References
- 1.Toole MJ. Micronutrient deficiencies in refugees. Lancet. 1992;339:1214–1216. doi: 10.1016/0140-6736(92)91143-V. [DOI] [PubMed] [Google Scholar]
- 2.Prinzo ZW, De Benoist B. Meeting the challenges of micronutrient deficiencies in emergency-affected population. Proc Nutr Soc. 2002;61:251–257. doi: 10.1079/PNS2002151. [DOI] [PubMed] [Google Scholar]
- 3.Woodruff BA, Blanck HM, Slutsker L, Cookson ST, Larson MK, Duffield A, Bhatia R. Anaemia, iron status and vitamin A deficiency among adolescent refugees in Kenya and Nepal. Public Health Nutr. 2006;9:26–34. doi: 10.1079/PHN2005825. [DOI] [PubMed] [Google Scholar]
- 4.Thailand Burmese Border Consortium (2006) Programme report for january–june 2006. ReliefWeb. http://www.reliefweb.int/rw/RWB.NSF/db900SID/ TKAE-6U49SV?OpenDocument. Accessed 5 Sep 2006
- 5.Luxemburger C, White NJ, ter Kuile F, Singh HM, Allier-Frachon I, Ohn M, Chongsuphajaisiddhi T, Nosten F. Beriberi: the major cause of infant mortality in Karen refugees. Trans R Soc Trop Med Hyg. 2003;97:251–255. doi: 10.1016/S0035-9203(03)90134-9. [DOI] [PubMed] [Google Scholar]
- 6.Riedel AE, Menefee A. Assessment of nutrient adequacy of rations for displaced persons from Burma on the western border of Thailand. Bangkok: Burmese Border Consortium (BBC); 1997. [Google Scholar]
- 7.Banjong O, Menefee A, Sranacharoenpong K, Chittchang U, Eg-kantrong P, Boonpraderm A, Tamachotipong S. Dietary assessment of refugees living in camps: a case study of Mae La Camp, Thailand. Food Nutr Bull. 2003;24:360–367. doi: 10.1177/156482650302400406. [DOI] [PubMed] [Google Scholar]
- 8.Luxemburger C, McGready R, Kham A, Morison L, Cho T, Chongsuphajaisiddhi T, White NJ, Nosten F. Effects of malaria during pregnancy on infant mortality in an area of low malaria transmission. Am J Epidemiol. 2001;154:459–465. doi: 10.1093/aje/154.5.459. [DOI] [PubMed] [Google Scholar]
- 9.McGready R, Simpson JA, Cho T, Dubowitz L, Changbumrung S, Bohm V, Munger RG, Sauberlich HE, White NJ, Nosten F. Postpartum thiamine deficiency in a Karen displaced population. Am J Clin Nutr. 2001;74:808–813. doi: 10.1093/ajcn/74.6.808. [DOI] [PubMed] [Google Scholar]
- 10.Stuetz W, McGready R, Cho T, Prapamontol T, Biesalski HK, Stepniewska K, Nosten F. Relation of DDT residues to plasma retinol, alpha-tocopherol, and beta-carotene during pregnancy and malaria infection: a case-control study in Karen women in northern Thailand. Sci Total Environ. 2006;363:78–86. doi: 10.1016/j.scitotenv.2005.06.032. [DOI] [PubMed] [Google Scholar]
- 11.Erhardt JG, Estes JE, Pfeiffer CM, Biesalski HK, Craft NE. Combined measurement of ferritin, soluble transferrin receptor, retinol binding protein, and C-reactive protein by an inexpensive, sensitive, and simple sandwich enzyme-linked immunosorbent assay technique. J Nutr. 2004;134:3127–3132. doi: 10.1093/jn/134.11.3127. [DOI] [PubMed] [Google Scholar]
- 12.Cook JD, Baynes RD, Skikne BS. Iron deficiency and the measurement of iron status. Nutr Res Rev. 1992;5:198–202. doi: 10.1079/NRR19920014. [DOI] [PubMed] [Google Scholar]
- 13.WHO . Iron deficiency anaemia: assessment, prevention, and control. Geneva: WHO; 2001. [Google Scholar]
- 14.Semba RD, Muhilal A, West KP, Jr, Natadisastra G, Eisinger W, Lan Y, Sommer A. Hyporetinolemia and acute phase proteins in children with and without xerophthalmia. Am J Clin Nutr. 2000;72:146–153. doi: 10.1093/ajcn/72.1.146. [DOI] [PubMed] [Google Scholar]
- 15.Hotz C, Peerson JM, Brown KH. Suggested lower cutoffs of serum zinc concentrations for assessing zinc status: reanalysis of the second national health and nutrition examination survey data (1976–1980) Am J Clin Nutr. 2003;78:756–764. doi: 10.1093/ajcn/78.4.756. [DOI] [PubMed] [Google Scholar]
- 16.Nobrega JA, Gelinas Y, Krushevska A, Barnes RM. Direct determination of major and trace elements in milk by inductively coupled plasma atomic emission and mass spectrometry. J Anal At Spectrom. 1997;12:1243–1246. doi: 10.1039/a607492h. [DOI] [Google Scholar]
- 17.Stuetz W, Prapamontol T, Hongsibsong S, Biesalski HK. Polymethoxylated flavones, flavanone glycosides, carotenoids, and antioxidants in different cultivation types of tangerines (Citrus reticulata Blanco cv. Sainampueng) from northern Thailand. J Agric Food Chem. 2010;58:6069–6074. doi: 10.1021/jf904608h. [DOI] [PubMed] [Google Scholar]
- 18.WHO . Indicators for assessing vitamin A deficiency and their application in monitoring and evaluating intervention programmes. Geneva: WHO; 1996. [Google Scholar]
- 19.Lucas A, Hudson GJ, Simpson P, Cole TJ, Baker BA. An automated enzymic micromethod for the measurement of fat in human milk. J Dairy Res. 1987;54:487–492. doi: 10.1017/S0022029900025693. [DOI] [PubMed] [Google Scholar]
- 20.Gerrits J, Eidhof H, Brunnekreeft JW, Hessels J. Determination of thiamin and thiamin phosphates in whole blood by reversed-phase liquid chromatography with precolumn derivatization. Methods Enzymol. 1997;279:74–82. doi: 10.1016/S0076-6879(97)79011-6. [DOI] [PubMed] [Google Scholar]
- 21.Wielders JP, Mink CJ. Quantitative analysis of total thiamine in human blood, milk and cerebrospinal fluid by reversed-phase ion-pair high-performance liquid chromatography. J Chromatogr. 1983;277:145–156. doi: 10.1016/S0378-4347(00)84831-8. [DOI] [PubMed] [Google Scholar]
- 22.Ihara H, Hirano A, Wang L, Okada M, Hashizume N. Reference values for whole blood thiamine and thiamine phosphate esters in Japanese adults. J Anal Bio-Sci. 2005;28:241–246. [Google Scholar]
- 23.WHO . Thiamine deficiency and its prevention and control in major emergencies. Geneva: WHO; 1999. [Google Scholar]
- 24.Teucher B, Olivares M, Cori H. Enhancers of iron absorption: ascorbic acid and other organic acids. Int J Vitam Nutr Res. 2004;74:403–419. doi: 10.1024/0300-9831.74.6.403. [DOI] [PubMed] [Google Scholar]
- 25.Layrisse M, Garcia-Casal MN, Solano L, Baron MA, Arguello F, Llovera D, Ramirez J, Leets I, Tropper E. New property of vitamin A and beta-carotene on human iron absorption: effect on phytate and polyphenols as inhibitors of iron absorption. Arch Latinoam Nutr. 2000;50:243–248. [PubMed] [Google Scholar]
- 26.Hussein L, Arafah A, Yamamah G. The vitamin B1 status among young Egyptians from the oasis in relation to glucose-6 phosphate dehydrogenase deficiency. Int J Vitam Nutr Res. 1989;59:52–54. [PubMed] [Google Scholar]
- 27.Abel R, Rajaratnam J, Kalaimani A, Kirubakaran S. Can iron status be improved in each of the three trimesters? A community-based study. Eur J Clin Nutr. 2000;54:490–493. doi: 10.1038/sj.ejcn.1601044. [DOI] [PubMed] [Google Scholar]
- 28.Gibson RS, Hotz C. Dietary diversification/modification strategies to enhance micronutrient content and bioavailability of diets in developing countries. Br J Nutr. 2001;85(Suppl 2):S159–S166. doi: 10.1079/BJN2001309. [DOI] [PubMed] [Google Scholar]
- 29.Lonnerdal B. Dietary factors influencing zinc absorption. J Nutr. 2000;130:1378S–1383S. doi: 10.1093/jn/130.5.1378S. [DOI] [PubMed] [Google Scholar]
- 30.Nakamori M, Ninh NX, Isomura H, Yoshiike N, Hien VT, Nhug BT, Nhien NV, Nakano T, Khan NC, Yamamoto S. Nutritional status of lactating mothers and their breast milk concentration of iron, zinc and copper in rural Vietnam. J Nutr Sci Vitaminol (Tokyo) 2009;55:338–345. doi: 10.3177/jnsv.55.338. [DOI] [PubMed] [Google Scholar]
- 31.Moser PB, Reynolds RD, Acharya S, Howard MP, Andon MB, Lewis SA. Copper, iron, zinc, and selenium dietary intake and status of Nepalese lactating women and their breast-fed infants. Am J Clin Nutr. 1988;47:729–734. doi: 10.1093/ajcn/47.4.729. [DOI] [PubMed] [Google Scholar]
- 32.Caulfield LE, Zavaleta N, Figueroa A. Adding zinc to prenatal iron and folate supplements improves maternal and neonatal zinc status in a Peruvian population. Am J Clin Nutr. 1999;69:1257–1263. doi: 10.1093/ajcn/69.6.1257. [DOI] [PubMed] [Google Scholar]
- 33.Davidsson L, Almgren A, Sandstrom B, Hurrell RF. Zinc absorption in adult humans: the effect of iron fortification. Br J Nutr. 1995;74:417–425. doi: 10.1079/BJN19950145. [DOI] [PubMed] [Google Scholar]
- 34.Beer WH, Johnson RF, Guentzel MN, Lozano J, Henderson GI, Schenker S. Human placental transfer of zinc: normal characteristics and role of ethanol. Alcohol Clin Exp Res. 1992;16:98–105. doi: 10.1111/j.1530-0277.1992.tb00644.x. [DOI] [PubMed] [Google Scholar]
- 35.Domellof M, Lonnerdal B, Dewey KG, Cohen RJ, Hernell O. Iron, zinc, and copper concentrations in breast milk are independent of maternal mineral status. Am J Clin Nutr. 2004;79:111–115. doi: 10.1093/ajcn/79.1.111. [DOI] [PubMed] [Google Scholar]
- 36.Panpanich R, Vitsupakorn K, Harper G, Brabin B. Serum and breast-milk vitamin A in women during lactation in rural Chiang Mai, Thailand. Ann Trop Paediatr. 2002;22:321–324. doi: 10.1179/027249302125001976. [DOI] [PubMed] [Google Scholar]
- 37.Ortega RM, Lopez-Sobaler AM, Andres P, Martinez RM, Quintas ME, Requejo AM. Maternal vitamin E status during the third trimester of pregnancy in Spanish women: influence on breast milk vitamin E concentration. Nutr Res. 1999;19:25–36. doi: 10.1016/S0271-5317(98)00176-6. [DOI] [Google Scholar]
- 38.Lietz G, Henry CJ, Mulokozi G, Mugyabuso JK, Ballart A, Ndossi GD, Lorri W, Tomkins A. Comparison of the effects of supplemental red palm oil and sunflower oil on maternal vitamin A status. Am J Clin Nutr. 2001;74:501–509. doi: 10.1093/ajcn/74.4.501. [DOI] [PubMed] [Google Scholar]
- 39.Meneses F, Torres AG, Trugo NM. Influence of recent dietary intake on plasma and human milk levels of carotenoids and retinol in Brazilian nursing women. Adv Exp Med Biol. 2004;554:351–354. doi: 10.1007/978-1-4757-4242-8_39. [DOI] [PubMed] [Google Scholar]
- 40.Canfield LM, Clandinin MT, Davies DP, Fernandez MC, Jackson J, Hawkes J, Goldman WJ, Pramuk K, Reyes H, Sablan B, Sonobe T, Bo X. Multinational study of major breast milk carotenoids of healthy mothers. Eur J Nutr. 2003;42:133–141. doi: 10.1007/s00394-003-0403-9. [DOI] [PubMed] [Google Scholar]
- 41.Strobel M, Tinz J, Biesalski HK. The importance of beta-carotene as a source of vitamin A with special regard to pregnant and breastfeeding women. Eur J Nutr. 2007;46(Suppl 1):1–20. doi: 10.1007/s00394-007-1001-z. [DOI] [PubMed] [Google Scholar]
- 42.Tallaksen CM, Bohmer T, Bell H, Karlsen J. Concomitant determination of thiamin and its phosphate esters in human blood and serum by high-performance liquid chromatography. J Chromatogr. 1991;564:127–136. doi: 10.1016/0378-4347(91)80075-N. [DOI] [PubMed] [Google Scholar]
- 43.FAO (2001) Human vitamin and mineral requirements. Report of a joint FAO/WHO expert consultation in Bangkok, Thailand. FAO, Rome
- 44.Dostálová L, Salmenpera L, Vaclavinkova V, Heinz-Erian PH, Schuep W. Vitamin concentration in term milk of European mothers. In: Berger H, editor. Vitamins and minerals in pregnancy and lactation (nestle nutrition workshop series, vol 16) NY: Raven Press; 1988. pp. 275–329. [Google Scholar]
- 45.Nail PA, Thomas MR, Eakin R. The effect of thiamin and riboflavin supplementation on the level of those vitamins in human breast milk and urine. Am J Clin Nutr. 1980;33:198–204. doi: 10.1093/ajcn/33.2.198. [DOI] [PubMed] [Google Scholar]
- 46.Souci SW, Fachmann W, Kraut H. Food composition and nutrition tables. Stuttgart: Med Pharm Scientific Publishers; 2008. [Google Scholar]