SYNOPSIS
Objectives
We compared state-specific all-terrain vehicle (ATV) fatality rates from 2000–2007 with 1990–1999 data, grouping states according to helmet, training, and licensure requirements.
Methods
We used the CDC WONDER online database to identify ATV cases from 2000–2007 and calculate rates per 100,000 population by state, gender, and age.
Results
ATV deaths (n=7,231) occurred at a rate of 0.32 per 100,000 population. Males accounted for 86% of ATV-related deaths at a rate that was six times that for females (0.55 vs. 0.09 per 100,000 population, respectively); 60% of the male deaths occurred in the 15- to 44-year age group. With the exception of the two oldest age categories, rates were consistently higher in the no-helmet-law group. Both the number and rate of ATV-related deaths increased more than threefold between 1990–1999 and 2000–2007. West Virginia and Alaska continue to have the highest ATV fatality rates (1.63 and 2.67 ATV deaths per 100,000 population, respectively).
Conclusions
Helmet-use requirements seem to slightly mitigate ATV-related death, but training requirements do not. For policy to be effective, it must be enforced.
Since their introduction in the 1970s, all-terrain vehicles (ATVs) have been used in a variety of recreational activities and in numerous occupational settings in the United States and other nations. Unfortunately, injuries and deaths related to the use of these vehicles have been a persistent problem throughout this period and have been increasing in recent years.1–4 According to the U.S. Consumer Product Safety Commission (CPSC), recreational ATVs in use have increased 126%, from 4.2 million units in 2000 to 9.5 million units in 2007; estimated deaths have increased 56% between 2000 and 2007, from 551 to 857 deaths annually (reporting is ongoing). Furthermore, estimated injuries seen in emergency departments increased 23% between 2000 and 2007, from 92,200 to 150,900 injuries annually.1
A variety of strategies to decrease ATV-related injuries have been attempted, including legislation, public awareness and education, hands-on training, and modifications in vehicle design. A few recent studies describing various ATV educational efforts directed at young people and mixed age groups have focused on behavioral change resulting from focus groups, videos, and training programs. Aitken and colleagues conducted multiple focus group meetings with both adult and adolescent ATV riders, discussing riding habits and use of protective gear. They concluded that licensing, training requirements, and improved enforcement of existing laws should be strategic components of ATV safety campaigns.5 Burgus et al. conducted a survey of young people aged 12–20 years at a national agricultural convention to identify safety-related behaviors, injuries, and effects of ATV safety training. They concluded that an understanding of the behavior of young ATV operators should be considered in the design of ATV safety programs and educational materials.6 Williams et al. found that using a brief ATV safety video in a required statewide hunter education course generally increased safety knowledge.7
Consistent with other areas of injury prevention and control, policy measures to reduce risky ATV use have been passed in many states, including helmet-use requirements, training requirements, and restrictions on use of the vehicles related to driver age and other factors. Studies of the impact of these policies have demonstrated somewhat mixed results. A 2001 report of state-specific death rates resulting from ATV crashes from 1990–1999 reported that the seven states without safety legislation had a collective death rate (0.17 deaths per 100,000 population) that was twice that of the other states (0.08 deaths per 100,000 population), all of which had some level of ATV legislation.8 West Virginia (0.70 ATV deaths per 100,000 population), one of the states in the former group, and Alaska (0.55 ATV deaths per 100,000 population), in the latter group, experienced the highest rates during the decade.
Rodgers used a different methodology to study factors associated with ATV mortality rates during the same time period and reported that West Virginia (6.33 ATV deaths per one million population) and Alaska (5.99 ATV deaths per one million population) had the highest rates; these two states accounted for about 7% of ATV-related deaths, despite representing less than 1% of the U.S. population.9 Because these studies were both cross-sectional in nature covering a 10-year period, they did not assess trends and changes in rates that may have resulted from nationwide education and training efforts dictated by a 10-year consent decree between CPSC and ATV manufacturers initiated in 1988.10 Rodgers noted that many of the safety laws were only applicable for part of the period, depending on when they went into effect. He also noted that, while state safety requirements are expected to reduce the mortality rate, the presence of high ATV mortality rates may spur the enactment of states' safety requirements.9
Upperman et al. reported an overall fatality rate of 0.09 ATV deaths per 100,000 population among children younger than 16 years of age for the period 1982–1998 and concluded that current legal and regulatory standards (as of 1998) had a low probability of decreasing pediatric ATV-related mortality.11 In a brief editorial, Helmkamp reported a 181% increase in the overall mortality rate in West Virginia, from 0.70 per 100,000 population in 1990–1999 to 1.94 per 100,000 population during 2000–2006; however, it should be noted that West Virginia enacted its safety legislation in 2005.12 A study by Helmkamp and colleagues reported that, during 2000–2005, there were 1,043 ATV deaths in children aged 15 years or younger (a rate of 0.27 per 100,000 population) compared with 4,161 deaths among adults (a rate of 0.31 per 100,000 population); there were notable rate differences between males and females in both age groups.13
Four additional recent studies have focused on legislation issues at the state level. Keenan and Bratton compared injury outcome and helmet use in a regulated state (Pennsylvania) and in an unregulated state (North Carolina) and found that, despite age restrictions and helmet requirements, young people in Pennsylvania suffered serious morbidity and mortality.14 Beidler and colleagues observed no significant changes in ATV riding patterns and little change in morbidity and mortality when comparing pre-legislation (December 1, 2004, to May 1, 2005) with post-legislation (December 1, 2005, to May 1, 2006) injury data in North Carolina.15 Winfield and colleagues' review of university-based level-one trauma center data concluded that Florida's ATV laws mandating helmet use for people aged <16 years and the prohibition of ATV use on roadways were inadequate to prevent injuries and their sequelae.16 However, Stolz et al., through a statewide telephone survey in Ohio (a state with restricted licensure, training, and operation requirements for ATVs), reported that registered voters were overwhelmingly in favor of restricting the use of ATVs by children <16 years of age, prohibiting passengers on ATVs, requiring helmets, and requiring all ATV owners and users to take a safety class.17
In summary, despite evidence of public support and a burgeoning problem with ATV injuries, existing studies of ATV laws are either out-of-date or difficult to generalize regarding which legislative components might be most effective in reducing risk. The purpose of this study was to calculate state-specific ATV fatality rates for the period 2000–2007, grouping the states according to helmet requirements and training and licensure requirements. Comparisons were made with published rates from 1990–1999.8
METHODS
ATV deaths and corresponding mortality rates per 100,000 population among people aged 1–84 years for 2000–2007 were obtained from the National Center for Health Statistics' Compressed Mortality File using the Centers for Disease Control and Prevention (CDC) WONDER online database.18 An ATV-related death, as the underlying cause, was defined according to the International Classification of Diseases, 10th revision (ICD-10) external cause of death codes V86.0–V86.9.19 A combination of information obtained from the Specialty Vehicle Institute of America (SVIA),20 CPSC,21 and a systematic review of online state-specific compilations of ATV-related legislation was used to group the states. States were considered as having ATV-related legislation if the laws went into effect at any time during the 2000–2007 study period.
The following age groups were used to present the number of deaths and mortality rates for each gender: 1–14, 15–44, 45–64, and 65–84 years of age. These groups generally correspond to groups used in previous ATV rate studies.8,12 Table cells with fewer than five deaths were suppressed and were not included, although they are subsumed in reported totals in this article.8
We tabulated and compared state-specific, age group, and gender-specific rates per 100,000 population. We used Poisson regression to test whether the gender-specific rates changed significantly during 2000–2007.4
RESULTS
General comparisons
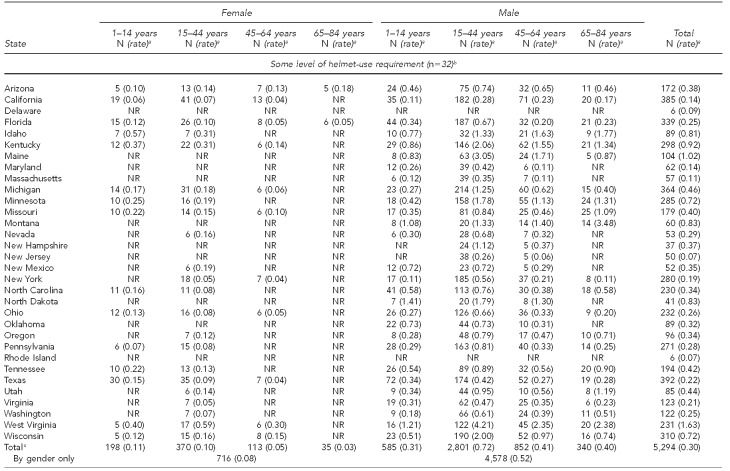
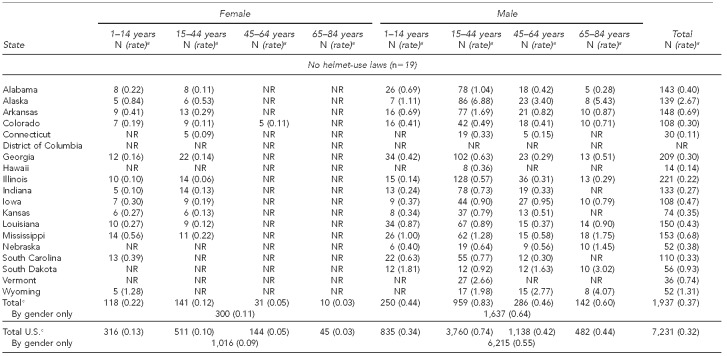
As shown in Table 1, during the eight-year study period, 7,231 ATV-related deaths occurred in the U.S., representing a rate of 0.32 per 100,000 population. Eighty-six percent of the deaths were among males at a rate of 0.55 per 100,000 population, which was six times the rate for females (0.09 per 100,000 population). Rates increased significantly among males, from 0.45 per 100,000 population in 2000 to 0.64 per 100,000 population in 2007 (slope = 0.05, p<0.0001); rates also increased among females, from 0.07 per 100,000 population in 2000 to 0.10 per 100,000 population in 2007 (slope = 0.06, p<0.0001), but at a much slower pace than for males (data not shown). Rates among females were highest in the 1- to 14-year age group (0.13 per 100,000 population) and steadily decreased with each subsequent age group. Six of every 10 male deaths occurred in the 15- to 44-year age group at a rate of 0.74 per 100,000 population, the highest rate for any age group. The highest state rates were observed in Alaska (2.67 per 100,000 population), West Virginia (1.63 per 100,000 population), Wyoming (1.31 per 100,000 population), and Maine (1.02 per 100,000 population) (Table 1).
Table 1.
State-specific ATV-related death rates, by helmet law status: U.S., 2000–2007
aRate per 100,000 population
bDifferent groups within states included users younger than 16 years of age, users operating ATVs on public land/state parks, all users, and users younger than 18 years of age.
cTotals account for cells that are not reportable.
ATV = all-terrain vehicle
NR = not reportable
Helmet regulations
Comparisons of state, gender, and age group rates are presented in Table 1 for 32 states with some level of helmet-use requirements and 19 states (including the District of Columbia) with no helmet-use requirements. Nearly 5,300 deaths occurred in the states with helmet-use requirements, at a rate of 0.30 per 100,000 population, compared with more than 1,900 deaths in the states with no helmet-use requirements, which had a rate that was 23% higher (0.37 per 100,000 population). With the exception of the two oldest age categories in both groups, the rates were consistently higher in the no-helmet-law group. In both comparison groups, rates in males were generally 5.8 to 6.5 times those of females. West Virginia (1.63 per 100,000 population) had the highest rate among helmet-use regulated states, and Alaska (2.67 per 100,000 population) had the highest rate among states with no helmet-use regulation.
Training and licensure requirements
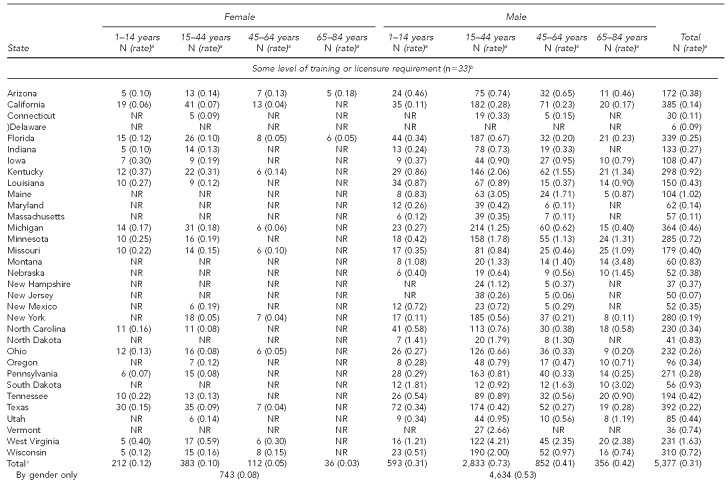
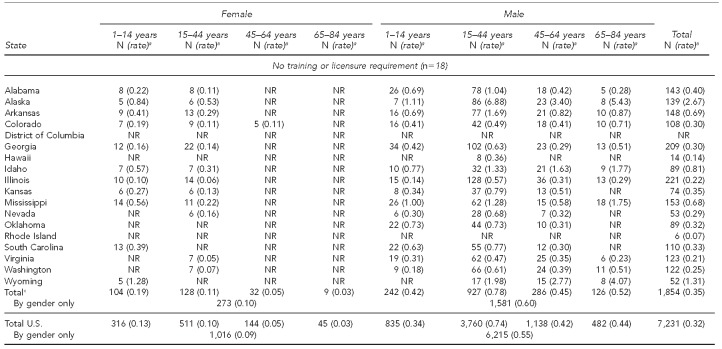
Table 2 presents state, gender, and age group rates for 33 states that have some level of ATV training or licensure requirements compared with 18 states (including the District of Columbia) that have no such requirements. While the regulated group experienced about three times as many deaths (n=5,377) as the non-regulated group (n=1,854), the rates were -somewhat similar (0.31 and 0.35 per 100,000 population, respectively). There was a more noticeable difference in rates among males overall between the groups: 0.53 per 100,000 population in the regulated group and 0.60 per 100,000 population in the non-regulated group. Rate differences were also apparent in each of the male age groups.
Table 2.
State-specific ATV-related death rates, by training and licensure requirements: U.S., 2000–2007
aRate per 100,000 population
bDifferent groups within states included users younger than 16 years of age, users younger than 18 years of age, users on public land, and users on land with other restrictions.
cTotals account for cells that are not reportable.
ATV = all-terrain vehicle
NR = not reportable
ATV-related deaths in 1990–1999 vs. 2000–2007
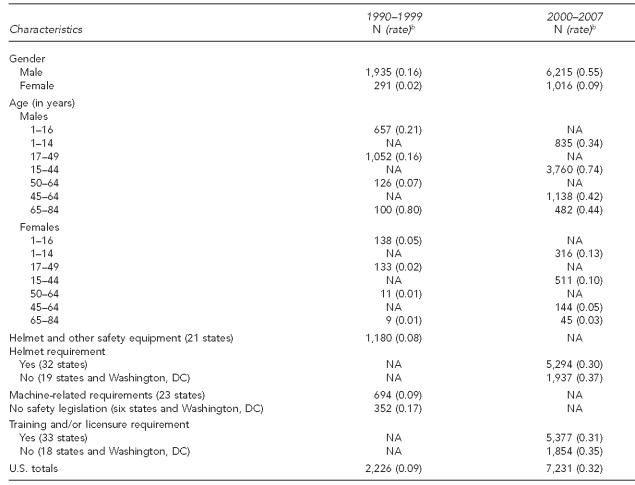
Table 3 provides data comparing rates for 1990–19998 and 2000–2007. Both the number (2,226 vs. 7,231) and rate (0.09 vs. 0.32 per 100,000 population) of ATV-related deaths increased more than threefold between the two time periods. This increase was also apparent for the rate in males, which rose 3.4-fold, from 0.16 to 0.55 per 100,000 population between the two time periods. Among females, the rate differential was a 4.5-fold increase, from 0.02 to 0.09 per 100,000 population. Although the age group composition was not exactly the same for the two time periods, substantial rate increases were observed in all but one age group from the earlier to the more recent period. The exception was among the oldest male group (65–84 years of age), in which the rate decreased about 50%, from 0.80 to 0.44 per 100,000 population. While the different regulation groups were not directly comparable across the two time periods, rates were consistently higher during the most recent period.
Table 3.
Comparison of ATV fatalities and rates: U.S., 1990–1999a and 2000–2007
aSource: Helmkamp JC. A comparison of state-specific all-terrain vehicle-related death rates, 1990–1999. Am J Public Health 2001;91:1792-5.
bRate per 100,000 population
ATV = all-terrain vehicle
NA = not applicable
DC = District of Columbia
DISCUSSION
The results of our study show a very troubling threefold increase in the number of ATV-related deaths and the tripling of fatality rates overall in the U.S. during the two time periods studied. Significant increases were demonstrated for both genders and within every state in the U.S. between 1990 and 2000. The popularity of ATVs has increased dramatically during this time period, with 1.8 million four-wheelers in use in 1990, rising to 4.2 million in 2000 and 9.5 million in 2007.1 Increased availability is likely a contributing factor to the substantial rise in ATV-related injury rates demonstrated in our study, along with the increasing size and power of the vehicles.22 Alaska and West Virginia still have the highest overall rates of fatal injury, and being a male between the ages of 15 and 44 years is a risk factor for injury and death.
Coding changes may also contribute to the increased number of deaths between the two decades. Prior to 1999, ATV-related deaths were often defined by ICD Ninth Revision, Clinical Modification (ICD-9 CM) codes with the E821 series (i.e., nontraffic accident involving other off-road vehicle),2 which provided no ATV specificity and likely underreported the true number of ATV-related deaths. Since 1999, however, ICD-10 has provided a new external cause of death code (V86: occupant of a special all-terrain or other motor vehicle designed primarily for off-road use) that groups all ATV-related fatalities under a single code and likely facilitates a more accurate counting of ATV-related deaths.19,23
The comparisons examining the impact of two main components of safety regulations, helmet use and training mandates, were of interest. ATV-related death rates were 23% higher in states without helmet-use requirements. This statistic suggests that helmet laws may have the desired effect of reducing the quantity and severity of injuries. Bowman and colleagues reported that helmet use appears to substantially decrease the mortality and morbidity associated with ATV-related crashes and resulting traumatic brain injuries and injuries to the head, face, and neck areas. They further stated that, “Helmet use is abysmally low among current ATV users and that enforceable state-level policy to promote increased helmet use appears to be not only warranted but critical to significantly reduce the burden of ATV-related injuries.”24
Training requirements were not associated with a marked difference in death rates, although some high-risk subsets (i.e., males) did show lower rates in states with training requirements. There is evidence from some states with such laws in place that enforcement is low and compliance with the requirements is highly variable. Further, the training requirements range widely from a few questions on a driving test to hands-on training. While the effectiveness of hands-on training to prevent ATV injury has not been thoroughly studied, more experience on the vehicles and a clearer understanding of the principles of riding an ATV would seem prudent for any novice rider. Unfortunately, the ATV Safety Institute, which provides much of the hands-on ATV training in the U.S., does not release data about the training it provides. Therefore, we relied on the broader approach of comparing states with or without legislative training requirements rather than comparing states where actual hands-on training has occurred.
Some policies that have shown considerable success in motor vehicle injury reduction have yet to be attempted for ATV use. For example, a graduated driver license approach for ATV operators might be considered an option that would allow young operators to develop skills on ATVs gradually and in lower-risk environments. This approach would require a carefully designed study to demonstrate its impact.
Limitations
This study was subject to several limitations. One limitation was that categorizing ATV laws across states is challenging. We could identify no two states with the same combination of policies governing ATVs in place in either 2000 or 2007.20 There was also variability even among those states with helmet-use and training requirements as to the age groups and circumstances of use under which the law applies. In 2000, SVIA reported that nine states had ATV laws addressing helmet use, three states had laws addressing training, and 13 other states had laws addressing both components.20 Legislation addressing helmet use and training was in effect for both California and Texas during the entire eight-year study period, while North Carolina—also in this same group—had both helmet-use and training components that became effective only during the latter part of the study period. ATV-related death rates in these three states all increased substantially during the decade: in California, from 0.04 to 0.14 per 100,000 population; in Texas, from 0.05 to 0.22 per 100,000 population; and in North Carolina, from 0.13 to 0.34 per 100,000 population. While we chose to group these states together regardless of when their legislation became effective during the study period, we acknowledge that misclassification of the status of these laws during the study period could have affected the results. We do, however, feel that our broad groupings were appropriate and help explain the notable rate differences observed between 1990–1999 and 2000–2007, and suggest that there may be an association between ATV laws and fatality rates. Rodgers opined in his study of ATV mortality rates from 1990–1999 that high mortality rates may drive legislation, which, in turn, would hopefully help facilitate rate reduction over time;9 our results suggest that the hoped-for rate reduction has not yet occurred.
In a descriptive study such as this, the potential for misclassification exists in terms of the status of the laws and how the states were grouped. Longer exposure to policies may lead to increased awareness, adoption of behavior change, and better enforcement of the laws. In a recent study assessing rural ATV riders' preferences for safety messaging, Brann and colleagues concluded that, while licensing and training requirements are generally lacking, they are considered desirable in the promotion of ATV safety by the ATV users participating in the focus groups.25
Finally, we recognize that other unmeasured factors (e.g., mix of users, types of vehicles used in different parts of the country, and law enforcement) may contribute to the rate patterns that were found. Winfield and colleagues provide a useful framework for ATV policy, suggesting that there are inherent flaws in a legislation-dominated approach to ATV safety—compliance (which is dependent on an individual's behavior), enforcement (which is dependent on having sufficient resources as well as a physical presence of those who can enforce), and an infinite number of independent variables (which can only be covered by the most restrictive of laws [i.e., an absolute ban]) that potentially would have a greater impact on injuries than does the presence of the laws themselves.16
CONCLUSIONS
Our data suggest that helmet-use regulations may influence the rate of ATV-related deaths, making an increased emphasis on the importance of helmet use while using ATVs an important strategy in reducing these injuries. Training requirements were not as clearly associated with a reduction in deaths, and further study of the type and amount of training required to make a difference is needed. Finally, for any policy to be effective, it must be enforced, and further study of barriers to acceptance and enforcement of these laws is needed.
Footnotes
This work was supported by grants from the National Center for Research Resources (1UL1RR029884) and by the Arkansas Biosciences Institute (RR020146). The findings and conclusions in this article are those of the authors and do not necessarily represent the views of the National Institute for Occupational Safety and Health or the University of Arkansas for Medical Sciences, College of Medicine.
REFERENCES
- 1.Consumer Product Safety Commission (US) National statistics: ATV-related deaths and injuries for all ages, 1985–2010. [cited 2011 May 18]. Available from: URL: http://www.atvsafety.gov/stats.html.
- 2.Helmkamp JC, Furbee PM, Coben JH, Tadros A. All-terrain vehicle-related hospitalizations in the United States, 2000–2004. Am J Prev Med. 2008;34:39–45. doi: 10.1016/j.amepre.2007.09.016. [DOI] [PubMed] [Google Scholar]
- 3.Bowman SM, Aitken ME. Still unsafe, still in use: ongoing epidemic of all-terrain vehicle injury hospitalizations among children. J Trauma. 2010;69:1344–9. doi: 10.1097/TA.0b013e3181ea283d. [DOI] [PubMed] [Google Scholar]
- 4.Helmkamp JC, Marsh SM, Aitken ME. Occupational all-terrain vehicle deaths among workers 18 years and older in the United States, 1992–2007. J Agric Saf Health. 2011;17:147–55. doi: 10.13031/2013.36498. [DOI] [PubMed] [Google Scholar]
- 5.Aitken ME, Graham CJ, Killingsworth JB, Mullins SH, Parnell DN, Dick RM. All-terrain vehicle injury in children: strategies for prevention. Inj Prev. 2004;10:303–7. doi: 10.1136/ip.2003.004176. [DOI] [PMC free article] [PubMed] [Google Scholar]
- 6.Burgus SK, Madsen MD, Sanderson WT, Rautianinen RH. Youths operating all-terrain vehicles—implications for safety education. J Agromedicine. 2009;14:97–104. doi: 10.1080/10599240902751047. [DOI] [PubMed] [Google Scholar]
- 7.Williams RS, Graham J, Helmkamp JC, Dick R, Thompson T, Aitken ME. A trial of an all-terrain vehicle safety education video in a community-based hunter education program. J Rural Health. 2011;27:255–62. doi: 10.1111/j.1748-0361.2010.00327.x. [DOI] [PubMed] [Google Scholar]
- 8.Helmkamp JC. A comparison of state-specific all-terrain vehicle-related death rates, 1990–1999. Am J Public Health. 2001;91:1792–5. doi: 10.2105/ajph.91.11.1792. [DOI] [PMC free article] [PubMed] [Google Scholar]
- 9.Rodgers GB. Factors associated with the all-terrain vehicle mortality rate in the United States: an analysis of state-level data. Accid Anal Prev. 2008;40:725–32. doi: 10.1016/j.aap.2007.09.021. [DOI] [PubMed] [Google Scholar]
- 10.U.S. District Court for the District of Columbia. United States of America v. Polaris Industries, L.P., et al. Civil action no. 87-3525. 1988.
- 11.Upperman JS, Shultz B, Gaines BA, Hackam D, Cassidy LD, Ford HR, et al. All-terrain vehicle rules and regulations: impact on pediatric mortality. J Pediatr Surg. 2003;38:1284–6. doi: 10.1016/s0022-3468(03)00383-x. [DOI] [PubMed] [Google Scholar]
- 12.Helmkamp JC. A more effective prescription for ATV safety. W V Med J. 2006;102:5. [PubMed] [Google Scholar]
- 13.Helmkamp JC, Aitken ME, Lawrence BA. ATV and bicycle deaths and associated costs in the United States, 2000–2005. Public Health Rep. 2009;124:409–18. doi: 10.1177/003335490912400310. [DOI] [PMC free article] [PubMed] [Google Scholar]
- 14.Keenan HT, Bratton SL. All-terrain vehicle regulation for children: a comparison of a state with and a state without a helmet law. Pediatrics. 2004;13:e330–4. doi: 10.1542/peds.113.4.e330. [DOI] [PubMed] [Google Scholar]
- 15.Beidler SK, Kromhout-Schiro S, Douillet CD, Riesenman PJ, Rich PB. North Carolina all-terrain vehicle (ATV) safety legislation: an assessment of the short-term impact on ATV-related morbidity and mortality. N C Med J. 2009;70:503–6. [PubMed] [Google Scholar]
- 16.Winfield RD, Mozingo DW, Armstrong JH, Hollenbeck JI, Richards WT, Martin LC, et al. ATV safety in Florida: is legislation really the answer? Am Surg. 2010;76:149–53. [PubMed] [Google Scholar]
- 17.Stolz U, McKenzie LB, Mehan TJ, Smith GA. Assessing public opinion regarding potential ATV-related policies. J Safety Res. 2009;40:149–55. doi: 10.1016/j.jsr.2009.02.005. [DOI] [PubMed] [Google Scholar]
- 18.Centers for Disease Control and Prevention (US) Compressed mortality, 1999-2007. [cited 2011 May 31]. Available from: URL: http://wonder.cdc.gov/controller/datarequest/D53.
- 19.World Health Organization. ICD-10: international statistical classification of diseases and related health problems. volume 1. Geneva: WHO; 1992. [Google Scholar]
- 20.Specialty Vehicle Institute of America. State all-terrain vehicle requirements, November 2000 and November 2007. Arlington (VA): SVIA Government Relations Office; 2008. [Google Scholar]
- 21.Consumer Product Safety Commission (US) ATV state legislative resource bank. [cited 2011 May 26]. Available from: URL: http://www.atvsafety.gov/legislation/legislation.html.
- 22.Government Accountability Office (US) Washington: GAO; 2010. Apr, [cited 2011 Apr 20]. All-terrain vehicles—how they are used, crashes, and sales of adult-sized vehicles for children's use.Report 10-418. Also available from: URL: http://www.gao.gov/new.items/d10418.pdf. [Google Scholar]
- 23.Garland S. 2009 annual report of ATV-related deaths and injuries. Bethesda (MD): Consumer Product Safety Commission (US); 2010. Dec, [cited 2011 Nov 21]. Also available from: URL: http://www.cpsc.gov/library/foia/foia11/os/atv2009.pdf. [Google Scholar]
- 24.Bowman SM, Aitken ME, Helmkamp JC, Maham SA, Graham CJ. Impact of helmets on injuries to riders of all-terrain vehicles. Inj Prev. 2009;15:3–7. doi: 10.1136/ip.2008.019372. [DOI] [PubMed] [Google Scholar]
- 25.Brann M, Mullins SH, Miller BK, Eoff S, Graham J, Aitken ME. Making the message meaningful: a qualitative assessment of media promoting all-terrain vehicle safety. Inj Prev. 2011 Nov 19; doi: 10.1136/injuryprev-2011-040132. [Epub ahead of print] [DOI] [PMC free article] [PubMed] [Google Scholar]


