

Abstract
The arterial baroreflex system (BRS) consists of at least three closed-loop control systems: the heart rate (HR), vascular tone (VT), and stroke volume (SV) BRSs. Whereas HR-BRS gain is well studied, VT-BRS and SV-BRS gain are not. This study aimed to develop a method for quantifying VT-BRS and SV-BRS gain using an established HR-BRS gain measurement approach. ECG and beat-to-beat blood pressure (BP) were recorded in 31 young healthy participants during three tasks. Sequences of R-to-R wave intervals (RRI) of the ECG, pulse transit time (PTT), and SV were measured to assess HR-, VT-, and SV-BRS gain using the cross-spectral technique of computing the BP-RRI, BP-PTT, and BP-SV transfer functions. Gain in each BRS arch was measured in individuals with intact BRS functioning. Functional overlap and independence was noted in the BRS arches. The implications of the proposed method are discussed.
The arterial baroreflex system (BRS) is a reflexive control system that counteracts acute shifts in blood pressure (BP) by invoking compensatory reactions in cardiovascular functions (e.g., heart rate [HR], vascular tone [VT], and stroke volume [SV]). Short-term BP regulation is an essential function of the BRS, serving to protect the brain from stroke and the heart from myocardial infarction. The BRS, however, also provides a means by which variability in BP modulates the inhibitory processes in the brain.
The BRS can be conceptualized as a closed-loop control system with at least three negative feedback arches (Figure 1) that link BP to HR, VT, and SV (Aljuri & Cohen, 2004; Aljuri, Marini, Richard, & Cohen, 2004; Casadei, Meyer, Coats, Conway, & Sleight, 1992; van de Vooren et al., 2007; Vaschillo, Vaschillo, Buckman, Pandina, & Bates, 2011). These feedback arches can be envisioned as separate but parallel BRSs (HR-BRS, VT-BRS, and SV-BRS) that are coordinated by the activity of the baroreceptors. Baroreceptors, located on all arterial vessel walls, trigger simultaneous reflexive reactions in HR, VT, and SV. Based on the inherent delays in HR, VT, and SV responses to BP changes, each BRS arch has a unique resonance frequency (Aljuri & Cohen, 2004; Aljuri et al., 2004; van de Vooren et al., 2007; Vaschillo et al., 2011). Thus, each BRS arch can produce resonant BP oscillations in response to a wide variety of challenges.
Figure 1.
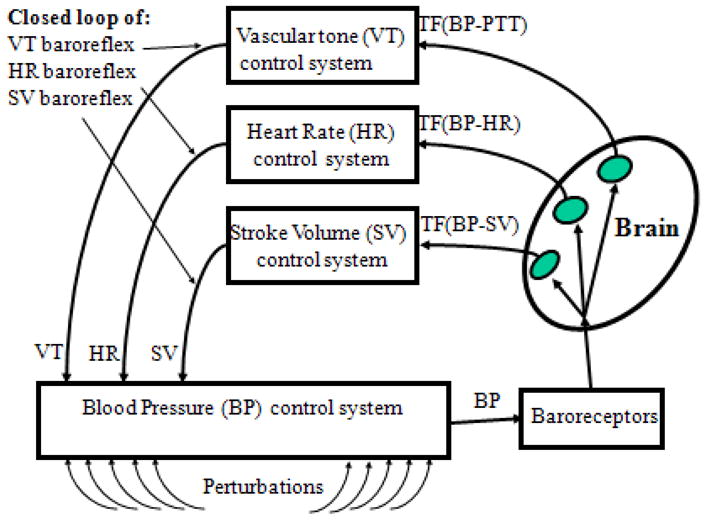
A three closed-loop model of the baroreflex.
BP variability enhances inhibitory processes in the brain (Lacey & Lacey, 1970) to support adaptive responses to challenges (e.g., stress) (Reyes del Paso, Gonzalez, & Hernandez, 2004; Thayer & Lane, 2000). This cardiovascular feedback to the brain is supported by afferent projections from the baroreceptors (Benarroch, 1997) to modulate emotions, cognition, and goal-directed behavior (Reyes Del Paso, Gonzalez, Hernandez, Duschek, & Gutierrez, 2009; Yasumasu, Reyes Del Paso, Takahara, & Nakashima, 2006). The existence of redundant BRS arches ensures that compensatory systems are in place to modulate BP variability in the event that one system fails due to illness, disease, or acute dampening. Knowledge of the sensitivity of each BRS arch may have considerable and distinct therapeutic implications.
Current research on BRS activity focuses on the HR-BRS feedback arch and examines cardiovascular reactivity at the sinoatrial node. HR-BRS gain (sensitivity, in ms/mmHg) is used as an index of arterial BRS activity and calculated from simultaneous recording of BP and R-toR-wave intervals (RRI) of the electrocardiogram (ECG). It is assessed as the magnitude of change in RRI (ms) in response to one mmHg change in BP. BP changes can be induced via vasoactive drug injections (Mancia & Mark, 1983; Smyth, Sleight, & Pickering, 1969) or characterized as they spontaneously arise (Cooke et al., 1999). HR-BRS gain can be measured using sequential slope analysis (slope of RRI change in response to progressive systolic BP change) and cross-spectral analysis (using the BP–RRI transfer function [TF] of the BRS system, where BP is the input and RRI is the output). This study examined whether the cross-spectral technique can be extended to assess gain in the VT-BRS and SV-BRS arches. The sequential slope technique also may work and warrants further examination.
To the best of our knowledge, only one study has measured VT-BRS gain (Yambe, Sugita, & Yoshizawa, 2009) and one study has measured SV-BRS gain (Yasumasu, Abe, Oginosawa, Takahara, & Nakashima, 2005). Yet, the VT-BRS and SV-BRS arches are of no less importance to physiological health than the HR-BRS. The VT-BRS arch controls variability in blood vessel diameter. The SV-BRS arch controls variability in the volume of blood ejected from the heart during each beat. The ability of blood vessels to contract or expand, and blood volume to increase or decrease, in response to changes in BP ensures sufficient VT and SV. Under certain conditions, these cardiovascular dynamics also can produce resonant BP oscillations that activate inhibitory brain processes and modulate cognitive-emotional responding.
This study was designed to determine whether VT-BRS (ms/mmHg) and SV-BRS (ml/mmHg) gain could be measured as the change in pulse transit time (PTT, in ms) and SV (in ml), respectively, caused by one mmHg change in BP. We propose a measurement of VT-BRS and SV-BRS gain, estimated, respectively, from the BP–PTT and BP-SV TFs, to provide complementary information about arterial BRS activity beyond that provided by calculating of HR-BRS gain. Assessing the activity level of each BRS arch in parallel may reveal its capacity to contribute in short-term BP stabilization as well as higher-order central nervous system (CNS) functions.
Method
This study was approved by the Rutgers University Institutional Review Board for the Protection of Human Subjects Involved in Research.
Participants and Procedure
The intact BRS was studied in 31 (15 women) young healthy adults ages 21 to 24 years (mean = 21.68; SD = 0.91) during three 5-min tasks. The low-cognitive demand baseline (BL) task involved viewing squares that changed color every 10 s and silently counting the blue/green ones. The physiological stimulation task involved a paced, 6 times/min, breathing task (6P), which has been shown to increase HR-BRS gain (Lehrer et al., 2003). The emotional stimulation task involved viewing 30 emotionally negative (NG) picture cues (each 5 s on, 5 s off). Participants were comfortably seated in front of a TV screen. A standard lead II was used for ECG measurement. A sensor was attached to the second phalange of the right middle finger for BP measurement. A PowerLab Acquisition System (ADInstruments, Colorado Springs, CO) and Finometer MIDI (Finapres, Amsterdam, The Netherlands) were used to collect ECG and beat-to-beat BP data (2000-Hz sampling rate). Physiological data were analyzed using WinCPRS software (Absolute Alien Oy, Turku, Finland). Beat-to-beat BP, RRI, SV, and PTT were calculated. PTT was measured as the interval between the R-wave of the ECG and the apex of the finger pulse wave. The ModelFlow methodology for cardiac output measurement (Bogert & van Lieshout, 2005) was used to assess beat-to-beat SV. HR-, SV-, and VT-BRS gain were calculated for each task using cross-spectral analysis (Cooke et al., 1999). Transfer functions [TF(BP-RRI), TF(BP-SV), and TF(BP-PTT)] were calculated with systolic BP as the input and RRI, SV, or PTT as the outputs. HR-, SV-, and VT-BRS gain were assessed as average values of TF(BP-RRI), TF(BP-SV), and TF(BP-PTT), respectively, in frequency ranges where BP-RRI, BP-SV, and BP-PTT coherence was >0.5. HR-, SV-, and VT-BRS gain were calculated separately in the low (LF; 0.005–0.15 Hz) and high (HF; 0.15–0.5 Hz) frequency ranges.
Statistical Analysis
The mean and standard deviation of cardiovascular parameters, including BRS gain measures in both the LF and HF ranges, were calculated for each task (BL, 6P, NG). Paired t tests were used to compare parameter values at BL and in response to stimulation tasks (6P and NG). Correlations between HR-, SV-, and VT-BRS gain were also evaluated.
Results
Physiological stimulation (6P task) increased HR- and VT-BRS gain in the LF range as well as HR, diastolic arterial pressure (DAP), and variability in all measured cardiovascular functions (Table 1). Emotional stimulation (NG task) decreased HR-BRS gain in the HF range and increased systolic arterial pressure (SAP) and DAP. During BL and NG tasks, VT- and HR- BRS gain were correlated in the LF and HF ranges. During 6P task, VT- and HR-BRS gain were correlated in the LF range, and SV-BRS gain was correlated with HR-BRS gain in the HF range and with VT-BRS in both the HF and LF ranges. Figure 2 illustrates the procedure used for computing BRS gain.
Table 1.
Cardiovascular responding during a low-cognitive demand baseline task (BL), a physiologically-activating paced breathing task (6P), and an emotionally-activating task (NG) averaged across 31 participants.
| Cardiovascular parameters | Tasks
|
|||
|---|---|---|---|---|
| BL | NG | 6P | ||
| SAPa | mmHg | 118.27 ± 2.26 | 125.57 ± 3.04** | 120.05 ± 2.55 |
| SAP Variabilitya | mmHg | 5.35 ± 0.32 | 4.90 ± 0.29 | 7.52 ± 0.31** |
| DAPa | mmHg | 59.18 ± 1.43 | 65.12 ± 2.13** | 61.71 ± 1.92** |
| DAP Variabilitya | mmHg | 3.15 ± 0.16 | 3.14 ± 0.13 | 4.92 ± 0.35** |
| HRa | Beats/min | 69.61 ± 1.69 | 71.23 ± 2.00 | 72.36 ± 1.62** |
| HR Variabilitya | Beats/min | 5.69 ± 0.57 | 5.52 ± 0.30 | 9.44 ± 0.46** |
| PTTa | Ms | 291.20 ± 4.41 | 291.90 ± 4.81 | 294.77 ± 4.18 |
| PTT Variabilitya | Ms | 6.05 ± 0.33 | 6.01 ± 0.31 | 8.99 ± 0.48** |
| SVa | Ml | 71.90 ± 2.40 | 71.24 ± 3.05 | 71.17 ± 2.38 |
| SV Variability a | Ml | 7.18 ± 0.56 | 6.40 ± 0.46 | 8.92 ± 0.52** |
| HR-BRS Gain (LF)a | ms/mmHg | 15.10 ± 1.23 | 15.30 ± 1.60 | 17.95 ± 1.36** |
| HR-BRS Gain (HF)a | ms/mmHg | 24.93 ± 3.10 | 21.75 ± 2.65** | 29.76 ± 3.79 |
| VT-BRS Gain (LF)a | ms/mmHg | 0.74 ± 0.05 | 0.81 ± 0.05 | 0.94 ± 0.05** |
| VT-BRS Gain (HF)a | ms/mmHg | 1.81 ± 0.11 | 1.94 ± 0.10 | 1.55 ± 0.17 |
| SV-BRS Gain (LF)a | ml/mmHg | 1.01 ± 0.10 | 0.88 ± 0.10 | 1.07 ± 0.10 |
| SV-BRS Gain (HF)a | ml/mmHg | 2.45 ± 0.16 | 2.24 ± 0.16 | 2.57 ± 0.20 |
| Correlation in LF range | ||||
| HR-BRS Gain x VT-BRS Gainb | 0.40* | 0.68 ** | 0.45 * | |
| HR-BRS Gain x SV-BRS Gainb | 0.06 | 0.21 | −0.03 | |
| SV-BRS Gain x VT-BRS Gainb | 0.24 | 0.17 | 0.35 † | |
| Correlation in HF range | ||||
| HR-BRS Gain x VT-BRS Gainb | 0.76 ** | 0.50 ** | 0.14 | |
| HR-BRS Gain x SV-BRS Gainb | 0.11 | 0.13 | 0.40* | |
| SV-BRS Gain x VT-BRS Gainb | 0.03 | 0.30 | 0.35 † | |
Note:
mean ± standard deviation, significance denotes change from BL.
Pearson correlation coefficients. SAP and DAP – systolic and diastolic arterial pressure. HR – heart rate. PTT – pulse transit time. SV – stroke volume. BRS – baroreflex system. HF – high frequency range. LF – low frequency range.
p < .01;
p < .05;
p < .06 (trend).
Figure 2.

Physiological data used to calculate HR-, SV-, and VT-BRS gain. (A) Systolic arterial pressure (SAP) as a measure of blood pressure (BP), R-to-R wave of the ECG (RRI), stroke volume (SV), and pulse transit time (PTT) recordings from one participant during the baseline (BL) task (left) and the corresponding spectra (right); (B) BP-RRI, BP-SV, and BP-PTT transfer functions (top panels), coherences (middle panels), and phases (lower panels).
Discussion
The primary goal of the study was to develop a methodology for assessing VT-BRS and SV-BRS gain based on the commonly used and well-established cross-spectral method for calculating HR-BRS gain. As “proof of concept,” HR-, VT-, and SV-BRS gain were assessed in response to physiological and emotional stimulation tasks. Although actual gain calculations were not validated and the mechanisms that control BRS sensitivity were not examined, the experiments in this study provide initial evidence for the feasibility and utility of the methodological approach.
The use of the cross-spectral technique for BRS gain assessment presupposes a model wherein HR, SV, and VT oscillations occur only in response to oscillations in BP and thus assumes that BP-RRI, BP-SV, and BP-PTT TFs precisely capture the dynamics of the interrelationship between the functions. However, spontaneous HR, SV, and VT oscillations depend only in part on BP oscillation; many additional factors (e.g., respiration, physical/mental loading, emotions) influence these parameters, potentially confounding cross-spectral BRS gain assessment (Vallais, Baselli, Lucini, Pagani, & Porta, 2009). To offset this concern, we assessed BP-RRI, BP-SV, and BP-PTT coherence and carefully selected frequency ranges where the influence of BP on RRI, SV, or PTT predominated. It should be noted as well that unlike HR and SV, which are influenced by BP only through the BRS, BP influences VT via BRS and by directly affecting vessel walls. This fact does not undermine the principle of VT-BRS gain assessment, but suggests the need for considering dissimilarities between the BRS arches when interpreting results.
PTT was used as an index of beat-to-beat changes in VT; however, both PTT and pulse wave velocity (PWV) are noninvasive, physiological measurements that reflect changes in peripheral vascular resistance (Schwartz, 2009) and provide an indication of arterial wall elasticity (Naka, Tweddel, Doshi, Goodfellow, & Henderson, 2006; Smith, Argod, Pepin, & Levy, 1999). PTT was selected because it relates to PWV as RRI does to HR. Thus, the use of PTT for VT-BRS gain measurement is analogous to the use of RRI for HR-BRS gain assessment.
The methodology appears appropriate for simultaneous assessment of multiple BRS arches in healthy young individuals with intact BRS functioning. In addition, the methodology appears to capture changes in BRS gain in different arches under different loadings. That is, when the cardiovascular system of young healthy individuals was stimulated with a paced breathing task, gain in the HR- and VT-BRS (in the LF range) was enhanced. This was not observed during emotional picture viewing. It is notable that emotional loading was also insufficient for changing variability in BP, HR, SV, or VT (Table 1). These findings illustrate that it is possible to simultaneously measure the sensitivity of all three BRS arches.
The results support overlap and independence in the functions of the BRS arches. System redundancy is expected due to the critical importance of maintaining BRS functioning; in the case of disease states (e.g., that compromise the elasticity of blood vessels), short-term BP can still be regulated (albeit suboptimally) to protect the body and brain and maintain communication between the autonomic nervous system (ANS) and CNS. BRS arch independence and nonredundancy is expected due to the multiple unique resonance frequencies noted in the arterial BRS and various distinct aspects of physiological reactivity observed in the cardiovascular system. Evidence for functional overlap is provided by the significantly higher HR-, VT-, and SV-BRS gain in the HF versus LF range; gain in all reflex arches is dependent on baroreceptor sensitivity, which is controlled by the speed, not amount, of BP change (Mancia & Mark, 1983). Based on the correlational analyses, we speculate that the consistent relationship between HR- and VT-BRS gain suggests interdependence of these functions. We also speculate that the much weaker relations between these BRS arches and the SV-BRS arch implies functional independence, which may be due to a relative insensitivity of SV to the modest BP shifts generated by our tasks. More robust shifts in BP, such as those induced during upright tilt, may be necessary to change SV-BRS gain (Yasumasu, Abe, Oginosawa, Takahara, & Nakashima, 2005). These results support the utility of our methodological approach and suggest the need for future research aimed at characterizing the unique contributions of each BRS arch to health and mechanistic underpinnings that control changes in BRS sensitivity.
Conclusion
This study introduces a methodology for estimating gain in multiple arches of the intact BRS system. This methodology will allow comprehensive assessment of the arterial BRS and thereby add to our understanding of the mechanisms of short-time BP control, origination of cardiovascular variability, and contributions of the BRS to the cognitive-emotional processes that occur in parallel with BP modulation. Moreover, the ability to measure HR-, VT-, and SV-BRS gain independently may prove useful for developing new tools to evaluate, diagnose, and possibly treat a variety of cardiovascular diseases. For example, it is plausible that measurement of VT-BRS gain may reveal arteriosclerotic processes earlier in the disease course than HR-BRS. Similarly, SV-BRS gain may be useful for the evaluation of myocarditis. Additional studies in other samples with and without cardiovascular disease are needed to validate these initial findings, assess the mechanisms that support BRS modification, and more fully capture the clinical utility of simultaneous BRS arch gain measurement
Acknowledgments
This study was supported in part by NIAAA through HHSN275201000003C, R01 AA015248, ARRA Administrative Supplement to R01 AA015248, K02 AA00325, and K01 AA017473.
References
- Aljuri N, Cohen RJ. Theoretical considerations in the dynamic closed-loop baroreflex and autoregulatory control of total peripheral resistance. American Journal of Physiology: Heart and Circulatory Physiology. 2004;287:H2252–H2273. doi: 10.1152/ajpheart.00489.2003. [DOI] [PubMed] [Google Scholar]
- Aljuri N, Marini R, Richard J, Cohen RJ. Test of dynamic closed-loop baroreflex and autoregulatory control of total peripheral resistance in intact and conscious sheep. American Journal of Physiology: Heart and Circulatory Physiology. 2004;287:H2274–H2286. doi: 10.1152/ajpheart.00490.2003. [DOI] [PubMed] [Google Scholar]
- Benarroch EE. Central autonomic network: Functional organization and clinical correlations. Armonk, NY: Futura Publishing; 1997. [Google Scholar]
- Bogert LWJ, van Lieshout JJ. Non-invasive pulsatile arterial pressure and stroke volume changes from the human finger. Experimental Physiology. 2005;90(4):437–446. doi: 10.1113/expphysiol.2005.030262. [DOI] [PubMed] [Google Scholar]
- Casadei B, Meyer TE, Coats AJS, Conway J, Sleight P. Baroreflex control of stroke volume in man: An effect mediated by the vagus. Journal of Physiology. 1992;448:539–550. doi: 10.1113/jphysiol.1992.sp019056. [DOI] [PMC free article] [PubMed] [Google Scholar]
- Cooke WH, Hoag JB, Crossman AA, Kuusela TA, Tahvanainen KU, Eckberg DL. Human responses to upright tilt: a window on central autonomic integration. Journal of Physiology. 1999;517:617–628. doi: 10.1111/j.1469-7793.1999.0617t.x. [DOI] [PMC free article] [PubMed] [Google Scholar]
- Lacey BC, Lacey JI. Some autonomic-central nervous system interrelationships. In: Blank P, editor. Physiological Correlations of Emotion. New York, NY: Academic Press; 1970. pp. 205–227. [Google Scholar]
- Lehrer PM, Vaschillo E, Vaschillo B, Lu SE, Eckberg DL, Edelberg R. Heart rate variability biofeedback increases baroreflex gain and peak expiratory flow. Psychosomatic Medicine. 2003;65(5):796–805. doi: 10.1097/01.psy.0000089200.81962.19. [DOI] [PubMed] [Google Scholar]
- Mancia G, Mark AL. Arterial baroreflexes in humans. In: Shepherd JT, Abboud FM, editors. Handbook of Physiology, Cardiovascular System IV. Bethesda, MD: American Physiologic Society; 1983. pp. 755–793. [Google Scholar]
- Naka KK, Tweddel AC, Doshi SN, Goodfellow J, Henderson AH. Flow-mediated changes in pulse wave velocity: a new clinical measure of endothelial function. European Heart Journal. 2006;27(3):302–309. doi: 10.1093/eurheartj/ehi619. [DOI] [PubMed] [Google Scholar]
- Reyes del Paso GA, Gonzalez I, Hernandez JA. Baroreceptor sensitivity and effectiveness varies differentially as a function of cognitive-attentional demands. Biological Psychology. 2004;67(3):385–395. doi: 10.1016/j.biopsycho.2004.02.001. [DOI] [PubMed] [Google Scholar]
- Reyes Del Paso GA, Gonzalez MI, Hernandez JA, Duschek S, Gutierrez N. Tonic blood pressure modulates the relationship between baroreceptor cardiac reflex sensitivity and cognitive performance. Psychophysiology. 2009;46(5):932–938. doi: 10.1111/j.1469-8986.2009.00832.x. [DOI] [PubMed] [Google Scholar]
- Schwartz D. The pulse transit time arousal index in obstructive sleep apnea before and after CPAP. Sleep Medicine. 2009;6(3):199–203. doi: 10.1016/j.sleep.2004.12.009. [DOI] [PubMed] [Google Scholar]
- Smith RP, Argod J, Pepin JL, Levy PA. Pulse transit time: an appraisal of potential clinical applications. Thorax. 1999;54(5):452–457. doi: 10.1136/thx.54.5.452. [DOI] [PMC free article] [PubMed] [Google Scholar]
- Smyth HS, Sleight P, Pickering GW. Reflex regulation of arterial pressure during sleep in man: A quantitative method of assessing baroreflex sensitivity. Circulation Research. 1969;24:109–121. doi: 10.1161/01.res.24.1.109. [DOI] [PubMed] [Google Scholar]
- Thayer JF, Lane RD. A model of neurovisceral integration in emotion regulation and dysregulation. Journal of Affective Disorders. 2000;61(3):201–216. doi: 10.1016/s0165-0327(00)00338-4. [DOI] [PubMed] [Google Scholar]
- Vallais F, Baselli G, Lucini D, Pagani M, Porta A. Spontaneous baroreflex sensitivity estimates during graded bicycle exercise: a comparative study. Physiological Measurement. 2009;30:201–213. doi: 10.1088/0967-3334/30/2/007. [DOI] [PubMed] [Google Scholar]
- van de Vooren H, Gademan MG, Swenne CA, TenVoorde BJ, Schalij MJ, Van der Wall EE. Baroreflex sensitivity, blood pressure buffering, and resonance: what are the links? Computer simulation of healthy subjects and heart failure patients. Journal of Applied Physiology. 2007;102(4):1348–1356. doi: 10.1152/japplphysiol.00158.2006. [DOI] [PubMed] [Google Scholar]
- Vaschillo EG, Vaschillo B, Buckman JF, Pandina RJ, Bates ME. The investigation and clinical significance of resonance in the heart rate and vascular tone baroreflexes. In: Fred A, Filipe J, Gamboa H, editors. Biomedical Engineering Systems and Technologies: Communications in Computer and Information Science. Part 4. Vol. 127. Heidelberg, Germany: Springer; 2011. pp. 224–237. [Google Scholar]
- Yambe T, Sugita N, Yoshizawa M. Development of new quantitative diagnosis machine to evaluate the baroreflex sensitivity of an artery for patients with hypertension. IEEE Engineering in Medicine and Biology Society Conference Proceedings. 2009;2009:888–891. doi: 10.1109/IEMBS.2009.5332644. [DOI] [PubMed] [Google Scholar]
- Yasumasu T, Reyes Del Paso GA, Takahara K, Nakashima Y. Reduced baroreflex cardiac sensitivity predicts increased cognitive performance. Psychophysiology. 2006;43(1):41–45. doi: 10.1111/j.1469-8986.2006.00377.x. [DOI] [PubMed] [Google Scholar]
- Yasumasu T, Abe H, Oginosawa Y, Takahara K, Nakashima Y. Assessment of cardiac baroreflex function during fixed atrioventricular pacing using baroreceptor-stroke volume reflex sensitivity. Journal of Cardiovascular Electrophysiology. 2005;16:727–731. doi: 10.1111/j.1540-8167.2005.40767.x. [DOI] [PubMed] [Google Scholar]