Abstract
Background
Anodal stimulation hyperpolarizes cell membrane and increases intracellular Ca2+ (Cai) transient. This study tested the hypothesis that The maximum slope of Cai decline (–(dCai/dt)max) corresponds to the timing of anodal dip on the strength-interval curve and the initiation of repetitive responses and ventricular fibrillation (VF) after a premature stimulus (S2).
Methods and Results
We simultaneously mapped membrane potential (Vm) and Cai in 23 rabbit ventricles. A dip was observed on the anodal strength-interval curve. During the anodal dip, ventricles were captured by anodal break excitation directly under the S2 electrode. The Cai following anodal stimuli is larger than that following cathodal stimuli. The S1-S2 intervals of the anodal dip (203 ± 10 ms) coincided with the -(dCai/dt)max (199 ± 10 ms, p=NS). BAPTA-AM (n=3), INCX inhibition by low extracellular Na+ (n=3), and combined ryanodine and thapsigargin infusion (n=2) eliminated the anodal supernormality. Strong S2 during the relative refractory period (n=5) induced 29 repetitive responses and 10 VF episodes. The interval between S2 and the first non-driven beat was coincidental with the time of -(dCai/dt)max.
Conclusions
Larger Cai transient and INCX activation induced by anodal stimulation produces anodal supernormality. Time of maximum INCX activation is coincidental to the induction of non- driven beats from the Cai sinkhole after a strong premature stimulation.
Keywords: anodal dip, anodal stimulus, intracellular calcium, Na+-Ca2+ exchanger current
Introduction
The heart can be excited by either cathodal or anodal stimulation. The anodal threshold is higher than the cathodal threshold during late diastole.1–3 As the S1-S2 intervals progressively shortens, the anodal threshold increases, then decreases, and then increases again during the relative refractory period (RRP) until the effective refractory period (ERP) is reached. The S1-S2 coupling interval associated with a transient reduction of anodal threshold is referred to as an anodal dip in the strength-interval (SI) curve.4 The anodal dip is also termed anodal supernormality, as the capturing threshold is less than expected for that S1-S2 coupling. Anodal dip may potentiate therisk of anodal pacing–induced ventricular fibrillation.4 The absolute threshold values, however, may be either lower or higher than the diastolic threshold. A dip in SI curve is not observed during cathodal stimulation. We hypothesize that electrogenic Na+-Ca2+ exchanger current (INCX), which progressively increases as membrane potential becomes more negative during repolarization, contributes to the occurrence of anodal dip in the SI curve. Because the timing of the anodal dip roughly corresponds to the vulnerable period of cardiac cycle,4 we hypothesize that INCX activation also contributes to the mechanisms of ventricular vulnerability. While it is not feasible to measure real time INCX changes in intact ventricles, previous studies 5, 6 indicated that the rate of Cai decline (-dCai/dt) correlated well with measured INCX. Therefore, the -(dCai/dt)max is used as an estimate of the timing of the maximum Ca removal from NCX (peak INCX) during phase 3 repolarization.
If INCX activation is important in the anodal dip on the SI curve, then the timing of the anodal dip should be coincidental with the -(dCai/dt)max. Similarly, if INCX activation is important in ventricular vulnerability, then the first non-driven beat that initiates repetitive responses or VF should also occur at the time of -(dCai/dt)max. We performed simultaneous membrane potential (Vm) and Cai mapping in rabbit ventricles to test these hypotheses.
Methods
Langendorff-Perfused Rabbit Heart
This study protocol was approved by the Institutional Animal Care and Use Committee of Indiana University School of Medicine and the Methodist Research Institute, and conforms to the guidelines of the American Heart Association. We used 23 normal New Zealand white rabbits (3 to 5 kg). The rabbits were anesthetized with ketamine and xylazine. The chests were opened via medium sternotomy and the hearts were rapidly excised and immersed in cold Tyrode’s solution (composition in mmol/L: 125 NaCl, 4.5 KCl, 0.25 MgCl2, 24 NaHCO3, 1.8 NaH2PO4, 1.8 CaCl2, and 5.5 glucose). The ascending aorta was immediately cannulated and perfused with 37°C Tyrode’s solution equilibrated with 95% O2 and 5% CO2 to maintain a pH of 7.4. Coronary perfusion pressure was regulated between 80 and 95 mm Hg. Two widely spaced bipolar electrodes were used for continuous pseudo-ECG monitoring. Duringoptical recordings, contractility was inhibited by 10–17 μmol/L of blebbistatin.7
Dual Vm and Cai Recordings
We used 0.5 mg of Rhod-2 AM (Molecular Probes) dissolved in 1 mL of dimethylsulfoxide containing Pluronic F-127 (20% wt/vol) to stain Cai. This solution was diluted in 300 ml of Tyrode’s solution to achieve a final Rhod-2 concentration of 1.48 μmol/L. It was infused into the heart over a 10 min period. The heart was then stained again by direct injection of voltage sensitive dye (RH237, Molecular Probes) into the perfusion system. The double-stained heart was excited with laser light at 532 nm.8 Fluorescence was collected using 2 cameras (MiCAM Ultima, BrainVision, Tokyo, Japan) at 2 ms/frame and 100X100 pixels with spatial resolution of 0.35x0.35 mm2/pixel. The fluorescence induced by the laser illumination was obtained through a common lens, separated with a dichroic mirror (650 nm cutoff wavelength), and directed to the respective camera with additional filtering (715 nm long pass for Vm and 580 ± 20 nm for Cai).
Experimental Protocol
S1 and S2 were performed with 2 unipolar pacing electrodes (diameter 1.0 mm) on the left ventricle along the fiber direction. A left ventricular patch electrode was used as a reference electrode. The distance of 2 unipolar pacing electrodes was within 5 mm. The electrode closer to the base of left ventricle was used for the S1, and the other electrode on the anterior wall of left ventricle for S2. The S1 was cathodal with 6 ms pulse duration and twice diastolic threshold current. The S1 pacing protocol consisted of an initial drive cycle of eight stimuli at a cycle length of 350 ms to overdrive the intrinsic heart rate. S2 pulse duration was 6 ms for both cathodal and anodal polarities. Both S1 and S2 were delivered using a constant current stimulus isolator (A385, World Precision Instruments, Sarasota, FL). The pacing was initiated at S1-S2 interval of 250 ms with S2 stimulus strength of 0.1 mA. The strength of S2 was then gradually increased at 0.1 mA steps until it reached 1 mA, then at 0.5 mA steps until the stimulus captured the ventricles. At each S1-S2 interval, anodal and cathodal thresholds were determined by alternating the S2 polarity. The S1-S2 interval was then progressively decreased at 10 ms steps and the same procedure was repeated until the SI curves were determined for both the anodal and the cathodal stimuli (Figure 1A).
Figure 1.
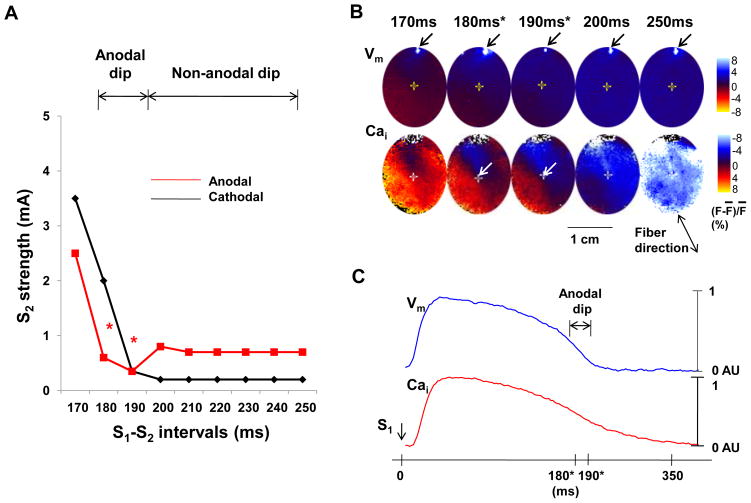
Vm and Cai of the SI curve. A, SI curve of anodal and cathodal stimulation. The anodal threshold during anodal dip of 180–190 ms (asterisk) was lower than that of longer S1-S2 interval (non-anodal dip). B, Optical snapshots of Vm and Cai at the initiation of the S2. The S2 was located on the border zone between high (red) and low (blue) Cai during anodal dip (arrows). S1 induced planar wave propagated from the upper left to lower right. The S2 sites were indicated with the cross mark. The numbers above optical snapshots indicate the S1-S2 coupling interval. The white spot in each Vm snapshot was produced by the flash of a LED lamp used to document the timing of the S2. C, Vm and Cai tracings recorded at the S2 (the cross mark in B) during S1 pacing of 350ms. Note that the S2 occurred at the junction between red and blue areas during the anodal dip (180 ms and 190 ms), indicating that the anodal dip occurred at sites with rapidly changing Cai.
In the first 14 hearts, the S1-S2 coupling interval associated with a transient reduction of anodal threshold was defined as an anodal dip in the SI curve. The period of non-anodal dip was defined by the S1-S2 intervals longer than the S1-S2 intervals comprising the anodal dip (Figure 1A). There was a 5-s to 10-s interval between pacing to allow adjustment of the S2 strength. The RRP is the period (coupling intervals) associated with increased S2 threshold. After the SI curves were determined, we delivered the S2 during the RRP and progressively increased the strength of S2 at 5 mA step until it reached 30 mA. The time of S2 was marked by a light-emitting diode (LED) lamp, which was positioned in the mapped field. The same stimulator signal that triggered an S2 pulse was used to trigger the LED lamp. The light artifact (black arrows on Vm optical map in Figure 1B) was used to document the timing of the S2. We used BAPTA-AM (20 μmol/L) to chelate the Cai in 3 hearts.9, 10 In additional 9 hearts, we performed the following interventions: (a) acute INCX blockade by rapidly substituting the Na+ in the perfusate by Li+ (n=3),11, 12 (b) adding thapsigargin (3 μmol/L, n=3), ryanodine (10 μmol/L, n=1), or combined ryanodine and thapsigargin infusion (n=2). The SI curves were determined before and after these pharmacological interventions.
Data Analyses
The Cai and Vm traces were normalized to their respective peak-to-peak amplitude for comparison of timing and morphology (Figure 2A). Latencies were measured from the initiation of S2 pulse (time zero) to the takeoff of Vm and Cai. To analyze the relationship between the anodal dip, the vulnerable period and Cai removal, we determined -(dCai/dt)max in the Cai transient tracing (black arrow, Figure 3D). Data are presented as mean ± SEM. Paired t tests were used to compare the time of -(dCai/dt)max and the mean anodal dip period for each heart studied. A p value of < 0.05 was considered statistically significant.
Figure 2.
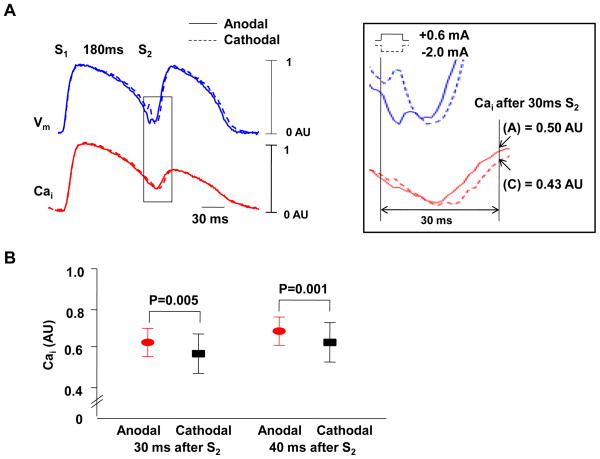
Cai elevation after anodal and cathodal S2. A, 0.6 mA anodal and 2.0 mA cathodal stimuli during anodal dip (S1-S2 interval of 180 ms). The boxed region was magnified to show that the Cai level is higher after anodal (A) than cathodal (C) stimulus. The cathodal stimulus is followed by immediate depolarization (broken red arrow) while the anodal stimulus resulted in hyperpolarization followed by depolarization (solid red arrow). Because there was a 6 ms pulse width, the break excitation of the anodal stimulus excites the tissue during a more recovered phase of the action potential, leading to shorter stimulus-response latency and earlier rise of phase 0 than the make excitation associated with cathodal stimulus.B, Cai 30 ms and 40 ms after S2. The Cai transient measured 30 ms and 40 ms after anodal S2 was significantly higher than that of cathodal stimulus (P=0.005 and 0.001, respectively).
Figure 3.
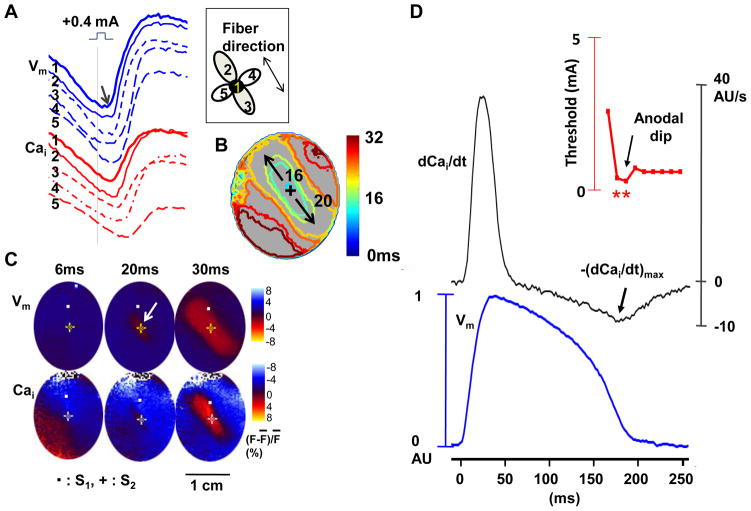
The anodal-break excitation and role of Cai removal during anodal dip. A through C show a typical example of anode-break excitation originating from the stimulation site itself during anodal stimulus of 0.4 mA at the anodal dip period (S1-S2 interval of 190 ms). A, Vm and Cai tracings from S2 site (site 1) and surrounding 4 sites (sites 2–5). B, Vm isochronal map with times of activation (in ms) marked on selected isochrones, with the onset of S2 as time zero. C, Corresponding Vm and Cai fluorescence snapshots. Note that the excitation started from the site of S2 (arrow) and propagated faster along the fiber direction than across the fiber direction. D, The anodal SI curve (upper panel), dCai/dt (middle panel) and simultaneous Vm traces (lower panel) for S1-paced beats at the S2 site. The dCai/dt values were the highest during phase 1 and the lowest during the phase 3 of the action potential. –(dCai/dt)max (arrow) occurred when S1-S2 coupling interval was 180 ms, which was during the anodal dip on the SI curve.
Results
Anodal Dip and the SI curve
Figure 1A shows a typical example of anodal and cathodal SI curve. The anodal threshold had a dip when S1-S2 intervals were at 180 ms and 190 ms (red asterisks in Figure 1A). In this ventricle, the mean anodal threshold during the anodal dip (0.48 ± 0.1 mA) was less than the anodal threshold associated with longer S1-S2 intervals (0.72 ± 0.04 mA). For all 14 hearts studied, the anodal dip was located at a mean S1-S2 interval of 203 ± 10 ms. During this period, the anodal threshold (0.46 ± 0.30 mA) was significantly lower than cathodal one (0.79 ± 0.80 mA, p=0.04). Figure 1B shows the Vm and Cai optical ratio map snapshots at the time of S2 delivery at different S1-S2 intervals. During anodal dip of 180 ms and 190 ms, the S2 sites (arrows) were located near the area of largest Cai gradient, which was typically surrounded by areas of high Cai (red) and low Cai (blue) (supplementary Figure 1s). This finding indicates that reduced anodal S2 capturing threshold occurred to the cells with rapidly declining Cai. In contrast, the S2 given outside the anodal dip period was associated with a uniformly low Cai (blue color in Cai maps at 200–250 ms S1-S2 intervals in Figure 1B). Figure 1C shows the Vm and Cai tracings recorded from the S2 site (cross mark in Figure 1B) during S1 pacing interval of 350 ms. These tracings also show that the anodal dip coincided with the rapidly declining Cai and Vm.
Differential Effects of Anodal and Cathodal Stimulation on Cai Elevation
We assigned the peak and lowest Vm fluorescence level of the last S1 paced beat as 1 and 0 arbitrary unit (AU), respectively. The anodal S2 given during the anodal dip results in more Vm hyperpolarization (0.035 ± 0.04 AU) than the cathodal S2 (0.072 ± 0.055 AU, p=0.001). We assigned the peak Cai fluorescence level of the last S1 paced beat as 1 AU. The Cai levels measured 30 ms after anodal and cathodal S2 were 0.50 AU and 0.43 AU, respectively (Figure 2A). In all anodal dips studied (n=20), the Cai levels 30 ms after anodal stimuli were significantly higher than cathodal ones (0.63 ± 0.16 AU vs. 0.58 ± 0.19 AU, p=0.005). The Cai level 40 ms after anodal stimulus was also significantly higher than cathodal one (0.72 ± 0.14 AU vs. 0.68 ± 0.16 AU, p=0.001, Figure 2B). These findings reproduced the results of a previous report,13 and support the notion that there are differential effects of anodal and cathodal stimulation on Cai transients.
The Anode-Break Excitation During Anodal Dip
For S1-S2 interval longer than that associated with anodal dip, the mode of excitation was anodal break (n=14). We next verified that the mode of excitation during anodal dip was anodal-break excitation. Figure 3 shows the anode-break excitation with anodal stimulus of 0.4 mA during the dip (S1-S2 interval of 190 ms). The earliest excitation started directly from the S2 site (site 1) at the trailing edge of anodal stimulus (arrow, Figure 3A), compatible with break excitation. Figure 3B shows an isochronal map with times of activation (in ms) marked on selected isochrones, with the onset of S2 as time zero. Figure 3C shows corresponding Vm and Cai fluorescence snapshots, showing that excitation started from the S2 site (arrow) and propagated faster along the fiber direction than across the fiber direction. This finding of anodal break excitation was consistently observed during the anodal dip in all hearts studied.
Maximum Rate of Cai Removal and the Anodal Dip
We differentiated the Cai transient trace to measure dCai/dt at the S2 site. Figure 3D shows the dCai/dt curve and Vm traces for S1-paced beats at the S2 site. The dCai/dt values were the highest during phase 1 and the lowest during the phase 3 of the action potential. - (dCai/dt)max (arrow) occurred when S1-S2 coupling interval was 180 ms, which was during the anodal dip in this heart.
For all hearts studied (n=14), -(dCai/dt)max occurred an average of 199 ± 10 ms after the S2, which coincided with the average time of anodal dip (203 ± 10 ms after S2, p=0.09, supplementary Figure 2s). In all hearts studied, the anodal threshold during the dip was 0.28 ± 0.14 mA. The anodal threshold with longer S1-S2 coupling intervals was 0.34 ± 0.20 mA.
The Effects of Calcium Chelating Agent on Anodal Dip
To explore further the relationship between anodal dip and the Cai transient, we compared SI curves before and during BAPTA-AM infusion. In normal hearts, the Cai transient maintained from 0.97 ± 0.02 AU to 0.95 ± 0.03 AU (− 2 %, n=7, p=0.34) after the 1 hour of study. In contrast, the Cai transient decreased from 0.97 ± 0.02 AU to 0.70 ± 0.06 AU (− 28 %, n=3, p=0.001) 1 hour after BAPTA-AM infusion (Figure 3s). Figure 4A shows the changes of SI curves from baseline (broken lines) and after >1 hr BAPTA-AM infusion (solid lines). In all 3 hearts studied, BAPTA-AM abolished the anodal dip (Figure 4s). The anodal ERPs at baseline and during BAPTA-AM infusion were 170 ± 10 ms and 167 ± 21 ms, respectively (p=0.74). After BAPTA-AM infusion, it was not easy to find the –dCai/dt max (Figure 4B).
Figure 4.
The effect of BAPTA-AM on the anodal SI curve. A, The SI curve before (broken lines) and after (solid lines) BAPTA-AM (20 μmol/L) infusion. B, The anodal SI curve and dCai/dt after BAPTA-AM infusion. The anodal dip was eliminated by BAPTA-AM infusion in all ventricles.
The Effects of INCX block and SR Calcium Handling on Anodal Dip
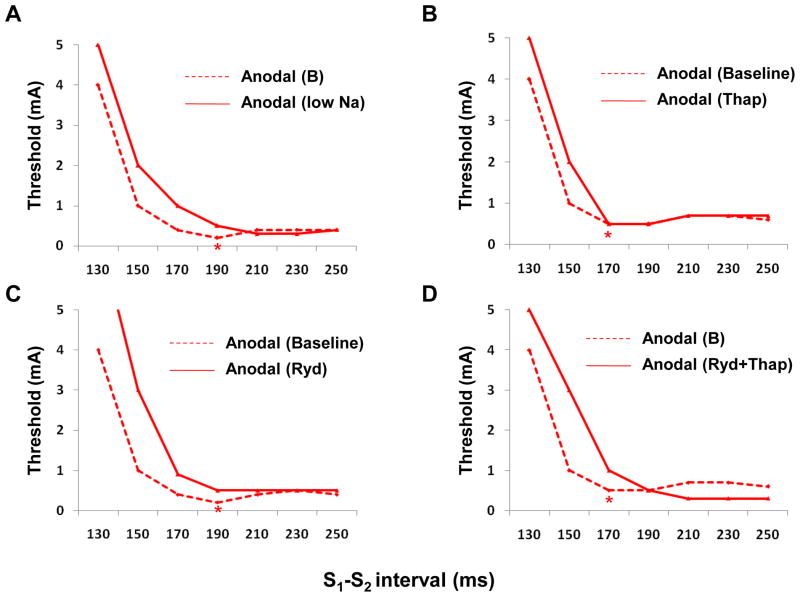
To block INCX,11, 12 rapidly substituting the Na+ in the perfusate by Li+ was used in 3 hearts. Anodal dip disappeared after blocking INCX (Figure 5A). Thapsigargin infusion, which blocks SR calcium uptake, did not change the timing of anodal dip (Figure 5B). The S1-S2 coupling interval associated with anodal dips was 182 ± 19 ms before and 183 ± 12 ms after the addition of thapsigargin (P=0.74). However, ryanodine (SR Ca release block, Figure 5C)) or combined ryanodine and thapsigargin infusion (Figure 5D) eliminated anodal dip.
Figure 5.
The anodal SI curves after other pharmacological interventions. A, Before (broken lines) and after (solid lines) infusion of low Na. Anodal dip disappeared after low Na. B, Thapsigargin (Thap, 3 μmol/L). C, Ryanodine (Ryd, 3 μmol/L). D, Ryanodine (3 μmol/L) and thapsigargin (3 μmol/L). Asterisks indicate anodal dip.
Maximum Rate of Cai Removal, Cai sinkhole and Ventricular Vulnerability
We mapped a total of 39 episodes of repetitive responses or VF induced by a single anodal stimulus. The stimulus strength was 20 ± 9 mA and the S1-S2 coupling intervals were 165 ± 16 ms. This coupling interval was significantly shorter than the coupling intervals associated with the anodal dip (p=0.001). In all 39 episodes with repetitive responses or VF, the timing of the Vm rise that initiated the repetitive response or VF was 123 ± 33 ms after S2, which was coincidental with the -(dCai/dt)max at that site (121 ± 34 ms, p=0.07). (Note that the – (dCai/dt)max in this case was measured on the S1 beats during stable pacing, not measured on the S2 beat.) The S1-S2 coupling interval of repetitive response was longer than that of VF (171 ± 15 ms, vs. 150 ± 9 ms, p=0.001). The level of S2 energy was not different between repetitive response and VF (19 ± 9 mA, vs. 25 ± 6 mA, p=0.08).
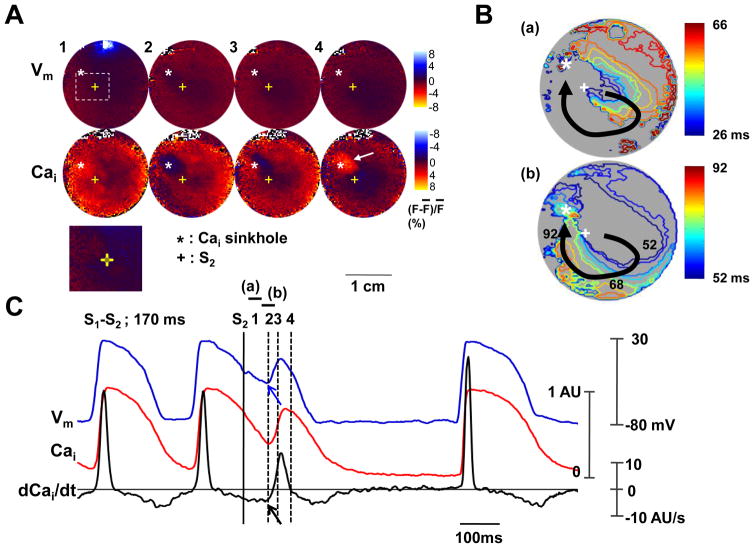
A Cai sinkhole 8, 13, 14 is a region with low (<50% of the average fluorescence) Cai surrounded by regions of normal or high Cai. On optical maps, the Cai sinkhole is a region of blue color surrounded by red color. Figure 6 shows the activation within the Cai sinkhole. A Cai sinkhole (asterisk, Panel A2) was observed 78 ms after the S2, at a site of virtual cathode. Panels A3-A4 show progressive Cai elevation that started from the left side of the sinkhole and filled the whole sinkhole area. This Cai elevation did not induce sufficient Vm changes to induce a propagated action potential. Figure 6B shows the activation map which ends at the sinkhole site. Figure 6C shows the optical signals and the dCai/dt at the Cai sinkhole. The onset of Vm (blue arrow) was coincidental with the –(dCai/dt)max (black arrow).
Figure 6.
The role of maximum Cai removal rate in Cai sinkhole and activation. The 10 mA anodal S2 during S1-S2 interval of 170 ms. A, Vm and Cai fluorescence snapshots. Note that Cai elevation starts from the margin of Cai sinkhole (asterisks) and propagates to the entire sinkhole (arrow). Lower panel is the magnified image of boxed region. B, Vm isochronal map with times of activation (in ms) marked on selected isochrones, with the onset of S2 as time zero. C, Vm tracing, Cai tracing and dCai/dt recorded from the Cai sinkhole.
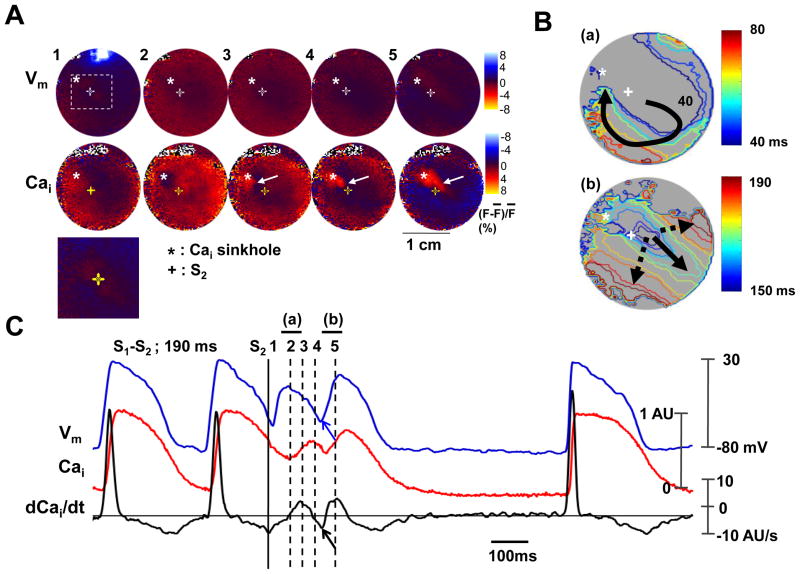
Figure 7 shows repetitive responses induced by a 10 mA anodal stimulus given with a S1-S2 interval of 190 ms. A Cai sinkhole (asterisk, Panel A2) was observed 60 ms after the S2, at a site of virtual cathode. Panels A3-A5 show progressive Cai elevation that started from the left side of the sinkhole and moved slowly towards the right side of the sinkhole (while arrows). In contrast to Figure 6, a wavefront, which was initiated at the Cai sinkhole at 106 ms after S2, propagated to the remainder of the mapped region (Figure 7B). Figure 7C shows the optical signals and the (dCai/dt)max at the Cai sinkhole. The onset of Vm (blue arrow) was coincidental with the -(dCai/dt)max (black arrow).
Figure 7.
The role of maximum Cai removal rate during repetitive beat. The 10 mA anodal S2 during the S1-S2 interval of 190 ms. A, Vm and Cai fluorescence snapshots. Note that Cai elevation starts from the Cai sinkhole (asterisks) and propagates slowly to other sites (arrow). Lower panel is the magnified image of boxed region. B, Vm isochronal map with times of activation (in ms) marked on selected isochrones, with the onset of S2 as time zero. C, Vm tracing, Cai tracing and dCai/dt recorded from the Cai sinkhole.
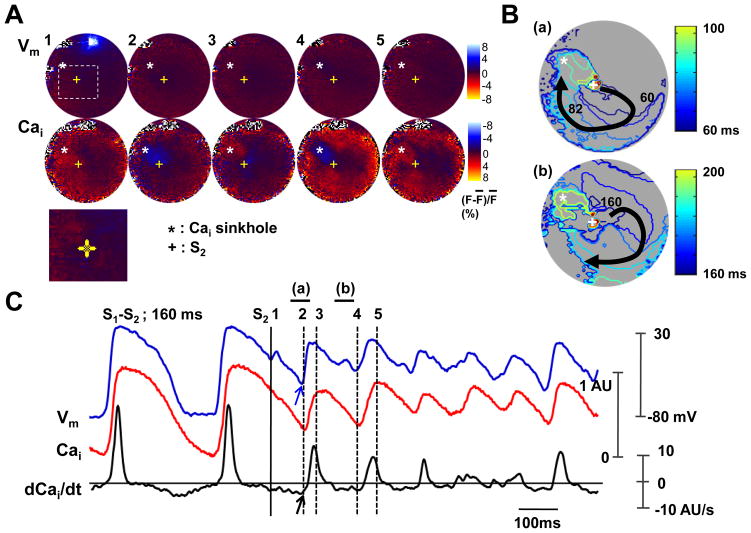
Figure 8 shows a typical example of VF induced by a S2. Figure 8A shows the Cai sinkhole (asterisk, Panel A2) produced by 30 mA anodal stimulus at the S1-S2 interval of 160 ms. There was also slow elevation of Cai that started from the left side of the sinkhole and propagated towards right side. There was then Vm elevation 105 ms after the S2. The wavefront then propagated away from that site (Figure 8B). Cai sinkhole was observed again at the same site (asterisk, panel A4). Figure 8C shows the optical signals and the (dCai/dt)max at the Cai sinkhole. The onset of Vm (blue arrow) was coincidental with the –(dCai/dt)max (black arrow).
Figure 8.
The role of maximum Cai removal rate during ventricular fibrillation induced by an anodal S2 (30 mA) given 160 ms after the last S1. A, Vm and Cai fluorescence snapshots. Note the Cai sinkhole (asterisk) and Cai elevation (arrow). Lower panel is the magnified image of boxed region. B, Vm isochronal map with times of activation (in ms) marked on selected isochrones, with the onset of S2 as time zero. C, Vm tracing, Cai tracing and dCai/dt recorded from the Cai sinkhole.
Discussion
Our study demonstrates that the anodal dip on the SI curve occurred coincidentally with the –(dCai/dt)max. Furthermore, the timing of the Vm rise that initiated the repetitive response or VF was also coincidental with the –(dCai/dt)max. These findings suggest that INCX activation most likely played a role in anodal dip of the strength-interval curve, and may have contributed to the induction of non-driven beats from the Cai sinkhole induced by a strong premature stimulation.
Pacemaker Current (If) and Anodal Excitation
Ranjan et al.15, 16 proposed that hyperpolarization-activated “funny” current (If) is responsible for anodal break excitation. However, hyperpolarization-activated cation channel mRNA expression was not observed in rabbit ventricle.17 Thus, additional mechanisms are needed to explain the mechanisms of anodal dip. Our data suggest that maximal INCX activation is the factor that determines the timing of anodal supernormality.
Effects of BAPTA-AM
A significant finding of this study relates to the abolition of anodal dip when the Cai transient was suppressed with BAPTA-AM. This observation highlights the importance of the Cai transient in sculpting the electrophysiological environment during late phase 3 to promote anodal dip. The anodal dip coincided with the maximum rate of Cai removal -(dCai/dt)max even after pretreatment with thapsigargin, which blocks the SR Ca2+ reuptake. Since previous studies 5, 6 have documented that inward current through INCX is maximal at –(dCai/dt)max, the stimulation of inward INCX by the combined effects of persistently elevated Cai and the progressively more negative membrane voltage during late phase 3 is likely to be a major factor antagonizing repolarization, and thereby decreasing the excitation threshold, during the anodal dip. The effects of BAPTA-AM strengthened this conclusion.
Ventricular Vulnerability to Fibrillation
Previous studies showed that strong S2 given during the RRP does not always induce repetitive responses or VF.4 Hayashi et al.13 simultaneously mapped Vm and Cai during a strong S2 given during the RRP. The authors found that the induction of a Cai sinkhole is essential for a strong S2 to induce repetitive responses or VF. However, the mechanism by which a Cai sinkhole triggers subsequent repetitive response is unclear. The present study documented that the timing of the (dCai/dt)max is coincidental with the onset of the first non-driven beat. These findings suggest that the INCX plays an important role in the initiation of the first repetitive beat. The participation of INCX in ventricular vulnerability suggests that triggered activity plays a role in the mechanisms of ventricular vulnerability. However, it is also possible that the availability of this electrogenic current lowered the depolarization threshold, allowing the surrounding wavefronts to reenter that site and cause an excitation. Therefore, the importance of INCX in ventricular vulnerability does not invalidate the idea that reentry underlies the mechanisms of ventricular vulnerability to S2 18–22
Relevance to the Mechanisms of Ventricular Defibrillation
Efimov et al.23–25 reported that a defibrillation shock can create virtual electrodes on the ventricles. These shock-induced virtual electrodes play important roles in the reinitiation of VF after a failed defibrillation shock. Hwang et al.8, 26 simultaneously mapped Vm and Cai after defibrillation shocks given during VF. They found that the postshock reinitiation of VF occurs from the Cai sinkhole, and that the reduced postshock Cai heterogeneity underlies the mechanisms by which biphasic waveform is superior to monophasic waveform in ventricular defibrillation. Based on the results of the present study, it is reasonable to hypothesize that these postshock virtual electrodes can cause differential Cai transients, with virtual anode sites generating larger Cai transients than at the virtual cathode sites.13, 27 Hwang et al.8 subsequently confirmed that there is postshock Cai heterogeneity after near-threshold defibrillation shocks. The first beat of postshock activation always occurs from the Cai sinkhole. The edge of the Cai sinkhole is a site with large spatial differences of Cai, a sign of increased INCX (Figure 1B). Consistent with the importance of increased INCX in generating first beat of postshock arrhythmias, the onset of Cai fluorescence preceded the onset of Vm at the first postshock activation sites.
Limitations
It is possible that intramural virtual cathodes exist and were not detected by our epicardial mapping techniques.28 This limitation applies primarily to stimuli at high current strength, whereas during anodal dip, the current strength is low. Pharmacologic agents such as BAPTA-AM and substituting the Na+ in the perfusate by Li+ are not completely selective, and nonspecific effects cannot be excluded. Using a World Instrument A385 stimulator (the same as in the present study), Nikolski et al. 29 reported that a cathodal overshoot at the end of the anodal pulse was responsible for the appearance of anodal break excitation, since addition of a diode in the stimulator circuit eliminated both the overshoot and the break excitation. The authors suggested that a half-cell surface potential at the pacing electrode metal-saline interface may influence the pacing currents during unipolar anodal cardiac stimulation, creating break-like activation. According to this hypothesis, an initial anodal pulse de-excites the cell, facilitating subsequent excitation by the cathodal overshoot. Therefore, the anodal break-like excitation has a lower threshold than the cathodal make excitation. While this cathodal overshoot hypothesis can potentially explain the anodal break excitation, its effects are present throughout the diastole and are not limited to a small window of opportunity in late phase 3. Therefore, the cathodal overshoot by itself is insufficient to explain the presence of an anodal dip. Finally, strong stimuli can cause membrane electroporation, which may contribute to arrhythmogenesis. This limitation does not apply to the data obtained with near threshold current. Whether or not it affects the non-driven beats after S2 is unclear.
Conclusion
Our study demonstrates that the anodal dip (supernormal) period results from a complex interplay of factors, among which the Cai transient plays a critical role by shaping the balance between depolarizing and repolarizing forces during late phase 3 to reduce the excitation threshold. Time of maximum INCX activation is also coincidental to the induction of non-driven beats from the Cai sinkhole after a strong premature stimulation, suggesting that INCX may play a role in ventricular vulnerability.
Acknowledgments
Names of grants: This study was supported in part by NIH Grants P01 HL78931, R01 HL78932, 71140, research grants (6-2009-0176, 7-2009-0583) of Yonsei University College of Medicine (BJ), Kawata and Laubisch endowments (JNW), an AHA Established Investigator Award (SFL), a Pauline and Harold Price Endowment and a Medtronic-Zipes Endowments (PSC). We thank Stephanie Plummer for her assistance.
Footnotes
Disclosures: None.
References
- 1.Cranefield PF, Hoffman BF, Siebens AA. Anodal excitation of cardiac muscle. American Journal of Physiology. 1957;190:383–390. doi: 10.1152/ajplegacy.1957.190.2.383. [DOI] [PubMed] [Google Scholar]
- 2.Dekker E. Direct current make and break thresholds for pacemaker electrodes on the canine ventricle. Circ Res. 1970;27:811–823. doi: 10.1161/01.res.27.5.811. [DOI] [PubMed] [Google Scholar]
- 3.Chen PS, Wolf PL, Cha YM, Peters BB, Topham SL. Effects of subendocardial ablation on anodal supernormal excitation and ventricular vulnerability in open-chest dogs. Circulation. 1993;87:216–229. doi: 10.1161/01.cir.87.1.216. [DOI] [PubMed] [Google Scholar]
- 4.Hoffman BF, Gorin EF, Wax FS, Siebens AA, Brooks CM. Vulnerability to fibrillation and the ventricular-excitability curve. American Journal of Physiology. 1951;167:88–94. doi: 10.1152/ajplegacy.1951.167.1.88. [DOI] [PubMed] [Google Scholar]
- 5.Piacentino V, III, Weber CR, Chen X, Weisser-Thomas J, Margulies KB, Bers DM, Houser SR. Cellular basis of abnormal calcium transients of failing human ventricular myocytes. Circ Res. 2003;92:651–658. doi: 10.1161/01.RES.0000062469.83985.9B. [DOI] [PubMed] [Google Scholar]
- 6.Weber CR, Piacentino V, III, Houser SR, Bers DM. Dynamic regulation of sodium/calcium exchange function in human heart failure. Circulation. 2003;108:2224–2229. doi: 10.1161/01.CIR.0000095274.72486.94. [DOI] [PubMed] [Google Scholar]
- 7.Fedorov VV, Lozinsky IT, Sosunov EA, Anyukhovsky EP, Rosen MR, Balke CW, Efimov IR. Application of blebbistatin as an excitation-contraction uncoupler for electrophysiologic study of rat and rabbit hearts. Heart Rhythm. 2007;4:619–626. doi: 10.1016/j.hrthm.2006.12.047. [DOI] [PubMed] [Google Scholar]
- 8.Hwang GS, hayashi H, Tang L, Ogawa M, Hernandez H, Tan AY, Li H, Karagueuzian HS, Weiss JN, Lin SF, Chen PS. Intracellular calcium and vulnerability to fibrillation and defibrillation in langendorff-perfused rabbit ventricles. Circulation. 2006;114:2595–2603. doi: 10.1161/CIRCULATIONAHA.106.630509. [DOI] [PubMed] [Google Scholar]
- 9.Billman GE. Intracellular calcium chelator, bapta-am, prevents cocaine-induced ventricular fibrillation. AmJ Physiol. 1993;265:H1529–H1535. doi: 10.1152/ajpheart.1993.265.5.H1529. [DOI] [PubMed] [Google Scholar]
- 10.Ogawa M, Lin SF, Weiss JN, Chen PS. Calcium dynamics and ventricular fibrillation. Circ Res. 2008;102:e52. doi: 10.1161/CIRCRESAHA.108.171538. [DOI] [PubMed] [Google Scholar]
- 11.Bogdanov KY, Vinogradova TM, Lakatta EG. Sinoatrial nodal cell ryanodine receptor and na(+)-ca(2+) exchanger: Molecular partners in pacemaker regulation. Circ Res. 2001;88:1254–1258. doi: 10.1161/hh1201.092095. [DOI] [PubMed] [Google Scholar]
- 12.Blaustein MP, Lederer WJ. Sodium/calcium exchange: Its physiological implications. Physiol Rev. 1999;79:763–854. doi: 10.1152/physrev.1999.79.3.763. [DOI] [PubMed] [Google Scholar]
- 13.Hayashi H, Lin SF, Joung B, Karagueuzian H, Weiss JN, Chen PS. Virtual electrodes and the induction of fibrillation in langendorff-perfused rabbit ventricles: The role of intracellular calcium. AmJPhysiol Heart Circ Physiol. 2008;295:H1422–1428. doi: 10.1152/ajpheart.00001.2008. [DOI] [PMC free article] [PubMed] [Google Scholar]
- 14.Chen PS, Joung B, Shinohara T, Das M, Chen Z, Lin SF. The initiation of the heart beat. Circ J. 2010;74:221–225. doi: 10.1253/circj.cj-09-0712. [DOI] [PubMed] [Google Scholar]
- 15.Ranjan R, Tomaselli GF, Marban E. A novel mechanism of anode-break stimulation predicted by bidomain modeling. Circulation Research. 1999;84:153–156. doi: 10.1161/01.res.84.2.153. [DOI] [PubMed] [Google Scholar]
- 16.Ranjan R, Chiamvimonvat N, Thakor NV, Tomaselli GF, Marban E. Mechanism of anode break stimulation in the heart. Biophys J. 1998;74:1850–1863. doi: 10.1016/S0006-3495(98)77895-6. [DOI] [PMC free article] [PubMed] [Google Scholar]
- 17.Shi W, Wymore R, Yu H, Wu J, Wymore RT, Pan Z, Robinson RB, Dixon JE, McKinnon D, Cohen IS. Distribution and prevalence of hyperpolarization-activated cation channel (hcn) mrna expression in cardiac tissues. Circ Res. 1999;85:e1–6. doi: 10.1161/01.res.85.1.e1. [DOI] [PubMed] [Google Scholar]
- 18.Han J, Moe GK. Nonuniform recovery of excitability in ventricular muscle. Circulation Research. 1964;14:44–60. doi: 10.1161/01.res.14.1.44. [DOI] [PubMed] [Google Scholar]
- 19.Chen PS, Wolf PD, Dixon EG, Danieley ND, Frazier DW, Smith WM, Ideker RE. Mechanism of ventricular vulnerability to single premature stimuli in open-chest dogs. Circulation Research. 1988;62:1191–1209. doi: 10.1161/01.res.62.6.1191. [DOI] [PubMed] [Google Scholar]
- 20.Pertsov AM, Davidenko JM, Salomonsz R, Baxter WT, Jalife J. Spiral waves of excitation underlie reentrant activity in isolated cardiac muscle. Circulation Research. 1993;72:631–650. doi: 10.1161/01.res.72.3.631. [DOI] [PubMed] [Google Scholar]
- 21.Lin SF, Roth BJ, Wikswo JP., Jr Quatrefoil reentry in myocardium: An optical imaging study of the induction mechanism. Journal of Cardiovascular Electrophysiology. 1999;10:574–586. doi: 10.1111/j.1540-8167.1999.tb00715.x. [DOI] [PubMed] [Google Scholar]
- 22.Eisner DA, Kashimura T, Venetucci LA, Trafford AW. From the ryanodine receptor to cardiac arrhythmias. Circ J. 2009;73:1561–1567. doi: 10.1253/circj.cj-09-0478. [DOI] [PubMed] [Google Scholar]
- 23.Efimov IR, Cheng YN, Biermann M, Van WDR, Mazgalev TN, Tchou PJ. Transmembrane voltage changes produced by real and virtual electrodes during monophasic defibrillation shock delivered by an implantable electrode. Journal of Cardiovascular Electrophysiology. 1997;8:1031–1045. doi: 10.1111/j.1540-8167.1997.tb00627.x. [DOI] [PubMed] [Google Scholar]
- 24.Efimov IR, Cheng Y, Van Wagoner DR, Mazgalev T, Tchou PJ. Virtual electrode-induced phase singularity: A basic mechanism of defibrillation failure. Circulation Research. 1998;82:918–925. doi: 10.1161/01.res.82.8.918. [DOI] [PubMed] [Google Scholar]
- 25.Efimov I, Ripplinger CM. Virtual electrode hypothesis of defibrillation. Heart Rhythm. 2006;3:1100–1102. doi: 10.1016/j.hrthm.2006.03.005. [DOI] [PubMed] [Google Scholar]
- 26.Hwang GS, Tang L, Joung B, morita N, Kobayashi K, hayashi H, Karagueuzian HS, Weiss JN, Lin SF, Chen PS. Superiority of biphasic over monophasic defibrillation shocks is attributable to less intracellular calcium transient heterogeneity in langendorff-perfused rabbit ventricles. Journal of the American College of Cardiology. 2008;52:828–835. doi: 10.1016/j.jacc.2008.05.040. [DOI] [PMC free article] [PubMed] [Google Scholar]
- 27.Hayashi H, Kamanu SD, Ono N, Kawase A, Chou CC, Weiss JN, Karagueuzian HS, Lin SF, Chen PS. Calcium transient dynamics and the mechanisms of ventricular vulnerability to single premature electrical stimulation in langendorff-perfused rabbit ventricles. Heart Rhythm. 2008;5:116–123. doi: 10.1016/j.hrthm.2007.08.020. [DOI] [PMC free article] [PubMed] [Google Scholar]
- 28.Sharifov OF, Fast VG. Role of intramural virtual electrodes in shock-induced activation of left ventricle: Optical measurements from the intact epicardial surface. Heart Rhythm. 2006;3:1063–1073. doi: 10.1016/j.hrthm.2006.05.018. [DOI] [PubMed] [Google Scholar]
- 29.Nikolski V, Sambelashvili A, Efimov IR. Anode-break excitation during end-diastolic stimulation is explained by half-cell double layer discharge. IEEE Trans Biomed Eng. 2002;49:1217–1220. doi: 10.1109/TBME.2002.803520. [DOI] [PubMed] [Google Scholar]


