Abstract
Conventional photothermal (PT) and photoacousic (PA) imaging, spectroscopy, and cytometry are preferentially based on positive PT/PA effects, when signals are above background. Here, we introduce PT/PA technique based on detection of negative signals below background. Among various new applications, we propose label-free in vivo flow cytometry of circulating clots. No method has been developed for the early detection of clots of different compositions as a source of severe thromboembolisms including ischemia at strokes and myocardial dysfunction at heart attack. When a low-absorbing, platelet-rich clot passes a laser-irradiated vessel volume, a transient decrease in local absorption results in an ultrasharp negative PA hole in blood background. Using this phenomenon alone or in combination with positive contrasts, we demonstrated identification of white, red and mixed clots on a mouse model of myocardial infarction and human blood. The concentration and size of clots were measured with threshold down to few clots in the entire circulation with size as low as 20 µm. This multiparameter diagnostic platform using portable personal high-speed flow cytometer with negative dynamic contrast mode has potential to real-time defining risk factors for cardiovascular diseases, and for prognosis and prevention of stroke or use clot count as a marker of therapy efficacy. Possibility for label-free detection of platelets, leukocytes, tumor cells or targeting them by negative PA probes (e.g., nonabsorbing beads or bubbles) is also highlighted.
INTRODUCTION
Thromboembolism is a known medical problem and detection of circulating clots of different composition is likely to help in defining risk for thromboembolic complications (1–8). However, existing diagnosis of circulating clots is far from ideal. Ex vivo methods of detecting blood clots are cumbersome, invasive, time-consuming, limited by discrete time-points and are insensitive because of the use of small volume blood samples (6–8). Measurement of platelet aggregation, for example, provides indirect evidence of in vivo clot formation only. The procedure requires anti-coagulants, such as ethylene diamine tetraacetic acid (EDTA) or sodium citrate, for blood collection that may lead to artifacts, and this method ignores the influence of platelet-activating factors elicited by the vessel wall (6,7). These problems could be solved by non-invasive assessments of larger blood volumes in vivo; however, existing diagnostic techniques, such as magnetic resonance imaging (MRI) and positron emission tomography (PET) can only detect fixed or slowly moving large (macro) clots and do not allow diagnosis of fast moving small micro-clots (9–16). Fluorescent imaging can identify rolling clots in some experimental models (16); however, translation of this method to humans is problematic because of the toxicity of fluorescent tags, influence of autofluorescence background, and assessment of superficial microvessels only with slow flow velocity. Pulse Doppler ultrasound is a promising tech-nique for detection of circulating clots, but this technique cannot assess clot composition, detect clots smaller than 50–100 µm, and avoid errors due to artifacts (11,12).
As an alternative, the photothermal (PT) and photoacoustic (PA) methods (also termed optoacoustic [OA]) based on detection of laser-induced heat and accompanied thermoelastic acoustic waves provide greater sensitivity and spatial resolution for detection and imaging of nonfluorescent cells in vitro and in deep (up to 3 cm) vessels in vivo compared with the other optical modalities. Currently PA technique is one of the fastest growing areas of biomedical imaging which have been effective for diagnosis of malignancy, visualization of blood vessels, and detection of circulating tumor cells and infections (17–23). The clinical significance and safety of PA devices has been demonstrated in humans (18), including monitoring of blood oxygenation in large (1–1.5 cm) human blood vessels with depth of 1.5–2.5 cm (24). PA imaging has been shown to detect adhered thrombi in a study of phantoms and veins in vitro (25,26). However, PA detection of circulating clots in vivo has not yet been reported due to the lack of fast PA signal acquisition algorithms. As a result, schematic and methodology for detection of low-absorbing fast moving clots within a strong absorption background of blood have not been yet available.
Here, we introduce PA flow cytometry (PAFC) using dynamic negative contrast mode. Previous applications of PA technique were mostly based on positive PA contrasts wherein local laser heating of strongly absorbing targets provides high-amplitude signals above background. Negative PA contrast (referred further also effect) assumes that signals from targets are below the background determined either by thermodynamic sample temperature or by additional absorption. Historically, the term negative OA effect was introduced during study of infrared absorption spectra of non-biological objects. The gas sample was cooled due to emitting of infrared radiation in the direction of “cold” low temperature optical source (27). The periodic cooling of sample led to generation of PA signals with spectrum correlated with infrared absorption spectrum of samples. We and others observed the effect of kinetic cooling with manifestation of negative OA signals in CO2 + N2 mixture under CO2 pulse laser (17, 28). The physical mechanisms of this effect are explained by optical excitation of high-energy vibrational levels with a long lifetime within which the thermodynamic (Boltzmann) energy deficit of the depleted low-energy levels was quickly taking from the kinetic energy. Besides spectroscopic application, the similar mechanisms of kinetic laser cooling were proposed to use in laser refrigerators (29). We also demonstrated PA detection of laser burned ultrasharp negative spectral holes in broad plasmonic spectra of gold nanoparticles having overlapping absorption spectrum (22). Nevertheless, little progress has been made in terms of use of negative PA (OA) effects or contrasts in biomedical applications when the negative signals are detected below an equilibrium noise or absorption background, respectively. Here, we demonstrate for the first time that PT/PA technique with negative dynamic contrast can be used for label-free in vivo detection of low-absorbing fast moving objects in strong blood flow background with focus on circulating clots.
METHODS
Scanning integrated PT/PA microscope-cytometer (Fig. 1)
Figure 1. Principle of high-speed PAFC with positive and negative contrast detection modes.
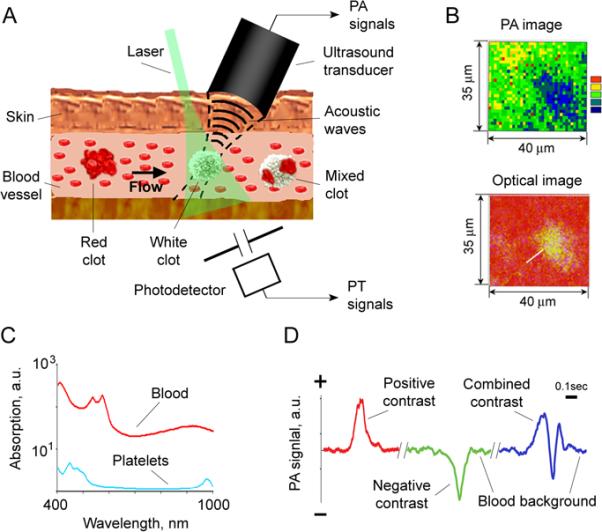
A. Schematic of PA detection of low-absorbing white (platelet-rich) clots, high-absorbing red (RBC-rich) and mixed (white and red) clots in bloodstream. B. PA and optical imaging of low-absorbing clots in human blood samples ex vivo. C. Absorption spectra of whole blood (red), and platelet rich plasma (blue); the average SEM for each wavelength is 21% determined by spectrophotometer used. D. Examples of negative, positive and combined dynamic PA contrasts in vivo on mouse model.
Schematics
The integrated setup (Fig. 1A) was built on the technical platform of an inverted microscope (IX81, Olympus America., USA), with an incorporated PT, PA, fluorescent and transmission modules, and a tunable optical parametric oscillator (OPO, Opolette HR 355 LD, OPOTEK, Carlsbad, CA) with the following parameters: spectral range of 410–2,500 nm, pulse width, 5 ns; pulse energy, up to 2 mJ; pulse energy stability, 3–5%; pulse repetition rate, 100 Hz; line width ~0.5 nm (30,31). Pump laser energy was controlled by a powermeter (PE10-SH, OPHIR, Israel). In addition to the tunable OPO, the setup was equipped with a high pulse repetition rate laser (Model: LUCE 532, Bright Solutions, Italy) with the parameter set: wavelength, 532 nm; maximum pulse energy, 100 µJ; pulse width, 5 ns; and pulse repetition rate, up to 50 kHz. Laser-induced PA waves were detected with an unfocused ultrasound transducer (model 6528101, 3.5 MHz, 5.5 mm in diameter; Imasonic, Besanc¸on, France) or a focused cylindrical transducer (model V316-SM, 20 MHz, focal length, 12.5 mm; Panametrics-NDT, Olympus) and amplifier (5662B, 5 MHz, gain 60 dB and 5678, 40 MHz, gain 60 dB, respectively; both from Panametrics- NDT, Olympus). Warm water or ultrasound gel was applied for better acoustic matching between the transducer and the samples. The PA signal under single laser pulse had a bipolar shape that was transformed into a pulse train due to reflection and resonance effects.
In PT thermolens schematic, laser-induced temperature-dependent variations of the refractive index around absorbing zones caused defocusing of a continuous-wave collinear He-Ne laser (model 117A, Spectra-Physics; wavelength, 633 nm; 1.4 mW) probe beam, leading to a reduction in the beam's intensity at its center, detected by a photodiode with preamplifier (PDA36A, 40 dB amplification, ThorLabs). The linear PT thermolens signal under single laser pulse demonstrated the standard fast-rising unipolar peak associated with rapid (picosecond-nanosecond scale) sample heating and a slower (microsecond scale) tail corresponding to sample cooling. PT/PA mapping of the sample was realized by scanning the sample with two-dimensional (X-Y) translation stage (H117 ProScan II, Prior Scientific) with a positioning accuracy of 50 nm. Scanning along the Z-axis was performed by moving the microscopic objective axially. The lateral resolution was ~0.7 μm with a 20× objective, and a ~300 nm with 100× oil immersion objective.
The microscope was equipped with a standard fluorescence module (Olympus). A high resolution, cooled, color CCD camera (DP42, Olympus) was used for the navigation of laser beams and for the verification of PT data with fluorescent images using specific fluorescent tags. High-resolution (300 nm) transmission digital microscopy (TDM), fitted with a high-speed (up to 40,000 fps) CMOS (MV-D1024-160-CL8; Photonfocus AG, Lachen, Switzerland) and high sensitive CCD (Cascade: 512; Photometrics, Roper Scientific) cameras were used for label-free imaging blood vessels with circulating and adhered clots. Conventional absorption spectra were obtained by fiber spectrophotometer (USB4000, Ocean Optics, USA).
Data screening
The acquisition and processing of PT and PA data using the OPO system with relatively low pulse rate (100 Hz) was done by digitizer (PCI-5124, 200 MSPS, 12-bit, National Instruments, Austin, TX) installed in a workstation (Precision 690, Dell, Round Rock, TX). This system was used to acquire signals from the photodetector, transducer and energy meter. Synchronization of the OPO, signal acquisition, processing and control of translation stage was implemented in a single software module (customized software based on LabView 8.5, National Instruments, USA). The signals were recorded also with a Tektronix TDS 3032B oscilloscope.
For both, PT and PA, signal acquisitions using high pulse repetition rate lasers (10 kHz), we installed a digitizer (AD484, 120 MSPS, 14-bit, 4DSP Inc, Reno, NV) onto the workstation (Precision T7500, Dell, Round Rock, TX). The custom FPGA (Field Programmable Gate Array) firmware on the digitizer calculated the spectrum of the signals after each trigger, and transferred a certain region of interest (ROI) in these spectrums for further processing. A MATLAB-based (Mathworks, Natick, MA) program was developed to analyze the recorded data. It was used to determine the baseline, the threshold level, the peaks above threshold, and to provide statistical analysis. A continuous real-time monitoring of the acquired signals was displayed in the time increment of 100 ms, which enabled the convenient presentation of each increment as a full-screen frame. The appearance of a distinct sharp, negative peak indicated the passage of a clot (Fig. 1D). A high pass filtering was applied because the sharp, negative PA peak consisted mainly of high frequency components in the range of 100 Hz – 5 MHz. Artifacts secondary to movement of blood vessel (e.g., caused by beating heart or breathing) generated low frequency noise below 100 Hz. The relatively smooth baseline after filtering represented PA background due to absorption by red blood cells (RBCs) (Fig. 1D). Each trace was analyzed for the presence of peaks with height exceeding a defined threshold. The stable baseline associated with the background absorption by blood was accurately subtracted allowing observation of the small negative peaks (Fig.2) at a different number of averaged PA signals (Fig. 3).
Figure 2.
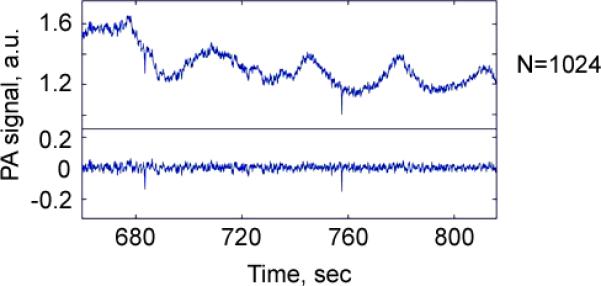
PA negative peaks produced by circulating clots in the background of blood flow before (top) and after (bottom) high frequency filtering.
Figure 3.
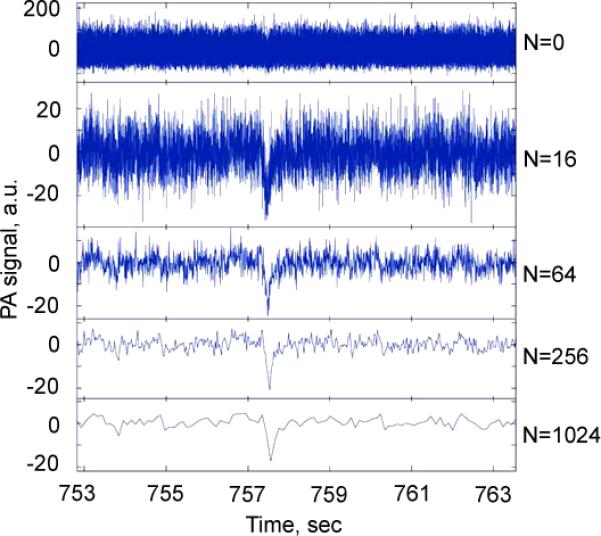
An increase of signal-to-noise ratio as the function of a number of averaged PA signals with negative contrast from a single circulating clots in mouse circulation after a high pass filtering (Fig. 2) using a high pulse repetition rate (10 kHz) laser at 532 nm.
Preparation of clots in vitro
White clots were produced by platelet aggregation using collagen applied to a 0.5-mL aliquot of platelet-rich plasma or stabilized blood. Red clots as a result of hyperaggregation of RBCs in PBS or whole blood samples were created by Dextran500. Blood samples were collected from human donors (Institutional Review Board-approved protocol at the University of Arkansas for Medical Sciences) and animals (protocol approved by the University of Arkansas for Medical Sciences Institutional Animal Care and Use Committee).
Platelet-rich plasma was prepared via centrifugation of whole blood at 200×g for 6 min to remove RBCs. Platelets were washed via centrifugation of platelet-rich plasma at 1,000×g for 10 min at room temperature. The pellet was re-suspended in PBS to the desired concentration. Single RBCs were prepared by their isolation through initial centrifugation of whole blood after the removal of plasma and leukocyte layers.
Blood circulation was modeled in vitro by using a flow module with the flow speed of 0–14 cm/s (KD Scientific, Holliston, MA) in glass tubes filled with 1 mL of human or mouse blood. For calibration of negative contrast, blood samples were spiked with transparent polymer beads with diameters ranged from 12 to 200 μm.
Animal models
In vivo experiments involved a noninvasive mouse ear model (nude mice nu/nu), mouse carotid artery model, mouse myocardial infarction model (occlusion of left coronary artery in the anesthetized wild-type mice three weeks earlier) and rat mesentery model (Sprague-Dawley rats), in accordance with protocols approved by the University of Arkansas for Medical Sciences Institutional Animal Care and Use Committee. We selected rat mesentery as an ideal minimally invasive animal model because it has a thin tissue layer which allows clear identification of single-blood vessels that can be assessed with high-resolution optical (transmission) and PT techniques. After anesthesia (ketamine/xylazine, 50/10 mg / kg, i.m.), the animal was laparotomized and mesentery was exteriorized on a customized, heated (37.7°C) microscope stage. It was then suffused with warmed Ringer's solution (37.7°C, pH 7.4) containing 1% bovine serum albumin. Three to five small arteries and veins with different diameters were examined using PA and PT techniques over a period of 120 min.
Experiments with the mice were performed on the thin (~250 μm) mouse ear with well-distinguished blood vessels at 50–100 μm depth and 50–150 μm diameter. The anesthetized animal was placed on the heated microscope stage with a topical application of water on the ear for acoustic matching of the ultrasound transducer and the tissue. The carotid artery was examined through the incision in skin.
The clots were produced by an intravenous (i.v.) injection of collagen (No.385 Collagen, Chrono-Log; 100 μg/kg), Dextran500 and by a topical application of strip with FeCl3 on large vessels (e.g., carotid artery) for 2–3 min. Fluorescent labeling of the platelets was obtained by i.v. injection of carboxyfluorescein diacetate succinimidyl ester (CFSE; 20 µg per a mouse; excitation 489 nm, emission 520 nm). Fluorescent video monitoring of red clots was obtained after labeling plasma with fluorescein isothiocyanate (FITC) – dextran.
Statistical analysis
A minimum of 3 animals were used for each experiment unless otherwise noted. Results are expressed as mean ± standard error. Spearman correlations for which P <0.05 were considered statistically significant. MATLAB 7.0.1 (MathWorks, Natick, MA), and LabVIEW (National Instruments) were used for the statistical calculations. Data were summarized as the mean, standard deviation (SD), median, inter-quartile range, and full range. Comparisons of PA and PT data were via scatter plot in conjunction with Spearman correlation analysis.
RESULTS
Principle of label-free PA detection of circulating clots in vivo
Laser irradiation of blood vessels (Fig. 1A) creates a constant PA background (Fig. 1D) determined by high-absorbing hemoglobin in RBCs. The background level depends on laser energy, absorption spectra (Fig. 1C) (32) and hemoglobin concentration which in turn depends on number of RBCs (i.e., hematocrit) in the detected (irradiated) volume. To be detected using the conventional positive contrast mode, the target must have higher absorption compared with blood background. When this target (e.g., RBC-rich red clot) passes through the irradiated volume blood, a transient increase in local absorption results in a sharp positive PA peak (Fig.1D, left). Inversely, in the negative contrast mode, the target must have lower absorption than the whole blood as in the case of platelets (33). When a low-absorbing, platelet-rich, RBC-depleted clot passes the laser beam, a transient decrease in local absorption is accompanied by formation of a narrow PA negative dip as the marker of a white clot (Fig. 1D, middle). A mixed clot with both RBC–rich (i.e., high-absorbing) and platelet-rich (i.e., low-absorbing) local zones should produce a pattern of positive and negative PT/PA signals (Fig 1D, right). Indeed, according to our calculations, dense aggregate of 5 RBCs has a volume of ~450 fL (corpuscular volume of single human RBC is 90 fL) with total hemoglobin amount of 150 pg (~30 pg/cell), while the same volume of whole blood at the typical hematocrit of 40% contains just 2 RBCs with 60 pg of hemoglobin (32). Thus, the expected positive contrast PA signal from dense RBC-rich (or hemoglobin from damaged RBCs) clot is approximately 2.5 times higher as compared with background signal from randomly distributed RBCs in the same volume. In contrast, the platelet-rich clot zone should dramatically decrease signals from blood background to almost zero level (i.e., negative contrast).
Optimization of PA and PT parameters using animal and human blood samples
This phenomenological model was verified by developing a high speed PAFC using a high pulse rate laser and fast PA signal acquisition system. We selected a spectral range of 530–600 nm with a strong blood absorption band (Fig. 1C) (23,32) that provides relatively large PA signals from blood background, allowing monitoring of negative contrast in a wide dynamic range. Use of a PA and PT scanning cytometry (Figs. 4 and 5) (30,31) revealed that PA/PT signals from a single human and animal platelet were approximately three orders of magnitude less than the signals from a single RBC at the same laser energy (Fig. 5A, first and second columns). Compared with a single platelet, PA/PT signals from platelet-rich clot were 10- to 20-fold higher (Figs. 4 and 5A, second and third columns); nevertheless, the difference between signals from the white clots and individual RBCs was still significant, around 50- to 100-fold. In contrast, RBC aggregates produced PA/PT signals with amplitudes which were significantly higher than from single RBCs, and correlated with the aggregate sizes (Fig. 5A, first and forth columns). As a result, laser scanning of whole human blood with white clots demonstrated distinct negative PA/PT contrasts (Fig. 5B), and positive contrasts when laser beam scanned red clot (Fig. 5C). The mixed (i.e., red and white) clots were recognized by the specific pattern of positive and negative (i.e., combined) PA/PT contrasts associated with RBC- and platelet-rich areas (Fig. 5D). Using low absorbing beads of different known sizes as a white clot phantom in vitro in static and flow conditions, we determined that PA signal amplitudes are dependent on bead-size with readable signal levels down to 12-μm beads (Figs. 5E and 6). These results were confirmed using blood samples in a 120-μm-thick slide with real clots of different sizes determined independently by optical imaging (Figs. 4 and 5F).
Figure 4. PA and PT scanning cytometry of platelet aggregates with different sizes placed into 120-μm-thick blood samples.
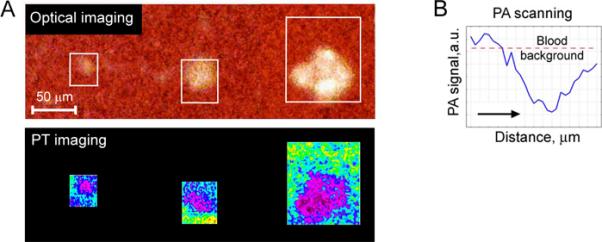
A. PT images (bottom row) and complementary optical images (top row) of platelet aggregates with the mean size of 22±1.7 μm (left), 38±3.1 μm (middle) and 68±4.9 μm (right). B. PA 2D-scan (averaging by 8 scans performed with steps of 10 μm) demonstrating a significant negative contrast from platelet aggregates with the size of 20 μm. Laser parameters: wavelength, 532 nm; pulse repetition frequency, 100 Hz; pulse energy, 1.0 μJ; diameter of laser spot, ~5 μm.
Figure 5. PA and PT scanning cytometry of clots ex vivo.
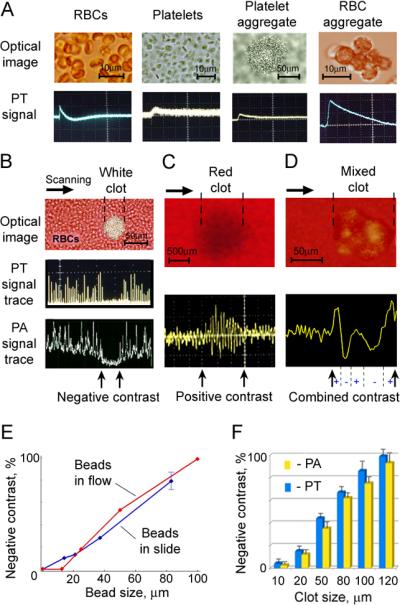
A. High-resolution optical images (top) and PT signals (bottom) from of individual RBCs (first), platelets (second), collagen-induced platelet aggregate in PBS (third) and Dextran-induced RBC aggregate in PBS (forth); from left to right, respectively. Parameters: wavelength, 580 nm; laser energy fluence: 9.5 J/cm2 (for platelet), and 10 mJ/cm2 (for RBCs); amplitude/time scale (from left to right panel): (50 mV/div)/(10 μs/div); (5 mV/div)/(1 μs/div); (100 mV/div)/(10 μs/div); (100 mV/div)/(5 μs/div). B. Microscopic image (top), PT signal trace (middle) and PA signal trace (bottom) from white platelet-rich clot; amplitude/time scale: (100 mV/div)/(0.1 μs/div) for PT signal trace and (10 mV/div)/(0.1 μs/div) for PA signal trace. C. Photo image (top) and PA signal trace (bottom) from red RBC-rich clot; amplitude/time scale: (100 mV/div)/(0.1 μs/div). D. Microscopic image (top) and PT signal trace (bottom) from mixed (white and red) clot; amplitude/time scale: (100 mV/div)/(0.1 μs/div). PA and PT signal traces (in B, C and D) were obtained during scanning of focused laser beam with 7±2 μm in diameter across the sample at parameters: wavelength, 580 nm; laser energy fluence: 0.3 J/cm2 for the white clot; 20 mJ/cm2 for the red clot and 0.1 J/cm2 for the mixed clots. E. Normalized negative PA signals from beads of different sizes spiked with whole blood and applied in static (120-μm-thick slides) and flow (200-μm-glass tube). F. PA and PT signals from platelet aggregates with different sizes in 120-μm-thick blood samples.
Figure 6.
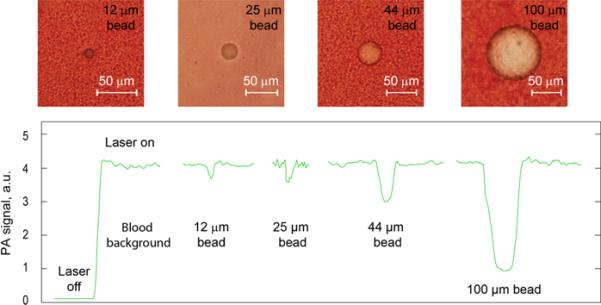
Optical imaging (top) and PA signals (bottom) from beads spiked with whole blood in the slide with thickeness of 120 μm.
In vivo flow cytometry of circulating white clots
To provide proof-of-concept in vivo, we first selected a rat mesentery model (34) with distinguishable single-blood vessels which are assessable simultaneously with transmission and PT/PA techniques (Fig. 7, 8 A–C). Intravenous injection of collagen led to the formation of circulating platelet-rich clots (n=3) (8), which were detected by a decrease in both, PT and PA signals (Fig. 8B), and verified by high-speed optical imaging. The PA negative dip level, its width and signal rate varied within a large range (20%–100%, 10–100 ms and 0.5–3.0 clot/min, respectively), providing real-time clot enumeration and indicating on a wide heterogeneity in clot size and velocity (n=6). Starting 10–15 min after injection, some clots adhered to the vessel wall (Fig. 7, 8A). Thrombi were frequently localized in bifurcation zones. They slightly oscillated under blood flow pressure leading, in particular, to the chaotic motion of the intra-thrombotic platelets. In the most cases, the thrombi showed stable adhesion to the endothelium accompanied by their dynamic composition modification. Initially, the adherent clots represented almost transparent structures with no evidence of RBCs incorporated into the clot. Over time, some leukocytes (white blood cells [WBCs]) and RBCs directed from flow to the thrombus by stretching or rotating motions and adhered to the thrombus. This eventually led to an increase in thrombus size and promoted the transformation from white thrombus to red one (Fig. 7). This finding indicates that the clots initially circulate as platelet-rich white clots with minimal interaction with RBCs which move with similar velocity as platelets and minimal collisions with platelets. However, as circulating RBCs collide with the adherent clot, RBCs start adhering to the platelet-fibrin rich mesh. The dynamic transformation of white clot into a mixed (white and red) clot was monitored by high speed optical imaging, and PA and PT cytometry as a switching of purely negative signal to a pattern of positive and negative contrast signals. These results are in agreement with in vitro data (Figs. 5B and 5D).
Figure 7.
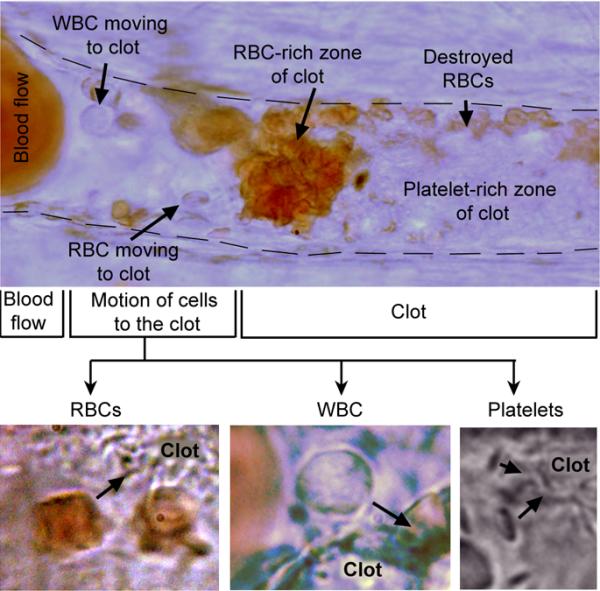
In vivo high-resolution (~300nm) label-free optical imaging of the adhered clot in the mesenteric blood vessel with mean diameter of 42±3.3 μm after intravenous injection of collagen. The clot, that was initially formed in circulation as white platelet aggregate, adhered with following accumulation, aggregation and partial destruction of RBCs.
Figure 8. In vivo PA and PT detection of white and heterogenous (white and red) clots.
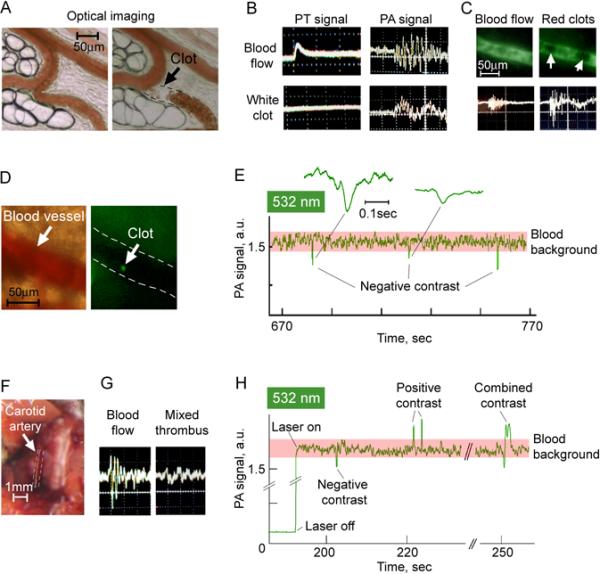
A. Optical imaging of rat mesenteric vein before (left) and after (right) adhesion of circulating white clot to vascular wall; image was taken at the 10th min after intravenous injection of collagen. B. Typical PT (left) and PA (right) signals from intact blood flow (top row) and from circulating white clots (bottom row) at the wavelength of 605 nm; amplitude/time scale: (100 mV/div)/(50 μs/div) for PT oscilograms from blood flow and white clot; (10 mV/div)/(10 μs/div) for PA oscilograms from blood flow and white clot. C. Fluorescent images (top) and PA signals (bottom) from rat mesenteric vein without (left column) and with (right column) circulating red clot at the wavelength of 580 nm. D. Optical (left) and fluorescent (right) images of blood vessel (47±2.1 μm) in mouse ear with circulating platelet aggregate (green spot) labeled by CFSE. Amplitude/time scale of both PA oscilograms is (20 mV/div)/(10 μs/div). E. Label-free, real-time quantitative detection of circulating white clots through sharp negative PA dips in mouse ear vessels at the wavelength of 532 nm. Insets (callouts) show in detail selected PA negative peaks. Laser pulse repetition rate is 10 kHz. F. Carotid artery in mouse in vivo. G. PA signal from intact blood flow in carotid artery before (left), and after it occlusion by the clot (right); amplitude/time scale: (10 mV/div)/(10 μs/div). H. Label-free, real-time PAFC of the ear vessel in the mouse with myocardial infarction at the wavelength of 532 nm. Laser pulse repetition rate is 10 kHz.
In vivo detection of red clots
Intravenous injection of Dextran500 as a well-established inductor of circulating RBC aggregates led to the expected appearance of transient positive PA contrast signals (Fig. 8C, bottom, right). The mean amplitude of these signals were, on an average, two times larger than the background signals from intact blood. The presence of moving RBC aggregates was confirmed also by fluorescent imaging after intravenous injection of FITC-dextran: aggregates as large dark spots were clearly distinguished on the background of bright fluorescent plasma (i.e., negative fluorescent contrast) (Fig.8C, top right) and differed from grey non-aggregated blood (Fig.8C, top left).
Noninvasive high-speed PA flow cytometry of clots
Noninvasive PA monitoring of circulating clots was performed using mouse ear model. The formation of moving collagen-induced white clots was verified with fluorescent imaging by targeting of platelets in vivo with CFSE fluorescent dye (Fig. 8D). High-speed PAFC with a high pulse repetition rate laser showed negative PA dips (Fig. 8E) suggesting clot formation at the rate of 1–2 clots/min and negative contrast levels ranging from 12 to 59%. The thrombi later embolized in remote organs, such as lungs (Fig. 9) of these animals, in agreement with published data (8).
Figure 9.
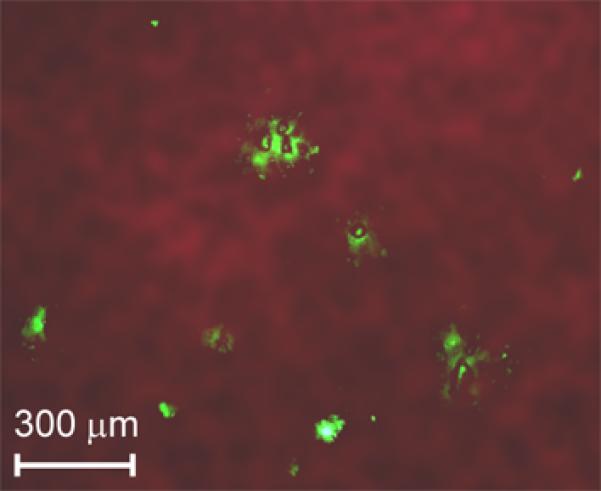
Combined fluorescent and transmission ex vivo imaging of a mouse lung with platelet aggregates (green fluorescence spots) at the 180th min after an intravenous injection of collagen as an inductor of platelet aggregation. The CFSE fluorescent dye injected into the tail vein provided in vivo labeling of circulating platelets.
PA detection of clots in a carotid artery as a risk factor of ischemic stroke
To verify the capability of PAFC to detect clots in the mouse carotid artery (Fig. 8F), we applied a well-established model of platelet-rich thrombus (15) by application of ferric chloride (FeCl3) directly to the exposed artery (n=3) (Fig. 8F). We observed a gradual decrease of PA signals in the carotid artery over 2–5 min, suggesting clot formation, accompanied by changes in the shape and the width of PA signals (Fig. 8G, right) compared to control (Fig.8G, left).
Diagnosis of circulating clots in preclinical model of myocardial infarction
A real-time dynamics of circulating clots were monitored in mice with myocardial infarction created by total ligation of left coronary artery. The readable transient PA signals were observed with different patterns of negative, positive, and combined contrasts (Fig. 8H) compared to no signals in control normal mice. According to previously described findings, the origin of these signals is likely related to the formation of white, red, and mixed clots, respectively.
Prevention of false positivity related to white blood cells
In order to estimate the influence of WBCs on a PT/PA signals among RBCs, blood samples were placed in the wells with a varied thickness from 5 to 120 μm. The presence of leukocyte in the detected volume was controlled by transmission imaging. As expected, the scanning of a focused laser beam across the sample provided readable PT/PA negative contrasts in signal-traces when the leukocytes were more than 30% of slide thickness. In vivo PT monitoring of blood capillaries and microvessels showed that leukocytes or plasma in capillaries between distinguished single RBCs provided a detectable negative contrasts in the vessels with a mean diameter of 10–25 μm only. These in vivo results were in agreement with the results of in vitro indicating that the influence of the single WBCs in the detected area on negative contrast can be minimal in vessels with a mean diameter of 30–40 μm and more.
DISCUSSION
In this article, we introduce a new label-free, noninvasive real-time PA method, which has the potential to identify composition, size and rate of circulating clots by analyzing PA signal shape, width, and rate, respectively. At known the irradiated volume and clot size which could be measured independently with imaging, the signal width provides information of clot velocity. When compared to the previously observed negative PA effects and contrasts, mostly in non-biologic samples (17, 27–28), the dynamic negative PT/PA contrast modes introduced here may have broad biological and clinical applications.
In comparison to adhered clots (4, 14, 15, 25, 35) the behavior of circulating clots and their clinical role are still poorly understood. For example, some circulating clots remain undetectable (fast moving micro-clots) unless they result in a clinical phenomenon, and their significance for human disease remains unclear. It is not known as to what sizes of circulating clots correlate with thromembolism and are functionally relevant. We hope that our diagnostic platform can help to answer on some of these and other important questions.
In particular, it is not currently clear that detection of circulating clots may be an indicator of a risk for stroke and myocardial infarction. Nevertheless, there is no doubt that the blood samples of the most patients with myocardial infarction and unstable angina have high concentration of active pro-coagulants and increased number of aggregated platelets. Circulating clots are a well-established cause of venous and pulmonary thromboembolism, ischemic stroke, and transient ischemic attacks (e.g., in individuals with atrial fibrillation). In particular, it has been estimated that 795,000 individuals suffer stroke per year in the US (36). Most strokes occur unexpectedly are either thromboembolic (approx. 80%) or hemorrhagic (20%). The approximately 30% of stroke causes (238,500 people for each year) are not clear identified. The common cardiac causes of thrombo-embolism (approx. 80% of thromboembolic strokes) are atrial fibrillation, or left ventricular clots formed in patients with myocardial infarction and cardiomyopathic disorders (37–38). In some cases circulating clots are considered as fragments shedding from disrupted atherosclerotic plaques (39–40). Nevertheless, the most clots in the carotid arteries and during acute myocardial infarction are platelet-rich, also called white clots. At times, these clots, formed in the chronically `sick' heart, are a result of turbulence in the left atrium and ventricle as the tissues are either poorly contracting or paradoxically contracting (reference normal myocardium). In these conditions, the clot formed is often rich in fibrin, RBCs with some incorporation of platelets and leukocytes. Although the size of the emboli that cause strokes and other systemic thrombo-embolic disorders varies, the most thrombi are approximately 100 μm in diameter. From these clinically established facts many patients who are prone to develop thromboembolic phenomenon may have micro-thrombi in circulation. As such, demonstrated here techniques can be potentially applied to select patients with hyper-production of circulating clots, to provide real-time multiparameter (e.g., composition, sizes, velocity, ability to adhesion) monitoring of these clots and to find correlation the presence of circulating clots in systemic circulation with the incidence of clinically identifiable stroke, heart attack or/andother thrombo-embolic disorders.
Our study revealed the capability of time-resolved PA and PT technique to identify white, red, and mixed clots through signals with negative, positive, and combined contrasts respectively (Fig. 1D, right). In addition, the clot velocity and size at a fixed known beam diameter can be estimated through PA negative peak width (23, 41) and PA negative dip level (verified by optical imaging) respectively. In particular, for the selected blood vessels the clot velocity it was ranged from 100 μm/s to 3 mm/s, while blood velocity estimated by high speed imaging (34,42) was around 2–3 mm/s. These data indicate the possible presence of rolling clots which velocity is much slower compared to blood flow (14).
Although maximum negative contrast was observed at wavelength of 532 nm, a high sensitivity of PA technique allows in the future to use the near-infrared range with better penetration of light into tissue where absorption contrast between RBCs and platelet is still significant (Fig. 1C).
Toward clinical translation portable watch-like flow cytometer with negative contrast mode and a built-in a small diode laser and transducer (23) could be developed for assessment of circulating clots in different blood vessels from capillaries in the hand, lip or eye area to large coronary artery in the neck area vessels. Indeed, the capability of PA technique to assess deep and large human blood vessels at depths of 1–3 cm and 0.2–1 cm in diameter in vivo is already well-documented (18,24). We also have verified the capability of our prototype to assess mouse aorta with diameter of 0.7–0.9 mm using a high frequency focused cylindrical ultrasound transducer (23).
The main challenge in clinical application is to choose the correct laser geometry to achieve overlapping of an entire diameter of a vessel for detection of all clots moving through a vascular cross-section. We found that at the orientation of a linear beam shape across the vessel compared to along the vessel or circular beam shape, a PA signal is less sensitive to the position of the laser beam on the skin and to the natural human movements (e.g., due to breathing and overall motion). Thus, lateral resolution is determined in superficial tissue by optical focal parameters (5–10 μm) and in deeper tissue by ultrasonic focal parameters (20–80 μm, at frequency 10–75 MHz). As a result, the cylindrical focal configuration allows us to keep a minimal detected volume (due to high lateral resolution) and simultaneously assess the whole cross section of a vessel.
In conclusion, after further validation of described technology, clot detection may be potentially used: (1) as a prognostic marker or a pre-cursor for a thrombo-embolic events such as myocardial infarction and stroke; (2) to study the dynamics of platelet aggregation directly in the bloodstream in pathologic states such as infections and cancer; (3) for realtime assessment of therapeutic efficacy of pharmacologic compounds by quantifying clots before, during and after therapy; and (4) to study clots as well as tumor cells, bacteria, viruses, or microparticles in circulation by targeting them with PA negative (i.e., nonabsorbing) probes such as functionalized beads, nano- and microbubbles, or liposomes. This technique may improve detection limit of clots or microparticles as small as 20 μm in circulating blood. Applications where this technology is more likely to be applied during cardiopulmonary bypass, problems that occur during hemodialysis, complications of thrombolytic therapy of occluded AV abbreviation dialysis shunts, or evaluating complications of intracardiac right to left shunting. We hope that it can be used also for prognosis of stroke risk, and if successful, for its prevention by well-time therapy.
Acknowledgements
This work was supported in part by the National Institute of Health, grant numbers R01CA131164, R01 EB009230, and R21CA139373, the National Science Foundation, grant numbers DBI-0852737, and Department of Defense grants: W88XWH-10-2-0130, W81XWH-10-BCRP-CA, and W81XWH-11-1-0129. We would like to thank Evgeny Shashkov, and Scott Fergusson for their help in experiments.
REFERENCES
- 1.Lloyd-Jones D, Adams RJ, Brown TM, Carnethon M, Dai S, De Simone G, Ferguson TB, Ford E, Furie K, Gillespie C, Go A, Greenlund K, Haase N, Hailpern S, Ho PM, Howard V, Kissela B, Kittner S, Lackland D, Lisabeth L, Marelli A, McDermott MM, Meigs J, Mozaffarian D, Mussolino M, Nichol G, Roger VL, Rosamond W, Sacco R, Sorlie P, Stafford R, Thom T, Wasserthiel-Smoller S, Wong ND, Wylie-Rosett J. American Heart Association Statistics Committee and Stroke Statistics Subcommittee. Executive summary: heart disease and stroke statistics—2010 update: a report from the American Heart Association. Circulation. 2010;121:948–954. doi: 10.1161/CIRCULATIONAHA.109.192666. [DOI] [PubMed] [Google Scholar]
- 2.Ruggeri ZM. Platelets in atherothrombosis. Nat Med. 2002;8:1227–1234. doi: 10.1038/nm1102-1227. [DOI] [PubMed] [Google Scholar]
- 3.Trip MD, Cats VM, van Capelle FJ, Vreeken J. Platelet hyperreactivity and prognosis in survivors of myocardial infarction. N Engl J Med. 1990;322:1549–1554. doi: 10.1056/NEJM199005313222201. [DOI] [PubMed] [Google Scholar]
- 4.Nesbitt WS, Westein E, Tovar-Lopez FJ, Tolouei E, Mitchell A, Fu J, Carberry J, Fouras A, Jackson SP. A shear gradient-dependent platelet aggregation mechanism drives thrombus formation. Nat Med. 2009;15:665–673. doi: 10.1038/nm.1955. [DOI] [PubMed] [Google Scholar]
- 5.Schwartz RS, Burke A, Farb A, Kaye D, Lesser JR, Henry TD, Virmani R. Microemboli and microvascular obstruction in acute coronary thrombosis and sudden coronary death: relation to epicardial plaque histopathology. J Am Coll Cardiol. 2009;54:2167–2173. doi: 10.1016/j.jacc.2009.07.042. [DOI] [PubMed] [Google Scholar]
- 6.Wu KK, Hoak JC. A new method for the quantitative detection of platelet aggregates in patients with arterial insufficiency. Lancet. 1974;19:924–926. doi: 10.1016/s0140-6736(74)91131-3. [DOI] [PubMed] [Google Scholar]
- 7.Furman MI, Barnard MR, Krueger LA, Fox ML, Shilale EA, Lessard DM, Marchese P, Frelinger AL, 3rd, Goldberg RJ, Michelson AD. Circulating monocyte-platelet aggregates are an early marker of acute myocardial infarction. J Am Coll Cardiol. 2001;38:1002–1006. doi: 10.1016/s0735-1097(01)01485-1. [DOI] [PubMed] [Google Scholar]
- 8.Tymvios C, Jones S, Moore C, Pitchford SC, Page CP, Emerson M. Real-time measurement of non-lethal platelet thromboembolic responses in the anaesthetized mouse. Thromb Haemost. 2008;99:435–440. doi: 10.1160/TH07-07-0479. [DOI] [PubMed] [Google Scholar]
- 9.Yamamoto M, Takano M, Murakami D, Inami T, Kobayashi N, Shirakabe A, Inami S, Okamatsu K, Ohba T, Aoki S, Seino Y, Mizuno K. Impact of small thrombus formation in restenotic bare-metal stent lesions associated with acute coronary syndrome: Identification by optical coherence tomography. Int J Cardiol. 2010 doi: 10.1016/j.ijcard.2009.12.027. [Epub ahead of print]? [DOI] [PubMed] [Google Scholar]
- 10.Sosnovik DE. Molecular imaging in cardiovascular magnetic resonance imaging: current perspective and future potential. Top Magn Reson Imaging. 2008;19:59–68. doi: 10.1097/RMR.0b013e318176c57b. [DOI] [PMC free article] [PubMed] [Google Scholar]
- 11.Bahrmann P, Werner GS, Heusch G, Ferrari M, Poerner TC, Voss A, Figulla HR. Detection of coronary microembolization by Doppler ultrasound in patients with stable angina pectoris undergoing elective percutaneous coronary interventions. Circulation. 2007;115:600–608. doi: 10.1161/CIRCULATIONAHA.106.660779. [DOI] [PubMed] [Google Scholar]
- 12.Okamura A, Ito H, Iwakura K, Kurotobi T, Koyama Y, Date M, Higuchi Y, Inoue K, Fujii K. Clinical implications of distal embolization during coronary interventional procedures in patients with acute myocardial infarction: quantitative study with Doppler guidewire. JACC Cardiovasc Interv. 2008;1:268–276. doi: 10.1016/j.jcin.2008.03.015. [DOI] [PubMed] [Google Scholar]
- 13.Frenette PS, Johnson RC, Hynes RO, Wagner DD. Platelets roll on stimulated endothelium in vivo: an interaction mediated by endothelial P-selectin. Proc Natl Acad Sci U S A. 1995;92:7450–7454. doi: 10.1073/pnas.92.16.7450. [DOI] [PMC free article] [PubMed] [Google Scholar]
- 14.Falati S, Gross P, Merrill-Skoloff G, Furie BC, Furie B. Real-time in vivo imaging of platelets, tissue factor and fibrin during arterial thrombus formation in the mouse. Nat Med. 2002;8:1175–1181. doi: 10.1038/nm782. [DOI] [PubMed] [Google Scholar]
- 15.Furie B, Furie BC. Thrombus formation in vivo. J Clin Invest. 2005;115:3355–3362. doi: 10.1172/JCI26987. [DOI] [PMC free article] [PubMed] [Google Scholar]
- 16.Miele LF, Turhan A, Lee GS, Lin M, Ravnic D, Tsuda A, Konerding MA, Mentzer SJ. Blood flow patterns spatially associated with platelet aggregates in murine colitis. Anat Rec (Hoboken) 2009;292:1143–1153. doi: 10.1002/ar.20954. [DOI] [PMC free article] [PubMed] [Google Scholar]
- 17.Zharov VP, Letokhov VS. Laser opto-acoustic spectroscopy. Science; Moscow: 1984. [Google Scholar]
- 18.Wang LV. Multiscale photoacoustic microscopy and computed tomography. Nature photonics. 2009;3:503–509. doi: 10.1038/nphoton.2009.157. [DOI] [PMC free article] [PubMed] [Google Scholar]
- 19.Galanzha EI, Shashkov EV, Kelly T, Kim JW, Yang LL, Zharov VP. In vivo magnetic enrichment and multiplex photoacoustic detection of circulating tumour cells. Nat Nanotechnol. 2009;4:855–860. doi: 10.1038/nnano.2009.333. [DOI] [PMC free article] [PubMed] [Google Scholar]
- 20.Razansky D, Distel M, Vinegoni C, Ma R, Perrimon N, Köster RW, Ntziachristos V. Multispectral opto-acoustic tomography of deep-seated fluorescent proteins in vivo. Nat Photon. 2009;3:412–417. [Google Scholar]
- 21.Kim JW, Galanzha EI, Shashkov EV, Moon HM, Zharov VP. Golden carbon nanotubes as multimodal photoacoustic and photothermal high-contrast molecular agents. Nat Nanotechnol. 2009;4:688–694. doi: 10.1038/nnano.2009.231. [DOI] [PMC free article] [PubMed] [Google Scholar]
- 22.Zharov VP. Ultrasharp nonlinear photothermal and photoacoustic resonances and holes beyond the spectral limit. Nat Photon. 2011;5:110–116. doi: 10.1038/nphoton.2010.280. [DOI] [PMC free article] [PubMed] [Google Scholar]
- 23.Galanzha EI, Shashkov EV, Spring PM, Suen JY, Zharov VP. In vivo, Noninvasive, Label-Free Detection and Eradication of Circulating Metastatic Melanoma Cells Using Two-Color Photoacoustic Flow Cytometry with a Diode Laser. Cancer Res. 2009;69:7926–7934. doi: 10.1158/0008-5472.CAN-08-4900. [DOI] [PMC free article] [PubMed] [Google Scholar]
- 24.Petrov YY, Petrova IY, Patrikeev IA, Esenaliev RO, Prough DS. Multiwavelength optoacoustic system for noninvasive monitoring of cerebral venous oxygenation: a pilot clinical test in the internal jugular vein. Opt Lett. 2006;31:1827–1829. doi: 10.1364/ol.31.001827. [DOI] [PubMed] [Google Scholar]
- 25.Karpiouk AB, Aglyamov SR, Mallidi S, Shah J, Scott WG, Rubin JM, Emelianov SY. Combined ultrasound and photoacoustic imaging to detect and stage deep vein thrombosis: phantom and ex vivo studies. J Biomed Opt. 2008;13:054061. doi: 10.1117/1.2992175. [DOI] [PubMed] [Google Scholar]
- 26.Wang B, Su JL, Amirian J, Litovsky SH, Smalling R, Emelianov S. Detection of lipid in atherosclerotic vessels using ultrasound-guided spectroscopic intravascular photoacoustic imaging. Opt. Express. 2010;18:4889–4897. doi: 10.1364/OE.18.004889. [DOI] [PMC free article] [PubMed] [Google Scholar]
- 27.Viengerov ML, Gerlovin YI. Pankratov NA Optica I Spetroscopia (Russian) 1956;1:1023–1028. [Google Scholar]
- 28.Tadashi A, Mikio K. Impulsive optic-acoustic effect of CO2, SF6 and NH3 molecules. Jpn. J. Appl. Phys. 1971;10:1303–1310. [Google Scholar]
- 29.Nemova G, Kashyap R. Laser cooling of solids. Rep. Prog. Phys. 2010;73:086501. [Google Scholar]
- 30.Nedosekin DA, Shashkov EV, Galanzha EI, Hennings L, Zharov VP. Photothermal multispectral image cytometry for quantitative histology of nanoparticles and micrometastasis in intact, stained and selectively burned tissues. Cytometry Part A. 2010;77A:1049–1058. doi: 10.1002/cyto.a.20977. [DOI] [PMC free article] [PubMed] [Google Scholar]
- 31.Khodakovskaya MV, de Silva K, Nedosekin DA, Dervishi E, Biris AS, Shashkov EV, Galanzha EI, Zharov VP. Complex genetic, photothermal, and photoacoustic analysis of nanoparticle-plant interactions. Proc Natl Acad Sci USA. 2011;108:1028–1033. doi: 10.1073/pnas.1008856108. [DOI] [PMC free article] [PubMed] [Google Scholar]
- 32.Roggan A, Friebel M, Doerschel K, Hahn A, Mueller GJ. Optical properties of circulating human blood in the wavelength range 400-2500 nm. J Biomed Opt. 1999;4:36–46. doi: 10.1117/1.429919. [DOI] [PubMed] [Google Scholar]
- 33.Meinke M, Müller G, Helfmann J, Friebel M. Optical properties of platelets and blood plasma and their influence on the optical behavior of whole blood in the visible to near infrared wavelength range. J Biomed Opt. 2007;12:014024. doi: 10.1117/1.2435177. [DOI] [PubMed] [Google Scholar]
- 34.Galanzha EI, Tuchin VV, Zharov VP. Advances in small animal mesentery models for in vivo flow cytometry, dynamic microscopy, and drug screening (review) World J Gastroenterol. 2007;13:192–218. doi: 10.3748/wjg.v13.i2.192. [DOI] [PMC free article] [PubMed] [Google Scholar]
- 35.Ataullakhanov FI, Zarnitsyna VI, Kondratovich AYu, Lobanova ES, Sarbash VI. A new class of stopping self-sustained waves: a factor determining the spatial dynamics of blood coagulation. Phys.-Usp. 2002;45:619–636. [Google Scholar]
- 36. http://www.theuniversityhospital.com/stroke/stats.htm.
- 37.van der Worp H B, van Gijn J. Acute Ischemic Stroke. NEJM. 2007;357:572–579. doi: 10.1056/NEJMcp072057. [DOI] [PubMed] [Google Scholar]
- 38.Feigin VL, Lawes CM, Bennett DA, Anderson CS. Stroke epidemiology: a review of population-based studies of incidence, prevalence, and case-fatality in the late 20th century. Lancet Neurol. 2003;2:43–53. doi: 10.1016/s1474-4422(03)00266-7. [DOI] [PubMed] [Google Scholar]
- 39.Abbott AL. Medical (nonsurgical) intervention alone is now best for prevention of stroke associated with asymptomatic severe carotid stenosis: results of a systematic review and analysis. Stroke. 2009;40:e573–e583. doi: 10.1161/STROKEAHA.109.556068. [DOI] [PubMed] [Google Scholar]
- 40.Horstman LL, Jy W, Bidot CJ, Nordberg ML, Minagar A, Alexander JS, Kelley RE, Ahn YS. Potential roles of cell-derived microparticles in ischemic brain disease. Neurol Res. 2009;31:799–806. doi: 10.1179/016164109X12445505689526. [DOI] [PubMed] [Google Scholar]
- 41.Nedosekin DA, Sarimollaoglu M, Shashkov EV, Galanzha EI, Zharov VP. Ultra-fast photoacoustic flow cytometry with a 0.5 MHz pulse repetition rate nanosecond laser. Opt. Express. 2010;18:8605–8620. doi: 10.1364/OE.18.008605. [DOI] [PMC free article] [PubMed] [Google Scholar]
- 42.Zharov VP, Galanzha EI, Menyaev Yu, Tuchin VV. In vivo high-speed imaging of individual cells in fast blood flow. J. Biomed. Opt. 2006;11:054034. doi: 10.1117/1.2355666. [DOI] [PubMed] [Google Scholar]


