

Abstract
Neurogenesis in the dentate gyrus has been implicated in cognitive functions, including learning and memory, and may be abnormal in major neuropsychiatric disorders, such as depression. Dentate neurogenesis is regulated by interactions between extrinsic factors and intrinsic transcriptional cascades that are currently not well understood. Here we show that Tbr2 (also known as Eomes), a T-box transcription factor expressed by intermediate neuronal progenitors (INPs), is critically required for neurogenesis in the dentate gyrus of developing and adult mice. In the absence of Tbr2, INPs are depleted despite augmented neural stem cell (NSC) proliferation, and neurogenesis is halted as the result of failed neuronal differentiation. Interestingly, we find that Tbr2 likely promotes lineage progression from NSC to neuronal-specified INP in part by repression of Sox2, a key determinant of NSC identity. These findings suggest that Tbr2 expression in INPs is critical for neuronal differentiation in the dentate gyrus and that INPs are an essential stage in the lineage from NSCs to new granule neurons in the dentate gyrus.
Introduction
The dentate gyrus (DG) is one of only two regions in the brain in which neurogenesis persists throughout adult life. Neurogenesis in this region is thought to be involved in learning and memory and may have a role in the regulation of emotional behaviors (Dranovsky and Hen, 2006; Jessberger et al., 2009; Revest et al., 2009; Deng et al., 2010). Progenitor cells in the DG are located in the subgranular zone (SGZ) neurogenic niche adjacent to the granule cell layer (GCL). Within the SGZ, neural stem cells (NSCs) (type-1 and type-2a cells) generate intermediate neuronal progenitors (INPs) (type-2b and type-3 cells) that, in turn, give rise to newborn granule neurons, a population of glutamatergic cells that reside in the GCL (Kempermann et al., 2004). Despite great interest in adult neurogenesis, little is known about factors that regulate NSC maintenance and proliferation in the DG. Recent studies suggest that some factors implicated in NSC regulation during DG development, such as the Wnt, Shh, and Notch signaling pathways, have continuing roles in the adult DG (Lie et al., 2005; Breunig et al., 2007; Favaro et al., 2009; Kuwabara et al., 2009; Ables et al., 2010).
Recent reports suggest that INPs may have a critical role in regulating self-maintenance of the upstream NSC pool in the SGZ, because loss of these cells profoundly impacts the proliferative characteristics of DG NSCs (Lavado et al., 2010). Previous work from our laboratory and others showed that INPs in the developing and adult DG characteristically and specifically express the transcription factor (TF) Tbr2 (Hodge et al., 2008; Roybon et al., 2009), indicating that Tbr2 may have particular functions within these INPs. Interestingly, Tbr2 is also expressed in INPs in the embryonic cerebral neocortex (Englund et al., 2005) and in the adult subventricular zone (SVZ) neurogenic niche (Brill et al., 2009). In embryonic neocortex, in which the functions of Tbr2 have been better delineated, loss of Tbr2 in INPs has been shown to modulate INP proliferation, leading to reduced neurogenesis of neocortical pyramidal neurons (Arnold et al., 2008; Sessa et al., 2008), perhaps suggesting that Tbr2 may have similar roles in DG INPs. Here we determined the actions of Tbr2 in INPs using conditional gene ablation in embryonic, postnatal, and adult DG. Our results indicate that, similar to its role in embryonic neocortex, Tbr2 ablation leads to decreased granule cell neurogenesis resulting from INP depletion and failed terminal neuronal differentiation. Furthermore, we show that loss of Tbr2 in INPs has additional novel functions in DG. Specifically, we demonstrate that functional inactivation of Tbr2 consistently results in increased proliferation of NSCs (Sox2+/Ki67+ cells). In particular, Tbr2 ablation results in increased proliferation of typically quiescent radial type-1 NSCs, as well as horizontal type-2a NSCs, with accumulation of the latter attributable to concurrent impaired neuronal differentiation. Finally, we present evidence that Tbr2 is enriched at T-box binding sites in the Sox2 locus and may suppress Sox2 expression, suggesting that Tbr2 may promote progression from multipotent NSC to neuronal-specified INP by directly regulating Sox2.
Materials and Methods
Animals.
Tbr2flox/flox, Nestin–Cre, Nestin–CreERT2, Z/EG, bacterial artificial chromosome (BAC) Tbr2–GFP, and Nestin–GFP mice were described previously (Tronche et al., 1999; Novak et al., 2000; Mignone et al., 2004; Imayoshi et al., 2006; Kwon and Hadjantonakis, 2007; Intlekofer et al., 2008). All mice were maintained on a C57BL/6 background, with the exception of BAC Tbr2–GFP mice, which were on a CD1 background. Animals were housed in an Association for Assessment and Accreditation of Laboratory Animal Care-approved facility at Seattle Children's Research Institute (SCRI). The Institutional Animal Care and Use Committees at SCRI and the University of Washington approved animal procedures. Both male and female mice were used in these studies. Embryonic animals were generated by timed matings, with the day of the vaginal plug considered embryonic day 0.5 (E0.5), and collected as described previously (Englund et al., 2005). Postnatal and adult animals were anesthetized with Avertin (Sigma) and transcardially perfused with 4% paraformaldehyde (PFA). For experiments using embryonic mice, controls were Nestin–Cre;Tbr2flox/+;Nestin–GFP and Tbr2 conditional knock-outs (Tbr2 cKO) were Nestin–Cre;Tbr2flox/flox;Nestin–GFP. For postnatal experiments (P19), control mice were Nestin–CreERT2;Tbr2flox/+;Z/EG, and inducible conditional Tbr2 knock-out animals were Nestin–CreERT2;Tbr2flox/flox;Z/EG (Tbr2 icKO). For experiments with adult animals, controls were Nestin–CreERT2;Tbr2flox/+, whereas Tbr2 icKOs were Nestin–CreERT2;Tbr2flox/flox.
Tamoxifen treatment.
Tamoxifen (TAM) (Sigma) was dissolved in corn oil (Thermo Fisher Scientific) at a concentration of 25 mg/ml. For postnatal mice, TAM (180 mg/kg) was given subcutaneously on P5 and P6, and animals were collected on P19. Control animals used for experiments at P19 always received TAM to induce recombination of the Z/EG Cre reporter. For experiments with adult mice, 8-week-old mice received five TAM doses at 180 mg · kg−1 · d−1 delivered intraperitoneally on consecutive days and were then allowed to rest for 1 week. After 1 week, animals received two additional TAM injections (180 mg · kg−1 · d−1) on consecutive days. Animals were collected at 12 postnatal weeks (P12W), P14W, and P18W, 14, 30, and 60 d, respectively, after the last TAM dose. For experiments with adult animals, control mice were treated with either TAM or vehicle (corn oil), whereas Tbr2 icKO mice always received TAM treatment. No difference was observed between adult TAM- and oil-treated controls with regards to the number of NSCs, INPs, and neuroblasts, so these animals were grouped together. For BrdU pulse-chase experiments, adult animals were injected intraperitoneally with 100 mg/kg BrdU on 2 consecutive days at the end of TAM dosing and were collected at P14W.
Tissue preparation and immunohistochemistry.
Brains of embryonic animals were removed from the skull and placed in 4% PFA for 2 h, transferred to 30% sucrose, and stored at 4°C. Brains were sectioned at 20 μm on a cryostat on Superfrost Plus glass slides (Thermo Fisher Scientific) and kept at −80°C. Postnatal brains were fixed for 2 h after perfusion with 4% PFA, sectioned at 40 μm free floating, and transferred to cryoprotectant solution, as described previously (Hodge et al., 2008). Adult brains were fixed for 2 h or overnight in 4% PFA and sectioned at 40 μm free floating. Primary antibodies are listed in Table 1, and sections were processed as described previously (Hodge et al., 2008).
Table 1.
List of primary antibodies used in the present study
| Primary antibody | Concentration | Source |
|---|---|---|
| Rabbit anti-Tbr2 | 1:1000 | R. F. Hevner (used in immunohistochemical experiments) |
| Rabbit anti-Tbr2 | 1:1000 | Abcam (used in ChIP experiment) |
| Rabbit anti-Prox1 | 1:500 | S. Pleasure |
| Rabbit anti-AC3 | 1:500 | Cell Signaling Technologies |
| Rabbit anti-Ki67 | 1:500 | Vector Laboratories |
| Rabbit anti-Blbp | 1:500 | Abcam |
| Rabbit anti-Gfap | 1:1000 | Dako |
| Rabbit anti-Olig2 | 1:500 | Millipore |
| Goat anti-Sox2 | 1:400 | Santa Cruz Biotechnology |
| Goat anti-NeuroD1 | 1:400 | Santa Cruz Biotechnology |
| Goat anti-DCX | 1:400 | Santa Cruz Biotechnology |
| Mouse anti-reelin | 1:1000 | Calbiochem |
| Mouse anti-Ascl1 | 1:100 | BD Biosciences |
| Mouse anti-NeuN | 1:1000 | Millipore |
| Rat anti-BrdU | 1:500 | Accurate |
| Rat anti-Ctip2 | 1:500 | Abcam |
| Chicken anti-GFP | 1:500 | Abcam |
Cell counting.
For embryonic tissues (n = 3 per group), cell densities were determined using every 10th 20 μm section. Images were obtained using a Carl Zeiss LSM 710 confocal microscope (40×, 1.3 NA oil-immersion objective). Cells intersecting the top plane of focus were excluded from counts, and total cell numbers were divided by the total counting area to give the number of cells per square millimeter. For postnatal and adult tissues, cell counts were conducted as described previously (Hodge et al., 2008) on at least three animals per group. Briefly, counts were conducted on every sixth 40 μm section through the entire rostrocaudal extent of the DG (−0.94 to −3.80 mm from bregma) using a modification of the optical disector principle (Hodge et al., 2008). For counts of radial and horizontal NSCs, Z/EG GFP+/Ki67+/Sox2+ radial NSCs were defined as having cell body located in the SGZ and a radial process extending through the GCL. Z/EG GFP+/Ki67+/Sox2+ horizontal NSCs had a cell body in the SGZ but lacked a clear radial process and instead had short horizontal processes.
Live-cell two-photon microscopy.
Tbr2–GFP BAC transgenic reporter mice were anesthetized with isoflurane and decapitated. Brains were rapidly dissected in ice-cold ACSF and sectioned on a vibratome at 300 μm. Slices were placed in an imaging chamber on an Olympus FV1000 multiphoton microscope and imaged using a 25×, 1.05 NA water-immersion objective (Olympus). Images were acquired every 10 min, and post-processing was conducted using Imaris software (Bitplane).
Plasmids and retrovirus production.
Full-length mouse Tbr2 cDNA (Open Biosystems) was subcloned into the pMES vector (B. R. Nelson, University of Washington, Seattle, WA) containing an ires–GFP fragment. The Tbr2–ires–GFP sequence from pMES was then subcloned into the CAG retroviral backbone (F. H. Gage, Salk Institute, La Jolla, CA). CAG–GFP virus (F. H. Gage) served as a control. Viruses were produced using Phoenix-gp cells (Nolan Laboratories), pseudotyped with vesicular stomatitis virus-glycoprotein, and concentrated using serial ultracentrifugation as described previously (Zhao et al., 2006).
Adult hippocampal NSC cultures.
Adherent monolayer adult hippocampal NSC cultures were generated as described previously (Ray and Gage, 2006) from 12-week-old C57BL/6 mice and maintained in proliferating culture conditions with DMEM/F-12 (Omega Scientific), 20 ng/ml FGF2 (Peprotech), and 20 ng/ml EGF (Peprotech).
For retroviral experiments, cells were plated on glass coverslips at a density of ∼105 cells per well in 24-well culture plates. Cultures were transduced with appropriate viruses (CAG–GFP or CAG–Tbr2–ires–GFP) 18 h after plating, maintained in proliferating conditions for 2.5 d, and then fixed and processed for immunohistochemical detection of antigens. Counts were conducted on five coverslips per group per on four separate, randomly chosen fields (40×) per coverslip.
Identification of T-box binding sites in Sox2 locus and chromatin immunoprecipitation.
Sox2 gene sequences were scanned for evolutionary conserved regions (ECRs) from aligned vertebrate genomes using the ECR Browser (Ovcharenko et al., 2004) as described previously (Bedogni et al., 2010). Potential Tbr2 binding sites were identified using TRANSFAC Professional version 10.2 library of position-weight matrices (Wingender et al., 1996). The Tbx5 matrix was used, as it is representative of T-box binding sites. PCR primers were designed to candidate T-box binding sites and adjacent sequences. PCR primers amplifying a region in the Sox2 exon (primer set 9) served as negative control. Primer sequences are provided in Table 2.
Table 2.
Primer sequences for Sox2 locus ChIP
| Primer | 5′ Primer | 3′ Primer |
|---|---|---|
| 1 | AACCGTGATGCCGACTAGAA | GAAGCGCCTAACGTACCACT |
| 2 | CTTGTGTCAGGGTTGGGAGT | GAGTCCTCTGCCCATGTAGC |
| 3 | CCTCGCTTAACCTCCCACTT | AACCGAGGAGGATGGAAGAT |
| 4 | GCACAGTCGACAGTTCTTGC | ACTGTCCATTGGCTGGAGTT |
| 5 | GCAGCTTAGGCGCTAACGTA | TAAATCTGTGCAGCCAACCA |
| 6 | CTCAAATGCAGATGCAGGAG | GAAGCCTTAACTGCCAAGCA |
| 7 | GGCAGATACCCTTGTGAACG | TCCTTCCACTCTCTTGTTGGA |
| 8 | TCCGTGTAGCGACAACAAGA | CAGGCTGTGGGAGAATGG |
| 9 | CTCTGCCAGCTTCCTGAAAT | CAAGACGACAGCTCCTTTCC |
| 10 | TCAGGAGTTGTCAAGGCAGA | CTCGGGCTCCAAACTTCTCT |
| 11 | CAAGATGCACAACTCGGAGA | CTCCGGGAAGCGTGTACTTA |
| 12 | ATCTCTGCAGCTGGTACACG | AATGTGATGAGAGCGCACAA |
| 13 | GCGCTACCCATTTCATTAGG | CCTCGGAAAGAAGTCACAGG |
| 14 | CGGCTCTGTTATTGGAATCAG | CAGGCATAATTTCAGTGTCCA |
| 15 | ACTGGGAACTTGGCAGTCAG | CACCTTGGTGTCACCCTCTT |
| 16 | TAACGTCAAACGCTTCGTTG | CGGAGCCAACTTATGAAACC |
Primer numbers correspond to those illustrated in the schematic diagram of the Sox2 locus in Figure 6.
For chromatin immunoprecipitation (ChIP), NSCs were transduced with CAG–Tbr2–ires–GFP retrovirus and maintained in proliferating conditions for 2.5 d. Chromatin was isolated from cells, and samples were prepared using the EZ ChIP kit (Millipore) according to the recommendations of the manufacturer. To immunoprecipitate cross-linked protein–DNA complexes, 5 μg of rabbit anti-Tbr2 antibody (Abcam) was used. Negative controls were prepared using an antibody against rabbit IgG (Millipore), and ChIP with an antibody against acetylated histones (EZ ChIP kit; Millipore) was used as a positive control. Quantitative PCR (qPCR) was conducted using Power SYBR Green Master Mix (Applied Biosystems). Data were normalized to IgG-negative controls, and fold enrichments relative to the Sox2 exon-negative control sequence were calculated.
Ex utero electroporation.
E16.5 embryos were harvested into cold HBSS (Invitrogen). The following plasmids were separately injected into the ventricles of individual embryos: ires–GFP control, Tbr2–ires–GFP, Tbr2–VP16 (Ryan et al., 2004), and Tbr2-engrailed (enR) (Ryan et al., 2004). Embryos were electroporated with paddle electrodes across the cerebrum, targeting the developing hippocampal field. After electroporation, brains were dissected, sliced at 250 μm, and cultured on Millicell inserts (Millipore) for 48 h. Slices were fixed briefly in 4% PFA and immunostained for GFP and Sox2. Colocalization of signals and cell counting was done using a confocal microscope. For each plasmid, cell counts were conducted on five separate slices using a 40× oil-immersion lens on the Carl Zeiss confocal LSM. At least 100 cells were counted for each group.
Statistical analyses.
Statistical analyses were conducted using either ANOVA with Bonferroni's post hoc analysis or a two-sample t test when appropriate and as indicated using SPSS statistical software (IBM). Differences were considered statistically significant at p < 0.05.
Results
Tbr2 is expressed in INPs in the DG throughout development
We first examined expression of Tbr2 protein at multiple stages of development. Consistent with previous studies of the developing hippocampus (Li et al., 2009), we found that Tbr2 protein was expressed in INPs throughout the course of DG development (Fig. 1A–F10). By E14.5, the dentate neuroepithelium (DNe) was present as a region of strong Nestin–GFP expression adjacent to the cortical hem, which had weak expression of Nestin–GFP (Fig. 1A). On E14.5, Tbr2+ INPs populated the SVZ adjacent to the DNe and were typically Nestin–GFP− (Fig. 1A,A1). These Tbr2+ INPs were abundant during all early embryonic stages of DG development (Fig. 1B,B1) and could be seen exiting the SVZ and migrating to the DG via the dentate migratory stream (DMS) to form the previously described subpial neurogenic zone (SPNZ), a transient neurogenic compartment present in the developing DG between E18.5 and P7 (Li et al., 2009). By P3 (Fig. 1C,C1), Tbr2+ INPs were abundant in the SPNZ, and their subsequent redistribution from this temporary neurogenic zone to form the SGZ was apparent by P7 (Fig. 1D,D1,E). Using a BAC transgenic Tbr2–GFP reporter mouse (Kwon and Hadjantonakis, 2007), we found that, although endogenous Tbr2 is transiently expressed, most if not all of the granule neurons populating the GCL of the DG were GFP+ on P7, reflecting persistent expression of stable GFP protein, suggesting that the majority of granule neurons were derived from a Tbr2-expressing lineage (Fig. 1E). Live-cell multiphoton time-lapse imaging of slice cultures from Tbr2–GFP mice revealed the dynamics of Tbr2+ INPs during DG development. These experiments demonstrated that Tbr2+ INPs actively proliferate while migrating in the DMS en route to the DG (Fig. 1F–F10, arrowheads illustrate a cell dividing over a period of 90 min), confirming that Tbr2 is expressed in dividing INPs in the developing DG.
Figure 1.

Expression of Tbr2 protein throughout DG development. Tbr2 protein is expressed in INPs throughout DG development (red, A–D; grayscale A1–D1) in wild-type mice (C57BL/6). A, A1, The DNe appears adjacent to the cortical hem (CH) by E14.5. Tbr2+ cells are located in the DNe and adjacent dentate SVZ at this time. B, B1, Tbr2+ INPs exit the DG ventricular zone (VZ) and migrate along the DMS to the forming DG on E15.5. C, C1, By P3, Tbr2+ INPs are localized to the SPNZ around the pole of the DG. D, D1, These INPs translocate to the SGZ by P7. E, Live imaging of BAC Tbr2–GFP transgenic mice at P7 shows that the majority of cells in the GCL are derived from a Tbr2-expressing lineage. Continued migration along the DMS to the developing GCL is apparent at this time. Time-lapse imaging of the area of the DMS outlined in the dashed white box in E is shown at higher magnification in F. The dashed white box in F depicts a Tbr2–GFP+ cell undergoing mitosis in the DMS. High-magnification images of the cell outlined in F were acquired every 10 min as shown in F1–F10. Arrowheads in F1–F10 depict the cell undergoing mitosis to form two new Tbr2–GFP+ daughter cells over the course of 90 min, confirming that Tbr2 is expressed in rapidly diving progenitors. HF, Hippocampal fissure; FDJ, fimbriodentate junction. Scale bars: A, B, 100 μm; C–E, 50 μm; F, 20 μm; F10, 15 μm.
Increased NSC proliferation and impaired neurogenesis in Tbr2 cKO mice during DG development
To determine the role of Tbr2 in DG INPs during development, we examined NSC proliferation and granule neurogenesis in control and Tbr2 cKO mice, in which Tbr2 was conditionally ablated using Nestin–Cre on E11.5. NSCs express the TF Sox2 and strongly express Nestin–GFP (Suh et al., 2007; Li et al., 2009; Lugert et al., 2010). We examined these markers in control and Tbr2 cKO mice at E16.5 when many NSCs and INPs exit the DNe and migrate along the DMS to the DG. At E16.5, markedly increased numbers of proliferating (Ki67+) cells were apparent in the DMS in Tbr2 cKO mice (Fig. 2A–A2,B–B2) and many Ki67+ cells coexpressed Nestin–GFP, suggestive of increased NSC proliferation. The total number of Nestin–GFP+ cells likewise increased within an expanded DMS in Tbr2 cKO mice at E16.5 (Fig. 2A2,B2). The increased abundance of proliferating cells in Tbr2 cKO mice was attributed to an increase in Sox2+ cells in the DMS (Fig. 2C–C2,D–D2), indicative of increased NSC numbers in mutant mice. Quantification of the number of Sox2+ cells revealed a significant (203%, p < 0.001; Fig. 2) increase in Sox2+ cells/mm2 in Tbr2 cKO mice at E16.5. Correspondingly, there were significant increases in Ki67+ cells/mm2 (200%, p < 0.001) and in Sox2+/Ki67+ cells/mm2 (242%, p < 0.001) in Tbr2 cKO mice at E16.5 (Fig. 2E–G). This increase in proliferating NSCs (Sox2+/Ki67+) persisted to postnatal ages in Tbr2 cKO mice (218%, P0; 155%, P3), as did the increases in total Sox2+ cells/mm2 (137%, P0; 130%, P3) and total Ki67+ cells/mm2 (200%, P0; 162%, P3). The DMS remained expanded in Tbr2 cKO mice at P0 and was occupied by increased numbers of Nestin–GFP+/Sox2+ cells, confirming augmented NSC number in neonatal mutant mice (Fig. 2J1,K1). However, the number of NeuroD1+ INPs and neuroblasts was markedly reduced in neonatal Tbr2 cKO, indicating decreased granule neurogenesis and loss of INPs in the absence of Tbr2 expression (Fig. 2H–I1). Correspondingly, the number of Prox1+ neuroblasts was decreased in the DG of mutant mice at P0, with only a few Prox1+ cells occupying a reduced upper blade of the DG at this time (Fig. 2J2,K2), consistent with decreased granule neuron differentiation.
Figure 2.

Increased NSC proliferation and impaired neurogenesis in Tbr2 cKO mice during DG development. A–B2, Increased numbers of Ki67+ and Nestin–GFP+ (NesGFP) progenitor cells are apparent in the DMS and DG in Tbr2 cKO mice (Nestin–Cre;Tbr2flox/flox;Nestin–GFP). VZ, Ventricular zone. Sox2+ cells are increased in the DMS of Tbr2 cKO mice (D–D2) at E16.5 compared with control animals (Nestin–Cre;Tbr2flox/+;Nestin–GFP) (C–C2). Sox2+ cells are increased across multiple ages (E16.5 to P3) in Tbr2 cKO mice (E, red bars) compared with control animals (E, gray bars; ANOVA, n = 3). Ki67+ cells (F) and Ki67+/Sox2+ cells (G) are also significantly increased in Tbr2 cKO mice between E16.5 and P3 (ANOVA, n = 3). H–I1, By P0, the number of NeuroD1+ INPs (type-3 cells) is notably reduced in the DG of Tbr2 cKO mice. J–K3, On P0, the DMS remains visibly expanded in Tbr2 cKO mice, and increased numbers of Nestin–GFP (NesGFP) and Sox2+ cells are readily apparent. At this time, the number of Prox1+ cells is reduced in the forming upper blade of the DG in Tbr2 cKO mice (K2) compared with controls (J2), indicating reduced granule neurogenesis in mutant mice. Scale bar: A, H, 100 μm; J, 50 μm. Graphs represent the mean ± SEM for each group. ***p < 0.001.
Tbr2 is required for postnatal and adult hippocampal neurogenesis
To examine the functions of Tbr2 during postnatal and adult granule neurogenesis, we used a Nestin–CreERT2 inducible conditional knock-out strategy (Tbr2 icKO). Conditional ablation of Tbr2 during postnatal development was achieved by TAM treatment initiated on P5 and analysis on P19 (Fig. 3A). In control animals, Tbr2 protein expression was noted in the SGZ as expected (Fig. 3B,B1), whereas TAM treatment effectively eliminated Tbr2 protein expression from the SGZ of Tbr2 icKO mice by P19 (Fig. 3C,C1). Postnatal inactivation of Tbr2 resulted in severely reduced neurogenesis in the DG. New neuroblasts, visualized using NeuroD1, Prox1, and calretinin, were abundant in control animals but were almost completely absent from the SGZ of Tbr2 icKO mice by P19 (Fig. 3D–G). Tbr2 icKO mice exhibited loss of late-stage (type-3) INPs as evidenced by decreased NeuroD1 expression in the SGZ (Fig. 3D,E), suggesting that reduced granule neurogenesis resulted from failure of NSCs to differentiate to produce INPs and postmitotic neuroblasts. Using a LacZ–eGFP (Z/EG) Cre reporter animal, we tracked the fates of cells undergoing Cre-mediated recombination (i.e., GFP+ cells) in the GCL. We found that many GFP+ cells coexpressed NeuroD1 (Fig. 3D) and Prox1 (Fig. 3F) in controls, consistent with late-stage INPs and newborn granule cells. Conversely, very few GFP+ cells were NeuroD1+ (Fig. 3E) or Prox1+ (Fig. 3G) in Tbr2 icKO mice, consistent with loss of INPs and decreased neurogenesis. To quantify the decrease in neurogenesis in mutant animals, we determined the number of new neurons (GFP+/NeuN+) produced in control and mutant animals (Fig. 3H–I1). We found that the total number of new neurons (GFP+/NeuN+ cells) was severely decreased to ∼7% of control value (4048 ± 525 GFP+/NeuN+ cells) in Tbr2 icKO mice (288 ± 123 GFP+/NeuN+ cells; t test, p < 0.01). Accordingly, the proportion of GFP+/NeuN+ cells decreased in Tbr2 icKO mice (Fig. 3I,I1; 5.58 ± 1.99% of total GFP+ cells), consistent with reduced granule neuron generation, whereas a much larger proportion of GFP+ cells in controls were NeuN+ (48.32 ± 3.73%), indicating that most became new granule neurons (Fig. 3H,H1). Despite reduced neurogenesis, there was no evidence of increased gliogenesis in Tbr2 icKO mice. We did note the presence of some GFP+ cells with glial morphology in the hilus of Tbr2 icKO mice (Fig. 3C,E,G), although these cells were often present in controls as well (Fig. 3B,F). These observations led us to quantify the proportion of Olig2+/GFP+ cells and GFP+ cells with astrocytic morphology present in the hilus in Tbr2 icKO mice and controls at P19. We found that the proportion of GFP+ cells in the DG coexpressing Olig2 did not significantly differ between groups (control, 3.36 ± 2.17%; Tbr2 icKO, 6.41 ± 0.41%; t test, p = 0.08) nor did the proportion of hilar GFP+ cells with astrocytic morphology (control, 23.93 ± 5.19%; Tbr2 icKO, 32.17 ± 4.58%; t test, p = 0.30).
Figure 3.

Ablation of Tbr2 results in loss of INPs and impairs postnatal and adult neurogenesis. A, TAM was administered to mice on P5 and P6, and animals were collected on P19. In control mice (Nestin–CreERT2;Tbr2flox/+;Z/EG), Tbr2 protein is present in the SGZ as expected (B, B1), whereas in Tbr2 icKO mice (Nestin–CreERT2;Tbr2flox/flox;Z/EG) it is essentially absent (C, C1). Highlighted regions in dashed boxes in B and C are shown in higher magnification in B1 and C1, respectively. Markers of INPs (NeuroD1) and neuroblasts (Prox1) are almost completely absent in Tbr2 icKO mice (E, G), whereas they are abundant in controls (D, F). Expression of calretinin (CalR) in new neuroblasts in the SGZ is strongly decreased in mutant mice (G, blue), as is expression of Prox1 (G, red). Use of a reporter strain to monitor the fate of recombined cells (Z/EG, GFP+ cells) shows reduced GFP+ cells with neuronal morphology in Tbr2 icKO mice (C, E, G, I), and fewer GFP+ cells are NeuroD1+ (E) or Prox1+ (G) in mutant mice. At P19, most GFP+ cells are NeuN+ new neurons in control mice (H; region highlighted in dashed box is shown in high magnification in H1), whereas very few GFP+ cells colocalize with NeuN in mutant mice (I, I1, arrows). High-magnification image of cells in Tbr2 icKO mice shows that most GFP+ cells do not have typical neuronal morphology (I1), whereas many GFP+ cells have typical granule neuron morphology in controls (H, H1, arrows). J, Schematic diagram of TAM and BrdU administration to adult mice. After administration of TAM, adult animals were collected at P12W, P14W, and P18W. K–L1, Tbr2 protein expression is present in the SGZ of control animals (Nestin–CreERT2;Tbr2flox/+) at P12W (K, K1, arrows) but is essentially absent from Tbr2 icKO mice (Nestin–CreERT2;Tbr2flox/flox) at this time (L, L1). M–O1, DCX staining of type-3 INPs and new neuroblasts in the SGZ remains consistent between P12W and P18W in control mice, with only a slight apparent reduction attributable to an age-related decline in neurogenesis (M–O, arrows). In Tbr2 icKO mice, DCX+ INPs and neuroblasts are reduced by P12W and continue to decline through P14W (M1–N1, arrows). By P18W, very few DCX+ INPs and neuroblasts remain in Tbr2 icKO mice (O1). P, P1, By P14W, NeuroD1+ INPs and neuroblasts are depleted from the SGZ in Tbr2 icKO mice. Q, Quantification of the total number of NeuroD1+ cells in control and mutant animals confirms decreased numbers of INPs and neuroblasts in Tbr2 icKO mice at P12W and P14W (n = 3, ANOVA, p < 0.01). R–T, BrdU pulse-chase (administered according to the schedule in J) shows that, in control mice, most BrdU+ cells colocalize with NeuN at P14W (R), whereas the proportion of BrdU+ cells coexpressing NeuN is reduced in Tbr2 icKO mice (S, T, orange bars; t test, p < 0.01, n = 4). U, Quantification of the total number of AC3 shows that the number of cells undergoing apoptosis in the SGZ does not differ between control and Tbr2 icKO mice at any stage examined (P19, P12W, P18W; ANOVA, p > 0.05, n = 3). Graphs represent the mean ± SEM for each group. **p < 0.01. Scale bars: B, D, H, K, M, P, 50 μm; B1, H1, K1, 20 μm; R, 100 μm.
We then examined whether Tbr2 expression was similarly required during adult neurogenesis in the DG (Fig. 3J). TAM was administered to animals exclusively during adult neurogenesis (beginning at P8W, Fig. 3J), and animals were collected at P12W, P14W, and P18W. Consistent with our data at P19, TAM treatment effectively eliminated Tbr2 protein expression from the SGZ by P12W (Fig. 3K–L1). Doublecortin (DCX) immunostaining revealed marked reductions in new neuroblasts in Tbr2 icKO mice by P12W (Fig. 3M,M1). DCX expression declined further at later time points such that it was essentially absent from the DG of Tbr2 icKO mice by P18W (Fig. 3N–O1). Similar to our findings in P19 DG, we found that the number of NeuroD1+ INPs was reduced in adult Tbr2 icKO mice by P12W and progressively declined thereafter (Fig. 3P,P1,Q). Quantitatively, the total number of NeuroD1+ cells was significantly decreased by 67% in P12W DG (ANOVA, p < 0.01; Fig. 3Q) and by 77% in P14W Tbr2 icKO DG (ANOVA, p < 0.001; Fig. 3Q). To examine neurogenesis in the adult DG, we used a BrdU pulse-chase experiment, with BrdU administered after TAM dosing and animals collected at P14W (Fig. 3J). The total number of BrdU+ cells per DG was reduced in Tbr2 icKO mice by 55% (Fig. 3R,S; control, 774 ± 109.4 cells per DG; Tbr2 icKO, 346 ± 110.5 cells per DG; t test, p < 0.05) compared with controls at P14W. We characterized the phenotypes of BrdU+ cells by double immunostaining with DCX (immature neurons) and NeuN (mature neurons). In control animals, 86.68 ± 4.08% of total BrdU+ cells were NeuN+, whereas this number declined to 45.79 ± 0.76% in Tbr2 icKO mice (Fig. 3T). Consistent with downregulation of DCX as newborn granule neurons mature, the percentage of BrdU+ cells coexpressing DCX did not differ significantly between genotypes and represented a small fraction of total BrdU+ cells in both groups (Fig. 3T).
To determine whether the decrease in neurogenesis observed in Tbr2 icKO mice resulted in part from increased cell death in the SGZ, we quantified the total number of activated Caspase-3+ (AC3) cells in control and mutant animals at several time points (Fig. 3U). Interestingly, there was no significant difference in the number of AC3+ cells per DG between control and Tbr2 icKO mice regardless of time point (P19, P12W, P18W). These results suggest that decreased neurogenesis in Tbr2 icKO mice may not result from increased cell death in the SGZ; however, given that apoptotic cells are rapidly cleared by resident microglia in the SGZ (Sierra et al., 2010), it is possible that increased cell death may occur in Tbr2 icKO mice, but demonstrating a quantifiable change may be beyond the temporal resolution of the methods used to measure apoptosis in the present study.
Increased NSCs in postnatal and adult Tbr2 icKO mice
We next aimed to analyze whether conditional inactivation of Tbr2 impacted the proliferation or differentiation of NSCs during postnatal and adult DG neurogenesis. Again using an inducible conditional knock-out strategy (Tbr2 icKO; Fig. 3A,J), we examined expression of the NSC markers Sox2 and Ascl1 (Fig. 4). We began by counting the total numbers of Sox2+ (type-1 and type-2a NSCs and INPs; Fig. 4A–B1) and Ascl1+ (type-1 and type-2a NSCs and INPs; Fig. 4C–D1) cells per DG in mutant mice and controls at P19 (Fig. 4). Remarkably, the total number of Sox2+ cells was significantly increased by 46.5% (p < 0.001; Fig. 4A1–B1,E) in Tbr2 icKO mice, and notable accumulation of Sox2+ cells was apparent in the SGZ of mutant animals. Similarly, Ascl1+ cells increased in number in Tbr2 icKO mice, exceeding control animals by 56.6% (p < 0.001; Fig. 4C–D1,E) and likewise accumulated in the SGZ. We next assessed the fates of Cre-recombined cells (Z/EG GFP+) at P19. In controls, 24.88 ± 3.18% of GFP+ cells were Sox2+, and 3.72 ± 1.25% of GFP+ cells were Ascl1+ (Fig. 4F). In Tbr2 icKO mice, the proportion of GFP+ cells expressing Sox2 was significantly higher (69.72 ± 4.48%; Fig. 4F, p < 0.001), as was the proportion of GFP+ cells expressing Ascl1 (20.10 ± 0.72%; Fig. 4F, p < 0.001). Together, these findings indicated that in the absence of Tbr2, neurogenesis from NSCs was impaired, and NSCs accumulated in the Tbr2-deficient SGZ.
Figure 4.

Proliferation of NSCs is increased after postnatal conditional ablation of Tbr2. A, A1, Most Z/EG GFP+ (Cre recombined) cells are Sox2− in control (Nestin–CreERT2;Tbr2flox/+;Z/EG) mice, consistent with most of these cells being newborn neurons (see Fig. 3). B, B1, In Tbr2 icKO mice (Nestin–CreERT2;Tbr2flox/flox;Z/EG), many GFP+ cells coexpress Sox2, indicating that these cells persist as NSCs in mutant mice. Increased numbers of Sox2+ cells are qualitatively apparent in the SGZ of mutant mice (B, B1, red) versus controls (A, A1, red). C, C1, Ascl1 is discretely expressed in control mice and is present in relatively few GFP+ cells. Consistent with increased Sox2 expression, Ascl1 is also upregulated in the SGZ of Tbr2 icKO mice (D, D1, red), and increased numbers of GFP+ cells coexpress Ascl1 in mutant mice, including some cells with typical radial NSC (type-1) morphology (D1, arrow). E, Quantification of total cell numbers (per DG) shows increased numbers of Sox2+ and Ascl1+ cells (n = 3, ANOVA p < 0.001). F, Correspondingly, Sox2+ and Ascl1+ cells account for a greater proportion of total GFP+ cells in Tbr2 icKO mice compared with controls (n = 3, ANOVA, p < 0.001). G, H, In Tbr2 icKO mice, there is an increase in Ki67+ cells (red) in the SGZ, and many GFP+ cells, including radial NSCs (arrows, H), coexpress Ki67, whereas these cells are extremely rare in control animals (G). I, Quantification of the total number of Sox2+/GFP+ with radial (type-1) NSC morphology shows no significant difference between groups. However, the total number of Sox2+/GFP+ cells with horizontal (type-2a) NSC morphology is significantly increased in Tbr2 icKO mice (I; t test, n = 3). J, The total number of Ki67+/GFP+ cells is significantly increased in Tbr2 icKO mice (n = 3, t test). Similarly, the total number of proliferating (Ki67+/GFP+) cells with radial NSC morphology is increased in Tbr2 icKO mice, as is the total number of Ki67+/GFP+ horizontal NSCs (J; n = 3, t test). K, Correspondingly, Ki67+/GFP+ radial NSCs and horizontal NSCs account for a greater proportion of the total number of Z/EG GFP+ cells in mutant mice (n = 3, t test). A1, B1, C1, and D1 are high-magnification images of regions outlined in dashed boxes in A, B, C, and D. Graphs represent the mean ± SEM for each group. *p < 0.05, **p < 0.01, ***p < 0.001. Scale bars: A, G, 50 μm; A1, 25 μm.
Previous studies have distinguished two types of NSCs in the DG, identified as “quiescent” or “radial” NSCs with a radial process extending through the GCL and “active” or “horizontal” NSCs with short horizontal processes but no radial process (Lugert et al., 2010). To determine whether the accumulation of Sox2+ NSCs in Tbr2 icKO mice was attributable to one or both NSC types, we classified recombined Sox2+/GFP+ cells morphologically and counted the numbers of each cell type in control and mutant animals (Fig. 4G,H). The total number of Sox2+/GFP+ radial NSCs did not differ significantly between groups (Fig. 4I; t test, p > 0.05). However, the total number of Sox2+/GFP+ horizontal NSCs was significantly increased in Tbr2 icKO DG by ∼105% (Fig. 4I; t test, p < 0.01). To determine whether NSC proliferation was elevated in Tbr2 icKO mice, we quantified the total number of Ki67+ cells and found a significant overall 117% increase (t test, p < 0.01) in Tbr2 icKO mice (12,912 ± 639 cells per DG) when compared with controls (5690 ± 575 cells per DG). Next, we counted Ki67+/GFP+ (recombined) cells and classified them by radial or horizontal morphology (Fig. 4G,H,J,K). The total number of Ki67+/GFP+ cells was significantly increased by ∼210% (Fig. 4J; t test, p < 0.01) in the DG of mutant animals. Interestingly, radial Ki67+/GFP+ NSCs, which were rarely observed in control animals, were greatly increased in mutants (Fig. 4H, arrows). In fact, these proliferating radial NSCs were increased more than eightfold in the SGZ of Tbr2 icKO mice versus controls (Fig. 4J; t test, p < 0.05), indicating that more radial NSCs actively proliferated after ablation of Tbr2. Accordingly, these cells, which represented <1% of the total number of Z/EG GFP+ cells in control mice, increased to account for ∼4.8% of total GFP+ cells in Tbr2 icKO mice (Fig. 4K; t test, p < 0.05). Consistent with increased horizontal Sox2+ NSCs in Tbr2 icKO mice, the total number of Ki67+/GFP+ horizontal NSCs was also significantly increased in mutant mice (182% increase; Fig. 4J; t test, p < 0.01). These cells represented a substantially greater proportion of total Z/EG GFP+ cells in mutant mice (31.2 ± 2.6%) than in controls (6.5 ± 0.9%), consistent with increased horizontal NSC proliferation in Tbr2 icKO mice (Fig. 4K; t test, p < 0.01). Thus, the proliferation of both radial and horizontal NSCs was increased in the DG of juvenile (P19) Tbr2 icKO mice.
We next analyzed the proliferation and differentiation of NSCs in Tbr2 icKO mice during adult neurogenesis. Total Ki67+ cells were significantly increased in the SGZ of Tbr2 icKO mice by P12W (57% increase; ANOVA, p < 0.001; Fig. 5A–C) and further increased at P14W (87% increase; ANOVA, p < 0.001; Fig. 5A–C). Somewhat surprisingly, this increase in Ki67+ cells did not decline over time but, rather, was persistent in Tbr2 icKO mice up to at least P18W compared with age-matched controls (136% increase; ANOVA, p < 0.001; Fig. 5C). However, mutant mice did exhibit the normal age-related decrease in SGZ progenitor proliferation typically observed in rodents.
Figure 5.
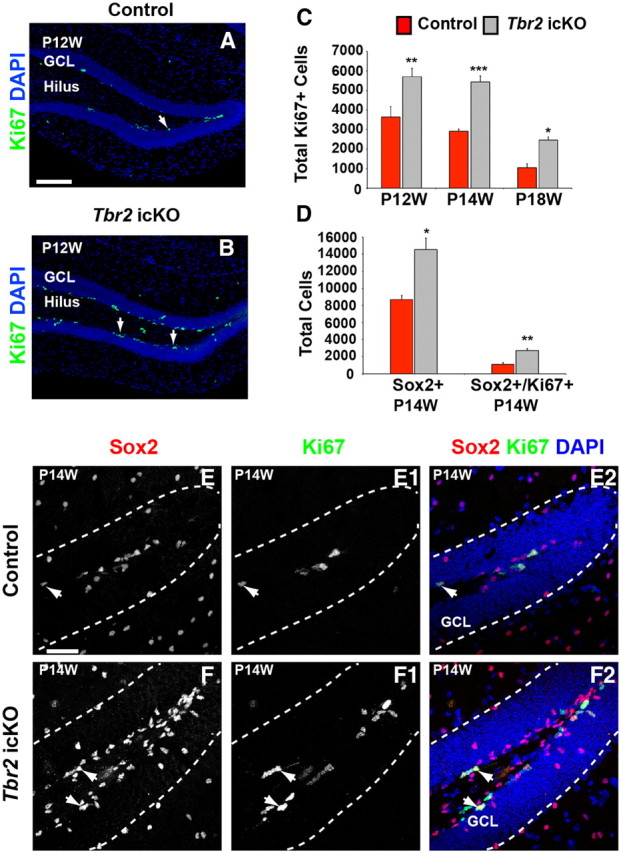
NSC proliferation is increased after conditional Tbr2 ablation during adult neurogenesis. A, B, Ki67+ cells are increased in Tbr2 icKO mice (Nestin–CreERT2;Tbr2flox/flox) (B) compared with controls (Nestin–CreERT2;Tbr2flox/+) (A), indicating increased overall proliferation in mutant mice as early as P12W. C, Quantification of Ki67+ cells in control (red bars) and Tbr2 icKO (gray bars) mice illustrates increased Ki67+ cells on P12W, P14W, and P18W, suggesting persistent upregulation of proliferation in mutant mice (ANOVA, n = 3). D, The total number of Sox2+ NSCs in the SGZ is increased in Tbr2 icKO mice (n = 3, t test, p < 0.05) as is the total number of proliferating Sox2+/Ki67+ cells (n = 3, t test, p < 0.01) at P14W. E–F2, Single-channel images of Sox2+ (E, controls; F, Tbr2 icKO) and Ki67+ (E1, controls; F1, Tbr2 icKO) cells illustrate accumulation of these cell populations in the SGZ of Tbr2 icKO mice at P14W. Merged images (E2, control; F2, Tbr2 icKO, arrows) illustrate increased Sox2+/Ki67+ cells in Tbr2 icKO mice. Graphs represent the mean ± SEM for each group. *p < 0.05, **p < 0.01, ***p < 0.001. Scale bars: A, 100 μm; E, 50 μm.
To determine whether increased proliferation in adult Tbr2 icKO mice led to an increase in the total number of NSCs, we analyzed the number of Sox2+ cells at P14W in mutant and control animals (Fig. 5D–F2). Indeed, the total number of Sox2+ cells was increased >1.5-fold in the SGZ of Tbr2 icKO mice (t test, p < 0.05; Fig. 5D,E–F2), and the density of Sox2+ cells in the SGZ and hilus increased in parallel (Fig. 5E–F2). Additionally, the total number of proliferating Ki67+/Sox2+ cells increased in Tbr2 icKO animals at P14W (142%; t test, p < 0.01; Fig. 5D), indicating augmented proliferation of NSCs in adult mutant mice, consistent with our data at P19.
Overexpression of Tbr2 suppresses expression of Sox2 and Ascl1 proteins in NSCs
To investigate mechanisms of Tbr2 action in NSCs, we began by studying adult hippocampal NSC monolayer cultures. NSCs maintained in proliferating conditions (FGF2 and EGF included in the culture media) were transduced with a retrovirus expressing Tbr2 and GFP (CAG–Tbr2–ires–GFP) or a control GFP retrovirus (CAG–GFP) and examined 2.5 d later. In control cultures, the majority of GFP+ cells (75.5 ± 2.7%) maintained expression of Sox2 protein (Fig. 6A,E). However, only 12.1 ± 3.2% of Tbr2–GFP-expressing cells maintained Sox2 expression (Fig. 6B,E), indicating a significant (t test, p < 0.001) reduction in Sox2+ NSCs after Tbr2 overexpression. Similarly, Ascl1 protein expression was reduced in Tbr2–GFP transduced NSCs, with only 4.9 ± 0.6% of Tbr2–GFP+ cells expressing Ascl1 (Fig. 6D,E) compared with 23.8 ± 2.5% in control GFP+ cells (t test, p < 0.001; Fig. 6C,E).
Figure 6.

Tbr2 suppresses expression of Sox2 and Ascl1 in NSCs and binds the Sox2 locus. A, NSCs transduced with control virus (CAG–GFP) highly express Sox2, and many GFP+ cells are Sox2+ (arrows). B, In NSCs transduced with Tbr2 expressing virus (CAG–Tbr2–ires–GFP), few GFP+/Sox2+ cells are apparent. C, D, Many control GFP+ cells coexpress Ascl1, and very few cells expressing CAG–Tbr2–ires–GFP coexpress Ascl1. E, Quantification of the proportion of GFP+ cells expressing Sox2 and Ascl1 in CAG–GFP (blue bars) and CAG–Tbr2–ires–GFP (purple bars) transduced NSC cultures (n = 5, t test, ***p < 0.001). F, Tbr2 binding is enriched at T-box binding sites (red T) identified in the mouse Sox2 locus. Blue dashes illustrate regions of the Sox2 locus over which primer sets were designed. F, Tbr2 ChIP shows enrichment of Tbr2 at all three candidate T-box binding sites with the highest enrichment at the T-box binding site nearest the Sox2 transcriptional start site. G–K2, Electroporation of constructs expressing control GFP (G, H–H2), Tbr2–VP16 (I–I2), Tbr2–ires–GFP (Tbr2–GFP) (J–J2), or Tbr2–enR (K–K2) was conducted at E16.5, and embryos were examined 2 d later. G, Low-magnification image of the area of the developing hippocampal field targeted during electroporation. H–H2, Many control GFP+ cells coexpress Sox2 protein, as do many of the GFP+ cells electroporated with the activator Tbr2–VP16 construct (I–I2). However, the number of GFP+/Sox2+ cells is significantly reduced in cells expressing either Tbr2–GFP (J–J2) or the repressor Tbr2–enR (K–K2). L, Quantification of the percentage of GFP+ cells expressing Sox2 protein after electroporation with the constructs listed above (ANOVA, p < 0.001, n = 5). Graphs represent the mean ± SEM. ***p < 0.001. Scale bars: A, 25 μm; G, 100 μm; H, 20 μm.
Tbr2 binding is enriched at the Sox2 promoter
Given that Sox2+ NSCs increased after Tbr2 conditional ablation at multiple stages of development (Figs. 2–5) and that Sox2 protein was reduced after retroviral overexpression of Tbr2 in NSCs (Fig. 6), we sought to determine whether Tbr2 might directly bind to the Sox2 promoter. The mouse Sox2 locus was searched using bioinformatics tools for putative T-box (Tbx5) binding sites, and three such sites were located. Two sites were upstream of the Sox2 start codon, ∼2.5 and 1.0 kb, respectively (Fig. 6F), well within the 5.5 kb upstream region that constitutes the Sox2 promoter in NSCs (Suh et al., 2007; Ehm et al., 2010). A third site was located in the 3′ UTR, ∼4.5Kb after the end of exon 1 (Fig. 6F). Locus-style ChIP was conducted to determine in an unbiased manner whether Tbr2 bound specifically to T-box sites in the Sox2 locus. PCR primers were designed to amplify potential T-box sites, as well as a control region within the Sox2 exon (Fig. 6F, primer set 9; Table 2). ChIP was conducted using antibodies against Tbr2 on chromatin from adult hippocampal NSCs transduced with CAG–Tbr2–ires–GFP expressing retrovirus and maintained in proliferating conditions, followed by qPCR using site-specific PCR primers. All three putative T-box sites were enriched in chromatin from Tbr2 ChIP when compared with the exon control region (Fig. 6F) and with IgG negative controls (data not shown). The highest degree of enrichment (more than ninefold) was found at the T-box site just 1.0 kb upstream from the Sox2 start codon (Fig. 6F). We independently confirmed these results with a second antibody against Tbr2 (data not shown). These results suggest that Tbr2 directly associates with the promoter region of Sox2, implying that Tbr2 might be involved in regulating Sox2 in hippocampal NSCs (Figs. 6F, 7).
Figure 7.

Schematic diagram summarizing the effects of Tbr2 knock-out on the stem cell niche in the DG. A, In control animals, type-1 Sox2+ NSCs (green) give rise to Tbr2+ INPs (light green) that in turn produce type-3 INPs (yellow) and neuroblasts, which differentiate into immature granule neurons (orange). Should these cells survive, they ultimately become integrated into the GCL as mature neurons (red). In controls, Tbr2 represses expression of Sox2 as neuronal fate commitment is initiated, as illustrated by the solid line in A connecting these two TFs. The NSC pool is dynamically regulated by INPs and/or neuroblasts as illustrated by the dashed arrows demonstrating feedback from the INPs/neuroblasts onto the NSC pool in A. B, In Tbr2 knock-out animals, Tbr2-mediated repression of Sox2 is absent. NSCs are activated (pink nuclei) at a greater frequency in Tbr2 knock-out mice, resulting in more proliferation of these cells and their subsequent accumulation in the SGZ. In the absence of Tbr2 expression, NSCs fail to differentiate to produce INPs and, accordingly, new granule neurons are not produced.
Sox2 is reduced in the presence of Tbr2 overexpression and repressor constructs in vivo
To determine whether Tbr2 might contribute to the regulation of Sox2 expression in an in vivo context, we compared the effects of overexpression of Tbr2 (Tbr2–GFP) with the effects of expression of Tbr2-repressor (engrailed repressor, Tbr2–enR) or Tbr2-activator (Tbr2–VP16) constructs. Ex utero electroporation was used to target constructs expressing control GFP, Tbr2–GFP, Tbr2–enR (Ryan et al., 2004), or Tbr2–VP16 (Ryan et al., 2004) into the hippocampal field of E16.5 embryos, which were then examined 2 d later (Fig. 6G–K2). The percentage of total GFP+ cells coexpressing Sox2 protein was determined for each group. In control animals, the majority of GFP+ cells coexpressed Sox2 protein (77.4 ± 2.8%; Fig. 6H–H2,L, green bars). Similarly, in embryos electroporated with constitutively active Tbr2–VP16, the majority of GFP+ cells were Sox2+ (65.3 ± 1.2%; Fig. 6I–I2,L). Conversely, in animals electroporated with either Tbr2–ires–GFP or Tbr2–enR, the percentage of GFP+ cells coexpressing Sox2 decreased significantly (Fig. 6J–K2,L; Tbr2–ires–GFP, 18.3 ± 3.7%; Tbr2–enR, 12.2 ± 1.0%; p < 0.001, ANOVA), and the majority of GFP+ cells were Sox2−. These results show that expression of native Tbr2 decreases Sox2 protein expression in vivo, consistent with our finding that Tbr2 overexpression decreased Sox2 expression in NSC cultures. Additionally, our results demonstrate that expression of a Tbr2–enR repressor construct, but not a Tbr2–VP16 activator construct, phenocopies expression of native Tbr2 by similarly decreasing Sox2 expression. Together, these findings support the notion that Tbr2 may promote INP generation and neuronal fate commitment, at least in part, by negatively regulating Sox2.
Discussion
Tbr2 expression is associated with the generation of glutamatergic neurons in developing neocortex, olfactory bulb, and cerebellum, as well as adult SVZ and hippocampus (Hevner et al., 2006; Brill et al., 2009; Hodge and Hevner, 2011). Here we describe the functional roles of Tbr2 in DG neurogenesis. We show that the majority of DG granule neurons are derived from a Tbr2-expressing lineage and that Tbr2 is essential for the generation of INPs (type-2b cells). Additionally, we show that failure to generate INPs in the absence of Tbr2 expression leads to impaired neuronal differentiation. Loss of INPs and neuroblasts after Tbr2 ablation impacts the NSC pool, leading to increased activation of quiescent radial Sox2+ NSCs (Fig. 7). Concomitantly, horizontal Sox2+ NSCs proliferate and accumulate in the SGZ of Tbr2 icKO mice. Finally, Tbr2 not only drives neuronal differentiation but may also promote progression from multipotent NSC to neuronal-specified INP, in part, by decreasing the expression of Sox2 (Fig. 7).
As NSCs divide to generate INPs in the DG, they transition through expression of a number of TFs (Fig. 7A). Although the functions of some of these TFs (e.g., Sox2, NeuroD1, and Prox1) have been well described (Kim et al., 2007; Suh et al., 2007; Gao et al., 2009; Lavado et al., 2010; Lugert et al., 2010; Karalay et al., 2011; Kim et al., 2011), relatively little is known about their downstream targets or about potential direct interactions between TFs that may orchestrate granule neurogenesis. Our finding that Tbr2 is enriched in the Sox2 locus at several putative T-box binding sites may constitute a novel mechanism of action for a TF in regulating the NSC/INP pool in the DG. Although our results do not explicitly demonstrate direct transcriptional regulation of Sox2 by Tbr2 and it is likely that many different factors dynamically regulate Sox2 expression, we do present several pieces of evidence that suggest that Tbr2-mediated regulation of Sox2 may be involved in neuronal lineage commitment in the DG. First, we show that brief overexpression of Tbr2 in NSCs results in a marked decrease in Sox2 protein. Additionally, overexpression of native Tbr2 in vivo results in a similar decrease in Sox2 expression. These results are phenocopied by expression of a Tbr2-repressor construct (Tbr2–enR), which likewise results in decreased Sox2 protein, further implying that Tbr2 impacts Sox2 expression. Previously, we showed that Sox2 and Tbr2 were coexpressed in ∼35% of Tbr2+ cells, most of which were morphologically consistent with horizontal NSCs and type-2a INPs, suggesting that these TFs transiently overlap as NSCs become neuronal lineage specified (Hodge et al., 2008). There is precedent for interaction between a T-box TF and Sox2, because Tbx6 has been shown to negatively regulate Sox2 during mesoderm formation (Takemoto et al., 2011). Furthermore, Tbr2 itself has been shown to bind directly to Sox2 in ChIP experiments from human embryonic stem cells, and Tbr2 overexpression decreases Sox2 in these cells (Teo et al., 2011). Interestingly, Sox2 directly binds to and negatively regulates Tbr2 during endoderm specification, and knockdown of Sox2 in this context results in increased Tbr2 expression, perhaps suggesting a reciprocal relationship between these TFs (Teo et al., 2011). However, additional work is required to reveal additional targets of Tbr2 during DG neurogenesis to fully understand its undoubtedly complex role in regulating neuronal commitment.
One of the most intriguing findings of our studies is the consistent increase in NSC number and proliferation in the DG after Tbr2 ablation. We show that NSCs accumulate in the SGZ after Tbr2 ablation, suggesting that the activated NSC pool expands when Tbr2+ INPs are absent. Although the mechanism by which loss of Tbr2+ INPs influences the NSC pool is not entirely clear from our studies, several possible explanations exist. First, INPs may act via a feedback mechanism to regulate the proliferation and differentiation of the NSC pool. In fact, another study of cKO mice lacking Prox1 (a TF expressed downstream of Tbr2 in the dentate lineage) showed loss of Tbr2+ INPs and a resultant similar, albeit transient, increase in NSC proliferation. Increased NSC proliferation in Prox1 mutants was shown to be attributable, at least in part, to defective Notch signaling in INPs, supporting an INP-mediated feedback mechanism regulating the NSC pool (Lavado et al., 2010). However, we have also observed Tbr2 expression in a small fraction of radial type-1 cells and in some Sox2+ NSCs (Hodge et al., 2008), perhaps suggesting that Tbr2 may function cell autonomously in these NSCs to regulate their proliferation. Given that small alterations in NSC proliferation can have large impacts on the overall progenitor pool (Dranovsky et al., 2011), it is possible that loss of Tbr2 within these NSCs may contribute to the increases in NSC proliferation we observe, and it will remain for future studies to determine the exact mechanisms by which Tbr2 ablation results in augmentation of the NSC pool in the SGZ.
Recent reports have described distinct subtypes of type-1 NSCs in the SGZ with different proliferative characteristics. Specifically, quiescent radial NSCs have been distinguished from rapidly dividing horizontal NSCs, which constitute a larger proportion of proliferating cells in the SGZ (Lugert et al., 2010). Our studies of Tbr2 icKO mice provide novel insight into the regulation of these subtypes of NSCs by showing that both subtypes respond to loss of Tbr2+ INPs, albeit in distinct ways. Radial NSCs do not increase in total number in Tbr2 icKO mice, suggesting that they do not accumulate in the SGZ. Rather, radial NSCs divide at a greater frequency after Tbr2 ablation, indicating increased activation of these normally quiescent NSCs. In addition, Tbr2 ablation alters the pool of active horizontal NSCs, increasing both the total number of horizontal NSCs and the proliferation of this cell population, resulting in substantial accumulation in the SGZ. This suggests that horizontal NSCs undergo more self-renewing divisions when Tbr2+ INPs are depleted but are incapable of producing INPs without Tbr2. Because the total number of radial NSCs does not change in Tbr2 icKO mice, we suggest that increased division of these cells contributes to expansion of the horizontal NSC pool in mutant animals. However, the exact lineage relationship between radial NSCs, horizontal NSCs, and type-2a INPs is not currently known (Lugert et al., 2010; Bonaguidi et al., 2011; Dranovsky et al., 2011), so we can only postulate a direct sequential relationship between these different cell types. Regardless, our results suggest that the NSC niche responds dynamically to changes in the downstream INP/neuroblast compartment.
Much of the currently available knowledge about Tbr2 functions comes from studies of embryonic neocortex, in which Tbr2 is similarly expressed in INPs (Arnold et al., 2008; Sessa et al., 2008). In embryonic neocortex, INP proliferation is decreased after Tbr2 ablation, and fewer pyramidal projection neurons are generated overall. However, many glutamatergic cortical neurons are, nonetheless, generated in the absence of Tbr2 (Arnold et al., 2008; Sessa et al., 2008), suggesting that Tbr2 is dispensable for much of embryonic neocortical neurogenesis and implying that neocortical progenitors may possess redundant transcriptional programs that facilitate neurogenesis in the absence of Tbr2. Alternatively, disparities between DG and neocortex in their requirement for Tbr2 expression may reflect differences in the capacity of NSCs in these brain regions to use alternate modes of neurogenesis. In cortex, pyramidal neurons can be generated directly from radial glial NSCs in the ventricular zone or indirectly through INPs in the SVZ (Haubensak et al., 2004; Miyata et al., 2004; Noctor et al., 2004; Kowalczyk et al., 2009). The modes of neurogenesis used in the DG are not as well defined, but DG NSCs have been reported to divide symmetrically to produce more NSCs (self-renewing divisions) or asymmetrically to produce an NSC and an INP (Steiner et al., 2006; Bonaguidi et al., 2011). INPs generally divide symmetrically to produce more INPs or terminally to generate neurons (Steiner et al., 2006). However, recent reports suggest flexibility in the lineage of adult hippocampal NSCs (Lugert et al., 2010; Bonaguidi et al., 2011; Dranovsky et al., 2011; Encinas et al., 2011), with evidence indicating that the probability that INPs will serve as a transit-amplifying population is directly related to environmental stimuli (e.g., enrichment, social isolation, and exercise) (Hodge et al., 2008; Dranovsky et al., 2011). Our results do not speak directly to lineage relationships between DG NSCs. However, they suggest that, regardless of the mode of neurogenesis, very few, if any, granule neurons are produced without passing through a transient Tbr2+ progenitor phase.
In conclusion, the data presented here establish Tbr2 as a critical regulator of granule cell fate, indispensable for the majority of neurogenesis throughout DG development and in the adult neurogenic niche. Tbr2 expression is required for the production of INPs, and loss of INPs after ablation of Tbr2 profoundly impacts the NSC pool, resulting in activation of both radial and horizontal NSCs. Finally, we show that Tbr2 directly binds Sox2, a key regulator of NSC identity, suggesting that Tbr2 may influence the progression from uncommitted NSC to fate-specified INP by interacting with other key TFs in the dentate lineage.
Footnotes
This work was supported by National Institute of Mental Health Grants 3R01-MH080766 and R01-MH058869 (R.F.H.). R.D.H. received fellowships from the Heart and Stroke Foundation of Canada and American Heart Association Grant 10POST2610067. R.J.K. is a National Institute of Child Health and Human Development fellow of the Pediatric Scientist Development Program (National Institutes of Health Grant K12 HD000850). S. Pleasure (University of California, San Francisco, San Francisco, CA) provided the Prox1 antibody, Nestin–GFP mice were from G. Enikolopov (Cold Spring Harbor Laboratory, Cold Spring Harbor, NY), and Nestin–CreERT2 mice were from R. Kageyama (Kyoto University, Kyoto, Japan). CAG–GFP retroviral vector was from F. Gage (Salk Institute, La Jolla, CA). We thank E. Stoll and D. Sellers (University of Washington, Seattle, WA) for assistance with adult NSC cultures. Ray Daza and Thomas Walsh provided technical assistance.
The authors declare no competing financial interests.
References
- Ables JL, Decarolis NA, Johnson MA, Rivera PD, Gao Z, Cooper DC, Radtke F, Hsieh J, Eisch AJ. Notch1 is required for maintenance of the reservoir of adult hippocampal stem cells. J Neurosci. 2010;30:10484–10492. doi: 10.1523/JNEUROSCI.4721-09.2010. [DOI] [PMC free article] [PubMed] [Google Scholar]
- Arnold SJ, Huang GJ, Cheung AF, Era T, Nishikawa S, Bikoff EK, Molnár Z, Robertson EJ, Groszer M. The T-box transcription factor Eomes/Tbr2 regulates neurogenesis in the cortical subventricular zone. Genes Dev. 2008;22:2479–2484. doi: 10.1101/gad.475408. [DOI] [PMC free article] [PubMed] [Google Scholar]
- Bedogni F, Hodge RD, Elsen GE, Nelson BR, Daza RA, Beyer RP, Bammler TK, Rubenstein JL, Hevner RF. Tbr1 regulates regional and laminar identity of postmitotic neurons in developing neocortex. Proc Natl Acad Sci U S A. 2010;107:13129–13134. doi: 10.1073/pnas.1002285107. [DOI] [PMC free article] [PubMed] [Google Scholar]
- Bonaguidi MA, Wheeler MA, Shapiro JS, Stadel RP, Sun GJ, Ming GL, Song H. In vivo clonal analysis reveals self-renewing and multipotent adult neural stem cell characteristics. Cell. 2011;145:1142–1155. doi: 10.1016/j.cell.2011.05.024. [DOI] [PMC free article] [PubMed] [Google Scholar]
- Breunig JJ, Silbereis J, Vaccarino FM, Sestan N, Rakic P. Notch regulates cell fate and dendrite morphology of newborn neurons in the postnatal dentate gyrus. Proc Natl Acad Sci U S A. 2007;104:20558–20563. doi: 10.1073/pnas.0710156104. [DOI] [PMC free article] [PubMed] [Google Scholar]
- Brill MS, Ninkovic J, Winpenny E, Hodge RD, Ozen I, Yang R, Lepier A, Gascón S, Erdelyi F, Szabo G, Parras C, Guillemot F, Frotscher M, Berninger B, Hevner RF, Raineteau O, Götz M. Adult generation of glutamatergic olfactory bulb interneurons. Nat Neurosci. 2009;12:1524–1533. doi: 10.1038/nn.2416. [DOI] [PMC free article] [PubMed] [Google Scholar]
- Deng W, Aimone JB, Gage FH. New neurons and new memories: how does adult hippocampal neurogenesis affect learning and memory? Nat Rev Neurosci. 2010;11:339–350. doi: 10.1038/nrn2822. [DOI] [PMC free article] [PubMed] [Google Scholar]
- Dranovsky A, Hen R. Hippocampal neurogenesis: regulation by stress and antidepressants. Biol Psychiatry. 2006;59:1136–1143. doi: 10.1016/j.biopsych.2006.03.082. [DOI] [PMC free article] [PubMed] [Google Scholar]
- Dranovsky A, Picchini AM, Moadel T, Sisti AC, Yamada A, Kimura S, Leonardo ED, Hen R. Experience dictates stem cell fate in the adult hippocampus. Neuron. 2011;70:908–923. doi: 10.1016/j.neuron.2011.05.022. [DOI] [PMC free article] [PubMed] [Google Scholar]
- Ehm O, Göritz C, Covic M, Schäffner I, Schwarz TJ, Karaca E, Kempkes B, Kremmer E, Pfrieger FW, Espinosa L, Bigas A, Giachino C, Taylor V, Frisén J, Lie DC. RBPJ-dependent signaling is essential for long-term maintenance of neural stem cells in the adult hippocampus. J Neurosci. 2010;30:13794–13807. doi: 10.1523/JNEUROSCI.1567-10.2010. [DOI] [PMC free article] [PubMed] [Google Scholar]
- Encinas JM, Michurina TV, Peunova N, Park JH, Tordo J, Peterson DA, Fishell G, Koulakov A, Enikolopov G. Division-coupled astrocytic differentiation and age-related depletion of neural stem cells in the adult hippocampus. Cell Stem Cell. 2011;8:566–579. doi: 10.1016/j.stem.2011.03.010. [DOI] [PMC free article] [PubMed] [Google Scholar]
- Englund C, Fink A, Lau C, Pham D, Daza RA, Bulfone A, Kowalczyk T, Hevner RF. Pax6, Tbr2, and Tbr1 are expressed sequentially by radial glia, intermediate progenitor cells, and postmitotic neurons in developing neocortex. J Neurosci. 2005;25:247–251. doi: 10.1523/JNEUROSCI.2899-04.2005. [DOI] [PMC free article] [PubMed] [Google Scholar]
- Favaro R, Valotta M, Ferri AL, Latorre E, Mariani J, Giachino C, Lancini C, Tosetti V, Ottolenghi S, Taylor V, Nicolis SK. Hippocampal development and neural stem cell maintenance require Sox2-dependent regulation of Shh. Nat Neurosci. 2009;12:1248–1256. doi: 10.1038/nn.2397. [DOI] [PubMed] [Google Scholar]
- Gao Z, Ure K, Ables JL, Lagace DC, Nave KA, Goebbels S, Eisch AJ, Hsieh J. Neurod1 is essential for the survival and maturation of adult-born neurons. Nat Neurosci. 2009;12:1090–1092. doi: 10.1038/nn.2385. [DOI] [PMC free article] [PubMed] [Google Scholar]
- Haubensak W, Attardo A, Denk W, Huttner WB. Neurons arise in the basal neuroepithelium of the early mammalian telencephalon: a major site of neurogenesis. Proc Natl Acad Sci U S A. 2004;101:3196–3201. doi: 10.1073/pnas.0308600100. [DOI] [PMC free article] [PubMed] [Google Scholar]
- Hevner RF, Hodge RD, Daza RA, Englund C. Transcription factors in glutamatergic neurogenesis: conserved programs in neocortex, cerebellum, and adult hippocampus. Neurosci Res. 2006;55:223–233. doi: 10.1016/j.neures.2006.03.004. [DOI] [PubMed] [Google Scholar]
- Hodge RD, Hevner RF. Expression and actions of transcription factors in adult hippocampal neurogenesis. Dev Neurobiol. 2011;71:680–689. doi: 10.1002/dneu.20882. [DOI] [PMC free article] [PubMed] [Google Scholar]
- Hodge RD, Kowalczyk TD, Wolf SA, Encinas JM, Rippey C, Enikolopov G, Kempermann G, Hevner RF. Intermediate progenitors in adult hippocampal neurogenesis: Tbr2 expression and coordinate regulation of neuronal output. J Neurosci. 2008;28:3707–3717. doi: 10.1523/JNEUROSCI.4280-07.2008. [DOI] [PMC free article] [PubMed] [Google Scholar]
- Imayoshi I, Ohtsuka T, Metzger D, Chambon P, Kageyama R. Temporal regulation of Cre recombinase activity in neural stem cells. Genesis. 2006;44:233–238. doi: 10.1002/dvg.20212. [DOI] [PubMed] [Google Scholar]
- Intlekofer AM, Banerjee A, Takemoto N, Gordon SM, Dejong CS, Shin H, Hunter CA, Wherry EJ, Lindsten T, Reiner SL. Anomalous type 17 response to viral infection by CD8+ T cells lacking T-bet and eomesodermin. Science. 2008;321:408–411. doi: 10.1126/science.1159806. [DOI] [PMC free article] [PubMed] [Google Scholar]
- Jessberger S, Clark RE, Broadbent NJ, Clemenson GD, Jr, Consiglio A, Lie DC, Squire LR, Gage FH. Dentate gyrus-specific knockdown of adult neurogenesis impairs spatial and object recognition memory in adult rats. Learn Mem. 2009;16:147–154. doi: 10.1101/lm.1172609. [DOI] [PMC free article] [PubMed] [Google Scholar]
- Karalay O, Doberauer K, Vadodaria KC, Knobloch M, Berti L, Miquelajauregui A, Schwark M, Jagasia R, Taketo MM, Tarabykin V, Lie DC, Jessberger S. Prospero-related homeobox 1 gene (Prox1) is regulated by canonical Wnt signaling and has a stage-specific role in adult hippocampal neurogenesis. Proc Natl Acad Sci U S A. 2011;108:5807–5812. doi: 10.1073/pnas.1013456108. [DOI] [PMC free article] [PubMed] [Google Scholar]
- Kempermann G, Jessberger S, Steiner B, Kronenberg G. Milestones of neuronal development in the adult hippocampus. Trends Neurosci. 2004;27:447–452. doi: 10.1016/j.tins.2004.05.013. [DOI] [PubMed] [Google Scholar]
- Kim EJ, Leung CT, Reed RR, Johnson JE. In vivo analysis of Ascl1 defined progenitors reveals distinct developmental dynamics during adult neurogenesis and gliogenesis. J Neurosci. 2007;27:12764–12774. doi: 10.1523/JNEUROSCI.3178-07.2007. [DOI] [PMC free article] [PubMed] [Google Scholar]
- Kim EJ, Ables JL, Dickel LK, Eisch AJ, Johnson JE. Ascl1 (Mash1) defines cells with long-term neurogenic potential in subgranular and subventricular zones in adult mouse brain. PLoS One. 2011;6:e18472. doi: 10.1371/journal.pone.0018472. [DOI] [PMC free article] [PubMed] [Google Scholar]
- Kowalczyk T, Pontious A, Englund C, Daza RA, Bedogni F, Hodge R, Attardo A, Bell C, Huttner WB, Hevner RF. Intermediate neuronal progenitors (basal progenitors) produce pyramidal-projection neurons for all layers of cerebral cortex. Cereb Cortex. 2009;19:2439–2450. doi: 10.1093/cercor/bhn260. [DOI] [PMC free article] [PubMed] [Google Scholar]
- Kuwabara T, Hsieh J, Muotri A, Yeo G, Warashina M, Lie DC, Moore L, Nakashima K, Asashima M, Gage FH. Wnt-mediated activation of NeuroD1 and retro-elements during adult neurogenesis. Nat Neurosci. 2009;12:1097–1105. doi: 10.1038/nn.2360. [DOI] [PMC free article] [PubMed] [Google Scholar]
- Kwon GS, Hadjantonakis AK. Eomes::GFP—a tool for live imaging cells of the trophoblast, primitive streak, and telencephalon in the mouse embryo. Genesis. 2007;45:208–217. doi: 10.1002/dvg.20293. [DOI] [PMC free article] [PubMed] [Google Scholar]
- Lavado A, Lagutin OV, Chow LML, Baker SJ, Oliver G. Prox1 is required for granule cell maturation and intermediate progenitor maintenance during brain neurogenesis. PLoS Biol. 2010;8:pii:e1000460. doi: 10.1371/journal.pbio.1000460. [DOI] [PMC free article] [PubMed] [Google Scholar]
- Li G, Kataoka H, Coughlin SR, Pleasure SJ. Identification of a transient subpial neurogenic zone in the developing dentate gyrus and its regulation by Cxcl12 and reelin signaling. Development. 2009;136:327–335. doi: 10.1242/dev.025742. [DOI] [PMC free article] [PubMed] [Google Scholar]
- Lie DC, Colamarino SA, Song HJ, Désiré L, Mira H, Consiglio A, Lein ES, Jessberger S, Lansford H, Dearie AR, Gage FH. Wnt signalling regulates adult hippocampal neurogenesis. Nature. 2005;437:1370–1375. doi: 10.1038/nature04108. [DOI] [PubMed] [Google Scholar]
- Lugert S, Basak O, Knuckles P, Haussler U, Fabel K, Götz M, Haas CA, Kempermann G, Taylor V, Giachino C. Quiescent and active hippocampal neural stem cells with distinct morphologies respond selectively to physiological and pathological stimuli and aging. Cell Stem Cell. 2010;6:445–456. doi: 10.1016/j.stem.2010.03.017. [DOI] [PubMed] [Google Scholar]
- Mignone JL, Kukekov V, Chiang AS, Steindler D, Enikolopov G. Neural stem and progenitor cells in nestin-GFP transgenic mice. J Comp Neurol. 2004;469:311–324. doi: 10.1002/cne.10964. [DOI] [PubMed] [Google Scholar]
- Miyata T, Kawaguchi A, Saito K, Kawano M, Muto T, Ogawa M. Asymmetric production of surface-dividing and non-surface-dividing cortical progenitor cells. Development. 2004;131:3133–3145. doi: 10.1242/dev.01173. [DOI] [PubMed] [Google Scholar]
- Noctor SC, Martínez-Cerdeño V, Ivic L, Kriegstein AR. Cortical neurons arise in symmetric and asymmetric division zones and migrate through specific phases. Nat Neurosci. 2004;7:136–144. doi: 10.1038/nn1172. [DOI] [PubMed] [Google Scholar]
- Novak A, Guo C, Yang W, Nagy A, Lobe CG. Z/EG, a double reporter mouse line that expresses enhanced green fluorescent protein upon Cre-mediated excision. Genesis. 2000;28:147–155. [PubMed] [Google Scholar]
- Ovcharenko I, Nobrega MA, Loots GG, Stubbs L. ECR Browser: a tool for visualizing and accessing data from comparisons of multiple vertebrate genomes. Nucleic Acids Res. 2004;32:W280–W286. doi: 10.1093/nar/gkh355. [DOI] [PMC free article] [PubMed] [Google Scholar]
- Ray J, Gage FH. Differential properties of adult rat and mouse brain-derived neural stem/progenitor cells. Mol Cell Neurosci. 2006;31:560–573. doi: 10.1016/j.mcn.2005.11.010. [DOI] [PubMed] [Google Scholar]
- Revest JM, Dupret D, Koehl M, Funk-Reiter C, Grosjean N, Piazza PV, Abrous DN. Adult hippocampal neurogenesis is involved in anxiety-related behaviors. Mol Psychiatry. 2009;14:959–967. doi: 10.1038/mp.2009.15. [DOI] [PubMed] [Google Scholar]
- Roybon L, Hjalt T, Stott S, Guillemot F, Li JY, Brundin P. Neurogenin2 directs granule neuroblast production and amplification while NeuroD1 specifies neuronal fate during hippocampal neurogenesis. PLoS One. 2009;4:e4779. doi: 10.1371/journal.pone.0004779. [DOI] [PMC free article] [PubMed] [Google Scholar]
- Ryan K, Russ AP, Levy RJ, Wehr DJ, You J, Easterday MC. Modulation of Eomes activity alters the size of the developing heart: implications for in utero cardiac gene therapy. Human Gene Therapy. 2004;15:842–855. doi: 10.1089/hum.2004.15.842. [DOI] [PubMed] [Google Scholar]
- Sessa A, Mao CA, Hadjantonakis AK, Klein WH, Broccoli V. Tbr2 directs conversion of radial glia into basal precursors and guides neuronal amplification by indirect neurogenesis in the developing neocortex. Neuron. 2008;60:56–69. doi: 10.1016/j.neuron.2008.09.028. [DOI] [PMC free article] [PubMed] [Google Scholar]
- Sierra A, Encinas JM, Deudero JJ, Chancey JH, Enikolopov G, Overstreet-Wadiche LS, Tsirka SE, Maletic-Savatic M. Microglia shape adult hippocampal neurogenesis through apoptosis-coupled phagocytosis. Cell Stem Cell. 2010;7:483–495. doi: 10.1016/j.stem.2010.08.014. [DOI] [PMC free article] [PubMed] [Google Scholar]
- Steiner B, Klempin F, Wang L, Kott M, Kettenmann H, Kempermann G. Type-2 cells as link between glial and neuronal lineage in adult hippocampal neurogenesis. Glia. 2006;54:805–814. doi: 10.1002/glia.20407. [DOI] [PubMed] [Google Scholar]
- Suh H, Consiglio A, Ray J, Sawai T, D'Amour KA, Gage FH. In vivo fate analysis reveals the multipotent and self-renewal capacities of Sox2+ neural stem cells in the adult hippocampus. Cell Stem Cell. 2007;1:515–528. doi: 10.1016/j.stem.2007.09.002. [DOI] [PMC free article] [PubMed] [Google Scholar]
- Takemoto T, Uchikawa M, Yoshida M, Bell DM, Lovell-Badge R, Papaioannou VE, Kondoh H. Tbx6-dependent Sox2 regulation determines neural or mesodermal fate in axial stem cells. Nature. 2011;470:394–398. doi: 10.1038/nature09729. [DOI] [PMC free article] [PubMed] [Google Scholar]
- Teo AK, Arnold SJ, Trotter MW, Brown S, Ang LT, Chng Z, Robertson EJ, Dunn NR, Vallier L. Pluripotency factors regulate definitive endoderm specification through eomesodermin. Genes Dev. 2011;25:238–250. doi: 10.1101/gad.607311. [DOI] [PMC free article] [PubMed] [Google Scholar]
- Tronche F, Kellendonk C, Kretz O, Gass P, Anlag K, Orban PC, Bock R, Klein R, Schütz G. Disruption of the glucocorticoid receptor gene in the nervous system results in reduced anxiety. Nat Genet. 1999;23:99–103. doi: 10.1038/12703. [DOI] [PubMed] [Google Scholar]
- Wingender E, Dietze P, Karas H, Knüppel R. TRANSFAC: a database on transcription factors and their DNA binding sites. Nucleic Acids Res. 1996;24:238–241. doi: 10.1093/nar/24.1.238. [DOI] [PMC free article] [PubMed] [Google Scholar]
- Zhao C, Teng EM, Summers RG, Jr, Ming GL, Gage FH. Distinct morphological stages of dentate granule neuron maturation in the adult mouse hippocampus. J Neurosci. 2006;26:3–11. doi: 10.1523/JNEUROSCI.3648-05.2006. [DOI] [PMC free article] [PubMed] [Google Scholar]