

Abstract
The brain's ability to bind incoming auditory and visual stimuli depends critically on the temporal structure of this information. Specifically, there exists a temporal window of audiovisual integration within which stimuli are highly likely to be perceived as part of the same environmental event. Several studies have described the temporal bounds of this window, but few have investigated its malleability. Recently, our laboratory has demonstrated that a perceptual training paradigm is capable of eliciting a 40% narrowing in the width of this window that is stable for at least 1 week after cessation of training. In the current study, we sought to reveal the neural substrates of these changes. Eleven human subjects completed an audiovisual simultaneity judgment training paradigm, immediately before and after which they performed the same task during an event-related 3T fMRI session. The posterior superior temporal sulcus (pSTS) and areas of auditory and visual cortex exhibited robust BOLD decreases following training, and resting state and effective connectivity analyses revealed significant increases in coupling among these cortices after training. These results provide the first evidence of the neural correlates underlying changes in multisensory temporal binding likely representing the substrate for a multisensory temporal binding window.
Introduction
We live in a world rich in sensory information. As such, the degree to which we are able to rapidly and accurately parse and combine this information effectively determines our ability to perform many tasks, and continually shapes our perceptions of the world. To determine which information from the different senses should be perceptually bound, the brain takes advantage of certain statistical regularities of stimuli within the physical world. Several studies have established that visual and auditory events originating from the same location in space are highly likely to be perceptually bound (Slutsky and Recanzone, 2001; Macaluso et al., 2004; Teder-Sälejärvi et al., 2005; Innes-Brown and Crewther, 2009). The same may be said in the temporal domain, but because the propagation speeds of (and neural conduction processes for) light and sound differ, some flexibility must be afforded in this dimension. Thus, the concept of a multisensory temporal binding window has become a useful construct. Within this time interval (generally on the order of several hundred milliseconds) the paired presentation of auditory and visual events are likely to result in neurophysiological, behavioral, and perceptual changes thought to reflect the multisensory binding process (Meredith et al., 1987; Shams et al., 2002; Colonius and Diederich, 2004).
Recently, studies have begun to focus upon elucidating the neural correlates of multisensory temporal processes, and human neuroimaging studies have identified a network of brain regions that appear to be important in the perception of audiovisual temporal relations. In previous PET and fMRI studies, canonical regions of multisensory convergence such as the posterior superior temporal sulcus (pSTS) (Calvert et al., 2000; Bushara et al., 2001; Calvert et al., 2001; Macaluso et al., 2004; Noesselt et al., 2007), inferior parietal lobule (Bushara et al., 2001), insula (Bushara et al., 2001), and superior colliculus (Bushara et al., 2001; Calvert et al., 2001) have been shown to be preferentially active during the presentation of synchronous (as opposed to asynchronous) auditory and visual stimuli. More recent work has extended this network to include domains within visual and auditory cortices (Bischoff et al., 2007; Dhamala et al., 2007; Noesselt et al., 2007).
Although these imaging studies have identified the important nodes involved in multisensory temporal perceptual processes, their ability to clarify the functional roles that these nodes play in processing multisensory temporal information is limited. Recent work has provided a novel tool for examining multisensory networks by demonstrating that training on an audiovisual simultaneity judgment task is capable of eliciting a robust, rapid, and stable narrowing of the multisensory temporal binding window (Powers et al., 2009). The current study takes advantage of this paradigm and the plasticity it engages to uncover the dynamic interactions among the network elements underlying the perception of audiovisual simultaneity. Specifically, it was hypothesized that manipulation of the range of audiovisual stimulus onset asynchronies over which participants perceived simultaneity would result in BOLD changes in previously described multisensory, auditory, and visual regions, and that the ways in which these regions functionally interacted would be altered after training.
Materials and Methods
Subjects
Thirteen right-handed Vanderbilt students and employees (mean age = 23.4 years; 8 female) participated in both the behavioral and imaging portions of the study. All participants had self-reported normal hearing and normal or corrected-to-normal vision. None had any personal or close family history of neurological or psychiatric disorders, and all completed fMRI screening and informed written consent form. Data from two subjects were discarded before the analysis phase due to an inability to perform the behavioral task and experimenter error. All procedures were approved by the Vanderbilt University Institutional Review Board (IRB).
General procedure
Experimental procedures took place over the course of 2 d. Participants first took part in a baseline behavioral assessment, followed by a pretraining MRI scan. They then underwent 1 h of behavioral training outside the scanner, after which a posttraining behavioral assessment was performed. Each participant then returned to the laboratory the next day for a final behavioral assessment and a final MRI scan. The details of each of these procedures are outlined below.
Behavioral
Behavioral assessment.
Before training began, participants engaged in a two-interval forced choice (2-IFC) audiovisual simultaneity judgment task (Fig. 1). In the task, participants determined which of the two audiovisual stimulus pairs was presented synchronously [stimulus onset asynchrony (SOA) of 0 ms] by responding 1 or 2, respectively, on a standard computer keyboard. Participants sat in a dark and sound-attenuated room, 48 cm from a computer monitor (NEC MultiSync FE992; resolution: 800 × 600 pixels; vertical refresh rate: 120 Hz). MatLab version 7.7.0.471 2008b (The MathWorks) equipped with PsychToolbox 3.0 was used for stimulus and protocol control as well as to acquire all behavioral data. Temporally precise presentation of auditory and visual stimuli was achieved using high-performance video (ATI Radeon HD 2400 Pro) and audio (Creative SoundBlaster X-FI) cards, the latter of which was equipped with ASIO drivers for use in PsychToolbox to ensure low-latency (time from call of the MatLab script to audio card response) and high-fidelity presentation of auditory stimuli.
Figure 1.

Experimental procedure and behavioral results. a, Stimulus timing structure for the 2-IFC task. In the 2-IFC design, one stimulus pair is always simultaneously presented (stimulus onset asynchrony [SOA] = 0), and one is separated by an SOA ranging from −300 ms (auditory leading visual) to 300 ms (visual leading auditory), in 50 ms increments. b, Representative trial sequence. Depicted is a simultaneous-first two-interval forced choice trial. c, Mean performance data from one participant at baseline and final assessments, plotting mean accuracy as a function of SOA. These data are fitted with two sigmoid curves to model the left and right sides of the temporal binding window, and the size of this window is taken to be the breadth of this distribution at half the distance between the minimum data point at baseline and 100% (full width at half height). By this measure, this individual's temporal window size narrows from 219 ms at baseline to 146 ms after training. It should be noted that the direction and magnitude of change noted were independent of the methods used to derive window size. d, Mean total window size from all 11 participants. Mean window size decreases significantly from baseline (343 ms) to final assessment (231 ms). Error bars indicate one SEM; **p < 0.01.
A white crosshair fixation marker (1 × 1 cm) appeared on a black background for the duration of each trial. The visual stimulus consisted of a white annulus on a black background subtending 15° of visual space, with an outer diameter of 12.4 cm and an inner diameter of 6.0 cm (area = 369.8 cm2). This stimulus was presented for one refresh duration on the NEC monitor above (refresh rate: 60 Hz; one refresh duration: 17 ms; stimulus was present on screen for 13 ms).
The auditory stimulus was an 1800 Hz tone burst and was 17 ms in duration. The stimulus was presented to both ears via superaural headphones (Philips SBC HN110) with no interaural time or level differences. The tone burst was calibrated with a Larson–Davis sound level meter (Model 814). Acoustic stimuli were presented at 110.4 dB SPL unweighted using impulse detection and flat weighting settings.
The visual and auditory stimuli were presented at SOAs ranging from −300 ms (auditory stimulus leading visual) to 300 ms (visual stimulus leading auditory) at 50 ms intervals. All stimulus times were verified externally with an oscilloscope, and stimulus presentation times recorded internally in MatLab were adjusted to reflect the true presentation times observed on the oscilloscope. Mean error in stimulus presentation time was 2.54 ms. The task consisted of 325 total trials (25 repetitions of the 13 trial types). By nature of the 2-IFC task structure, simultaneous and nonsimultaneous pairs were presented with equal likelihoods.
Behavioral training.
The behavioral training portion of the study used the same stimuli as the assessment, with the exception that the subject was presented with either the phrase “Correct!” paired with a yellow happy face, or “Incorrect” paired with a blue sad face after each trial, corresponding to whether they answered correctly or not. These faces (area = 37.4 cm2) were presented at the center of the screen for 0.5 s. Training consisted of three blocks of 120 trials (20 cycles × 6 trials/cycle) and consisted of SOAs from −150 to 150 ms. The total training session lasted for ∼45 min.
Imaging
The scanning protocol consisted of anatomical scans followed by a blocked-design multisensory stimulation protocol, two event-related runs, a resting state functional connectivity scan, and three final event-related runs. The scanning procedure was the same for both days. A 3-Tesla fMRI scanner (Philips Intera Achieva 3T) was used to generate high-resolution anatomical images and to measure blood-oxygen-level-dependent (BOLD) signals. The high-resolution anatomical scans produced 3D T1-weighted images [170 slices, TR = 7.982 ms, TE = 3.68 ms, thickness = 1 mm, field of view (FOV) = 256 × 256 mm, matrix size = 256 × 256 × 170; voxel size = 1×1×1 mm]. The event-related runs were acquired with a T2*-weighted standard EPI sequence (33 slices acquired in a ascending interleaved pattern, TR = 2.5 s, TE = 35 ms, slice thickness = 4 mm, FOV = 240 × 131.5 mm, matrix size = 80 × 78 × 33; voxel size = 3 × 3 × 4 mm, 0.5 mm gap inclusive) for a duration of 5 min and 57 s per run; full-brain coverage was achieved using a full-volume (birdcage) RF head coil, and 135 volumes were acquired per run.
Visual stimuli were presented via a projector (NEC Model MT1050; resolution: 800 × 600 pixels; refresh rate = 60 Hz) onto a frosted glass screen in the scanning room that was viewed by participants via a front-projection MR-compatible mirror mounted on the head coil. Acoustic stimuli were presented with intraaural, MR-compatible insert earphones (Sensimetrics MRI-Compatible Insert Earphones Model S14) and tips (Hearing Components Inc. Comply Canal-Tips). Superaural sound-attenuating headphones were placed over them to lessen the effects of scanner noise. Audibility and visibility of stimuli were checked against preset marks before and after each scan for each subject to ensure standardization of stimulus presentation during each imaging session.
Directly after the completion of anatomical image acquisition, a functional run was completed using the same visual and auditory stimuli in a blocked design. Blocks consisted of 20 presentations of either auditory-only (A), visual-only (V), or combined audiovisual (AV) stimuli over the course of 10 volume acquisitions. In a manner similar to that used during the event-related runs, a standard EPI sequence was used to acquire BOLD data (170 volumes; TR: 2000 ms; TE: 35 ms; FOV: 240.0 × 131.5 mm) during the course of this 5 min, 56 s run. A, V, and AV blocks were pseudo-randomized and counterbalanced across subjects, and a rest block was interposed after every third block. During this run, participants were instructed to remain still and pay close attention to the stimuli.
The physical characteristics of the stimuli used during the event-related runs were identical to those used in the behavioral portion of the study except that only three SOA conditions were used: 0 ms (simultaneous), 300 ms, and a third SOA determined by participants' baseline behavioral assessment, defined as the size of that individual's right temporal window (RWS; see Data analysis for details of window size measurement). If the RWS exceeded 300 ms, then the SOA was set to 150 ms (true for 2 subjects). Participants performed the 2-IFC task as they had during the behavioral assessment. They were asked to respond as quickly and accurately as possible. Within the 2.5 s TR, presentation of visual and auditory stimuli (17 ms each) and an 800 ms interstimulus interval (ISI) allowed for 1.3–1.6 s to respond, depending on SOA. During each event-related run, presentation of these events was temporally jittered and counterbalanced using an 127-event m-sequence (Buracas and Boynton, 2002) that ended with a 25 s period of no stimulus presentation.
During the resting-state functional connectivity scans, participants were instructed to close their eyes and think neutral thoughts. The data acquisition protocol used in the blocked-design multisensory stimulation run was also used for data collection here.
Data analysis
Estimation of multisensory temporal window size.
All behavioral data were stored in individual-subject .mat files for use in analysis with MatLab. Individual subject raw data were used to calculate mean accuracy at each SOA for all assessments. Mean data from each individual were fit with two sigmoid curves generated using the MatLab glmfit function, splitting the data into left (auditory presented first) and right (visual presented first) sides and fitting them separately. The criterion for determining the breadth of the temporal window was equal to half the distance between individuals' lowest accuracy point at baseline assessment and perfect performance (∼ 75% accuracy). These criteria were then used to assess the breadth of the distributions produced by each individual's assessment data throughout the duration of the training period (Powers et al., 2009). Distribution breadth was then assessed for both the left side (from zero to the left-most point at which the sigmoid curve crossed the criterion line) and the right side (from zero to right intersection point) and then combined to get an estimation of total distribution width. This measure was then used as a proxy for the size of each individual's window at each assessment, and the right-sided value was used as the right window size (RWS) SOA to be used in both scanning sessions. An example of the result of this process may be seen in Figure 1c. It should be noted that should mean data from any individual assessment have been unable to be fit with a sigmoid curve, all data from this individual would have been discarded, but this did not occur. Analysis of differences in window size across time was conducted by performing three paired-samples t tests (Bonferroni corrected for multiple comparisons) to assess for differences in mean window size across the four assessments.
Imaging data preprocessing.
Imaging data from each run were stored as Philips .par and .rec files, which were converted to NIFTI (.nii) files at the start of preprocessing. Statistical Parametric Mapping version 8 (SPM8) was used for the entirety of imaging data preprocessing and statistical analysis. Functional data were corrected for slice acquisition timing (reference slice = 1) and motion during the scanning session (registered to mean), and resliced before being coregistered with the high-quality anatomical data from that session. Both anatomical and functional images were then warped into standard Montréal Neurological Institute (MNI) space with 2 mm isometric voxels using trilinear interpolation settings. Finally, functional images were spatially smoothed (FWHM of Gaussian smoothing kernel: 8 × 8 × 8 mm) and readied for statistical analysis.
Statistical analysis.
A Finite Impulse Response (FIR) basis set was used to model the BOLD response (microtime resolution, 16 ms; microtime onset, 1; high-pass filter, 128 Hz; window length, 25 s; 10 basis functions; event durations, 0 ms) with conditions corresponding to presentation of each SOA (0 ms; RWS, 300 ms), as well as to response-related parameters (correct/incorrect responses, errors of commission and omission) in both separate and combined models.
To identify regions of cortex that are differentially active to synchrony versus asynchrony of presented audiovisual pairs, we isolated four event-related runs (runs 4 and 5 of both pretraining and posttraining scanning sessions) for use as an event-related localizer of these cortical regions, combined into a single model. Contrasts and statistical parametric maps were generated using weighting of the FIR time bins with the canonical HRF, allowing for both flexibility of event timing and minimization of noise parameters (Bai and Kantor, 2007; Bai et al., 2007). Resulting maps were generated on an individual basis and also served as the basis for random effects group analysis with predictors separated for each subject. For this analysis, cluster-size thresholding (Forman et al., 1995) was used for correction (SPM extension CorrClusTh, using the Newton–Raphson search method). With a starting voxel-level threshold of 0.01 (t = 2.76) uncorrected, this resulted in a cluster level of 161 mm3, corresponding to a corrected false-positive probability of 5% or less. The remaining 6 runs (3 pretraining, 3 posttraining) were included in a second model for analysis of pretraining/posttraining changes. Population-level inferences were based on a second-level paired-samples random-effects analysis. As with the event-related localizer, cluster-size thresholding was used for correction, resulting in cluster size thresholds of 544 mm3 and 784 mm3 for the pretraining/posttraining SOA 0 and SOA 300 comparisons, respectively; these corresponded to a corrected false-positive probability of 5% or less.
Active voxels in the group contrast of 0 ms > 300 ms as well as 300 ms > 0 ms for the event-related localizer runs were combined and identified as synchrony-sensitive areas, and within-condition (SOA) and between treatment (pretraining vs posttraining) contrasts were then generated using the remaining functional runs. Synchrony-sensitive regions exhibiting altered activity profiles between the pretraining and posttraining sessions were identified and defined as regions of interest (ROIs). For clarity of visualization, statistical maps were taken from SPM8 and projected onto a custom surface made up of averaged cortical surfaces from each individual created in FreeSurfer v. 4.5.0 (Athinoula A. Martinos Center for Biomedical Imaging, Massachusetts General Hospital, Boston, MA) via the SPM surfrend extension. When used, identification of Brodmann areas on this custom surface was accomplished via projection of the fsaverage MNI305 template (first MNI template, 305 subjects) onto the custom surface via FreeSurfer command mri_label2label. Additional identification and breakdown of clusters by anatomical area was accomplished using the WFU_PickAtlas (Lancaster et al., 2000; Tzourio-Mazoyer et al., 2002; Maldjian et al., 2003) within the xjview SPM8 extension.
Statistical analysis of these ROIs was undertaken using the MarsBaR (Marseille Boîte À Région d'Intérêt) and REX (Response Exploration for Neuroimaging Datasets) toolboxes, the former of which was used for extraction of FIR average time courses for each cluster (reported in percentage signal change), and the latter of which was used to define clusters and generate cluster-wise statistics, correcting to a false detection rate (FDR) of 0.05 or less. Cluster-wise FIR BOLD time course statistical analysis was performed on mean percent signal change values from individual FIR time courses. These values were then compared across the pretraining and posttraining scans via paired-samples t test for each stimulus condition.
Resting state data underwent all preprocessing described above, with the addition of a bandpass filter (0.01–0.1 Hz) for isolation of slow, low-amplitude fluctuations in signal. Analysis of functional coupling (Biswal et al., 1995) (bivariate correlation) was performed with SPM's Functional Connectivity Toolbox (conn), using the group-defined ROIs as seeds to generate whole-brain beta maps for each individual's pretraining and posttraining resting state runs. These were then entered into a second-level analysis (paired-samples t test) in SPM to determine which voxels exhibited an increase in functional coupling with the seed regions. As with the event-related data, p values were corrected via cluster-size thresholding. With a starting voxel-level threshold of 0.005 (t = 3.25) uncorrected, this resulted in a cluster level of 95 mm3, corresponding to a corrected false-positive probability of 5% or less.
Dynamic causal modeling (Friston et al., 2003; Lee et al., 2006; Kasess et al., 2010; Stephan et al., 2010) of neural responses to A, V, and AV presentation blocks during the blocked-design functional runs was implemented through the use of the Dynamic Causal Modeling functionality that is part of the SPM8 suite. So that the effects of blocked presentation were not removed during preprocessing, a high-pass filter of 340 s was applied, corresponding to the length of a full functional run. The volumes of interest (VOIs) used for this purpose corresponded to the previously defined auditory (see Fig. 4a), visual (see Fig. 4b), and combined pSTS (see Fig. 3, orange) regions of interest. Driving forces were defined as blocks of visual, auditory, and multisensory stimulation, and bidirectional inherent effective connectivity was hypothesized to exist among the three VOIs. Given the paucity of evidence in regards to the anatomical connectivity among the visual and auditory areas in question (Falchier et al., 2002), two families of models were constructed. Whereas one family of models included this connectivity, the other omitted these connections. Within these families of models, individual models were constructed corresponding to modulation of the extant connections both alone and in combination by multisensory stimulation (see Fig. 6a,b). All models included unisensory auditory and visual modulation of feedforward connections (i.e., from unisensory auditory and visual VOIs to the pSTS VOI). To determine the most likely of these DCMs given the data from all subjects, Bayesian model selection was applied separately for pretraining and posttraining datasets in a random effects group analysis to minimize the effects of outliers (Stephan et al., 2009). Within the SPM8 Dynamical Causal Modeling functionality, model selection was carried out in a hierarchical fashion used to estimate the frequency at which individual models were used in each session, and, from this, the posterior distribution was estimated across model space. Exceedance probability (the likelihood that one model is more likely than any other) is reported from this estimation for pretraining and posttraining sessions (see Fig. 6b). To enable comparison of connectivity parameters between pretraining and posttraining sessions, Bayesian model averaging was used to average parameters of interest (e.g., intrinsic connectivity), weighted by individual model posterior probability, and the posterior probability that each parameter is different from zero was calculated (see Fig. 6c; ≥0.90, black; <0.90, gray and value listed parenthetically). Model selection and statistical comparison were undertaken to detect emergent network properties among regions exhibiting similar local effects on BOLD activity in response to the stimulus set, with the specific expectation that significant increases in connectivity among these regions would be observed after training.
Figure 4.

Auditory and visual cortices as well as superior cerebellum exhibit BOLD decreases after training. a, Auditory ROI (red) and its physical relationship to a projection of BA 41 from the MNI atlas (dark blue). The ROI lies at the ventral/posterior border of BA 41, corresponding to auditory belt regions. b, Mean percent signal change in this region for the three SOA conditions before (white bars) and after (gray bars) training. c, Mean percent signal change as a function of trial accuracy for this region. d, Visual ROIs (red) and their physical relationship to BA 17, BA 18, BA 19, and area MT as represented by projections from the MNI atlas. e, Mean percent signal change in the visual ROIs for the three SOA conditions. f, Mean percent signal change in the visual ROI as a function of trial accuracy. g, Cerebellar ROI (yellow) in parasagittal section [x = 36]. The ROI is located in right vermal lobules VI and VII. h, Mean percent signal change in the cerebellar ROI for the three SOA conditions. i, Mean percent signal change in the cerebellar ROI as a function of trial accuracy. *p < 0.05; **p < 0.01.
Figure 3.
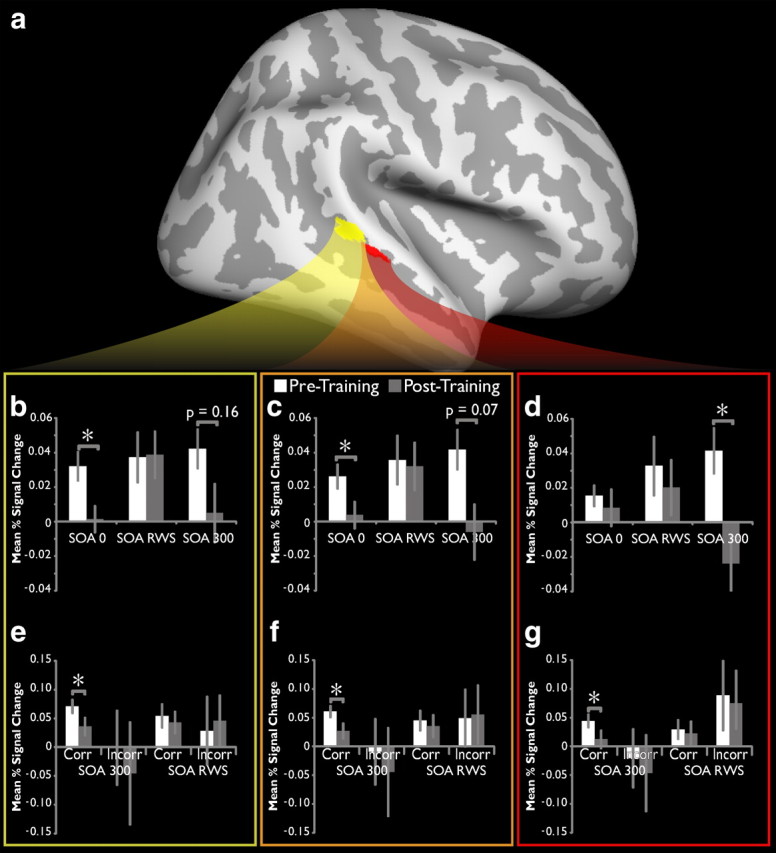
BOLD activity in pSTS decreases with training. a, The pSTS ROIs as identified in Figure 2. b—d, Mean percent signal change for all voxels in the posterior pSTS ROI (b, yellow box), the anterior pSTS ROI (d, red box), and the two combined (c, orange box) over the extracted FIR time course. Significant decreases are found at these SOAs but not at the intermediate (SOA RWS) interval that defines the border of each individual's window. e--g, Mean percent signal change as a function of trial accuracy for SOA 300 and SOA RWS trials, for the posterior (e), anterior (g), and combined (f) pSTS ROIs. *p < 0.05.
Figure 6.
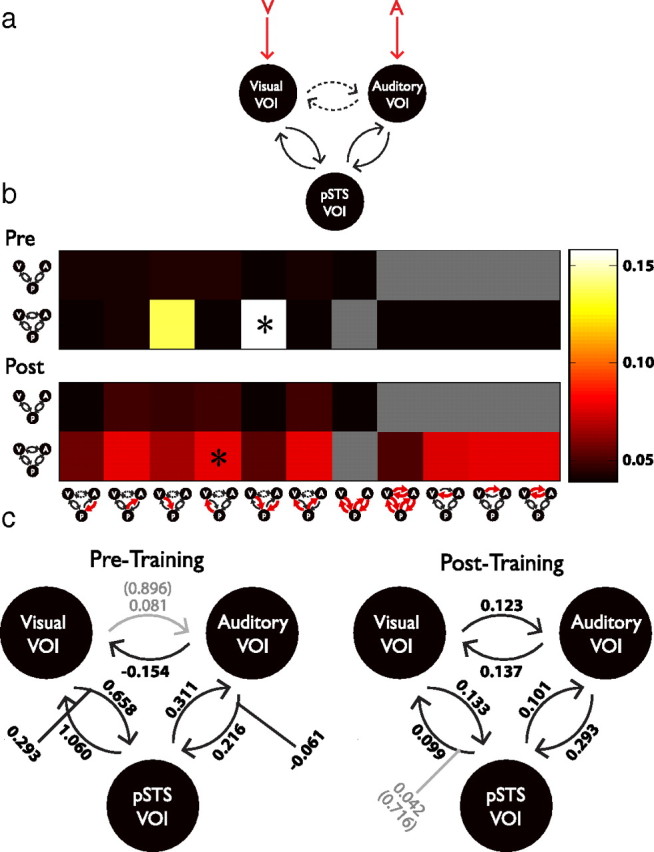
Effective connectivity increases among pSTS and unisensory areas are seen after training. a, Model demonstrating proposed interconnectivity among the pSTS, visual, and auditory VOIs with stimulation during the blocked-design protocol. Red arrows indicate driving forces. Dashed lines indicate the possibility of direct connectivity between the auditory and visual VOIs in the models chosen. b, Bayesian model selection for each of the models illustrated in pretraining and posttraining sessions. The two rows represent exceedance probabilities of models belonging to families omitting and including direct connectivity between auditory and visual VOIs. In the models, red arrows indicate connections that are modulated with AV presentation. Asterisks indicated winning models. c, Winning models from both pretraining and posttraining datasets. Solid black lines and numbers indicate connections among VOIs and modulatory influences of AV presentation that have group-wise posterior probability exceeding 0.90. Gray lines and numbers represent weights and connections whose posterior probabilities do not exceed 0.90 (values indicated parenthetically). Note especially the change in intrinsic connectivity between visual and auditory cortices after training.
Results
Perceptual training narrows the multisensory temporal binding window
Eleven subjects participated in the psychophysical and neuroimaging portions of the study, which took place over 2 d. The study consisted of initial psychophysical and neuroimaging assessments, followed by a training phase and then final psychophysical and imaging assessments. In the assessments, participants engaged in a two-interval forced choice (2-IFC) audiovisual simultaneity judgment task (Fig. 1a,b) wherein they reported which of two presentations of an audiovisual stimulus pair occurred simultaneously (i.e., at a stimulus onset asynchrony [SOA] of 0 ms). Within the other interval the stimuli were always asynchronously presented, at SOAs ranging from −300 ms (auditory leading visual) to 300 ms (visual leading auditory) in 50 ms increments. Following the initial assessment, participants were then trained on the same task. The training portion used identical stimuli but provided feedback on each trial as to the correctness of the participant's response. Neuroimaging assessments consisted of high-resolution T1 structural scans, resting state functional connectivity, blocked multisensory effective connectivity, and event-related fMRI scans wherein participants performed the same 2-IFC task. For practical reasons, fMRI data were only collected for SOAs of 0 ms (objective simultaneity), 300 ms (largest asynchrony), and an intermediate SOA determined for each participant, representing a value at or near the border of their individualized multisensory temporal binding window (labeled as RWS for “Right Window Size”).
In accordance with our prior psychophysical study (Powers et al., 2009), analysis of data from the participants who underwent training on the 2-IFC task revealed a marked narrowing of their multisensory temporal binding window. Figure 1c features data from one individual at baseline and upon final assessment. Note the significant improvements in performance following training, and the decline in the width of the temporal window (see Materials and Methods for details on how these windows were defined) from 219 ms at baseline to 146 ms at final assessment. Figure 1d depicts the significant change in the group window size following training. Whereas the mean baseline (i.e., pretraining) window size was 343 ms for the population of participants, following training this value declined to 231 ms (paired samples t test, p = 0.0098). Both the mean window size at baseline and the degree of narrowing exhibited by participants following training (33% decrease from baseline) are very similar to what has been previously described (Powers et al., 2009) and further illustrates the efficacy of this perceptual training regimen in altering audiovisual simultaneity perception.
Multisensory timing-dependent networks change with perceptual training
Central to the determination of which brain networks may underlie the improvements in multisensory temporal perception is the identification of brain areas that respond differentially to synchronous versus asynchronous presentations of audiovisual stimulus pairs. While a block design run was used in the current study, it was not used as a localizer, but rather, to create this contrast; two event-related runs from the pretraining session and two from the posttraining session were used separately as an event-related localizer, contrasting activity associated with synchronous presentation with that associated with asynchronous presentation. This choice was motivated by two factors: (1) Although the block localizer consisted of auditory-alone, visual-alone, and synchronous AV conditions, it did not contain an asynchronous audiovisual condition, which would allow the more powerful block design to be used as a localizer; (2) use of event-related runs as a localizer ensures that participants are attending to the factor of audiovisual simultaneity during the performance of the relevant task, thus making event-related runs a more relevant localizer for the task at hand. The event-related localizer identified a network of areas previously shown to be important for audiovisual synchrony perception, including the multisensory pSTS (Calvert et al., 2000, 2001; Dhamala et al., 2007; Noesselt et al., 2007; Stevenson et al., 2010), insula (Calvert et al., 2001), posterior parietal cortex (Dhamala et al., 2007), and lateral occipital cortex (Dhamala et al., 2007), as well as regions of visual (Noesselt et al., 2007; Stevenson et al., 2010) and auditory cortex (Noesselt et al., 2007; Stevenson et al., 2010) (Fig. 2, blue). Additionally, regions of the superior cerebellum closely associated with the nucleus interpositus, known from lesion and functional imaging studies to be important in subsecond timing tasks (Perrett et al., 1993; Bao et al., 2002; Kotani et al., 2003), were also identified.
Figure 2.
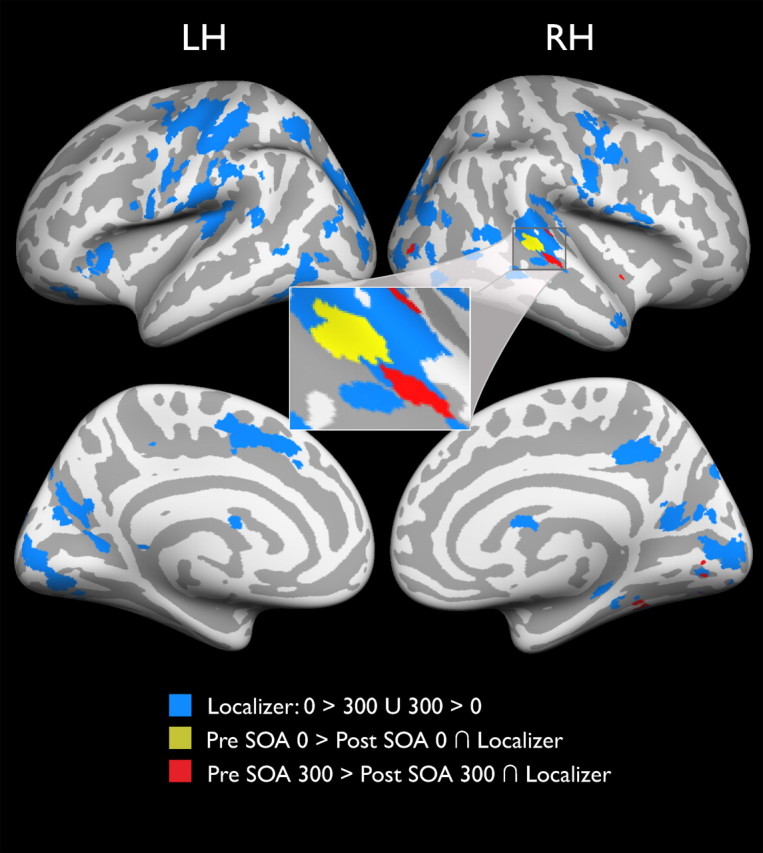
A network of synchrony-responsive brain regions changes with perceptual training. Group data from a random-effects analysis identifies cortical regions that are sensitive to synchrony versus asynchrony of audiovisual stimulus pairs in event-related localizer runs (blue shading). Other colors represent clusters that responded differentially to presentation of audiovisual pairs separated by the same stimulus onset asynchrony (yellow shading = SOA 0, red shading = SOA 300) in pretraining and posttraining scans. Inset shows clusters of activation centered on the pSTS. Cortical surface is created from the group average. Statistics for all contrasts were cluster-size corrected for multiple comparisons to α = 0.05 (starting t = 2.76, p = 0.01). LH, Left hemisphere; RH, right hemisphere.
After these initial analyses succeeded in identifying a plausible network of cortical areas that are differentially active to synchronous versus asynchronous audiovisual pair presentation, a second analysis sought to determine whether activity in these areas changed after training. On the whole-brain level, only two contrasts yielded significant clusters that overlapped with the event-related localizer. These two contrasts were at objective simultaneity (Pre-SOA 0 > Post-SOA 0; Fig. 2, yellow patches) and at long asynchrony (Pre-SOA 300 > Post-SOA 300; Fig. 2, red patches, both cluster-size corrected to α = 0.05 with starting p = 0.01, t = 2.76). These regions of overlap lie in canonically identified unisensory cortices as well as multisensory convergence areas (see Table 2), the most prominent of which (127 combined voxels) is centered on the right pSTS, an average of 28.13 (±4.16 SEM) voxels away from the centers of gravity of pSTS areas of activation identified in prior audiovisual synchrony detection studies (Calvert et al., 2000, 2001; Dhamala et al., 2007; Noesselt et al., 2007; Stevenson et al., 2010). Using these overlapping areas as cortical ROIs, we are able to analyze the details of their activity changes following multisensory perceptual training.
Table 2.
Condition by training interactions
| 0–300 | 0-RWS | RWS-300 | Incorrect–Correct 300 | Incorrect–Correct RWS | |
|---|---|---|---|---|---|
| Posterior pSTS ROI | |||||
| Pre | −0.010 ± 0.012 | −0.005 ± 0.01 | −0.005 ± 0.015 | 0.033 ± 0.03 | −0.005 ± 0.078 |
| Post | −0.004 ± 0.015 | −0.037 ± 0.019 | 0.034 ± 0.025 | 0.087 ± 0.068 | 0.015 ± 0.053 |
| p | 0.730 | 0.147 | 0.199 | 0.475 | 0.835 |
| Combined pSTS ROI | |||||
| Pre | −0.016 ± 0.011 | −0.01 ± 0.01 | −0.006 ± 0.014 | 0.038 ± 0.027 | −0.011 ± 0.081 |
| Post | 0.01 ± 0.016 | −0.028 ± 0.018 | 0.038 ± 0.024 | 0.087 ± 0.064 | −0.002 ± 0.048 |
| p | 0.211 | 0.376 | 0.123 | 0.487 | 0.924 |
| Anterior pSTS ROI | |||||
| Pre | −0.026 ± 0.011 | −0.017 ± 0.013 | −0.009 ± 0.012 | 0.047 ± 0.029 | −0.017 ± 0.09 |
| Post | 0.032 ± 0.02 | −0.012 ± 0.02 | 0.044 ± 0.023 | 0.083 ± 0.059 | −0.044 ± 0.042 |
| p | 0.020* | 0.816 | 0.059 | 0.592 | 0.785 |
| Auditory ROI | |||||
| Pre | −0.022 ± 0.015 | −0.004 ± 0.015 | −0.018 ± 0.014 | 0.023 ± 0.019 | −0.019 ± 0.056 |
| Post | 0.025 ± 0.013 | −0.007 ± 0.014 | 0.032 ± 0.016 | 0.095 ± 0.049 | 0 ± 0.043 |
| p | 0.029* | 0.869 | 0.029* | 0.190 | 0.793 |
| Visual ROI | |||||
| Pre | −0.044 ± 0.016 | −0.023 ± 0.011 | −0.02 ± 0.008 | −0.054 ± 0.045 | −0.018 ± 0.066 |
| Post | 0.019 ± 0.011 | 0.004 ± 0.011 | 0.015 ± 0.013 | 0.104 ± 0.061 | −0.048 ± 0.076 |
| p | 0.004* | 0.103 | 0.030* | 0.052 | 0.774 |
| Cerebellar ROI | |||||
| Pre | −0.032 ± 0.016 | −0.022 ± 0.016 | −0.01 ± 0.012 | −0.13 ± 0.086 | −0.07 ± 0.056 |
| Post | 0.025 ± 0.011 | −0.005 ± 0.008 | 0.03 ± 0.012 | 0.105 ± 0.066 | −0.008 ± 0.063 |
| p | 0.009* | 0.354 | 0.028* | 0.043* | 0.473 |
BOLD activity in pSTS decreases following training
The pSTS ROIs identified consists of separate but adjacent areas in the middle-posterior STS that exhibit significant decreases in BOLD activation after training (Fig. 3a, colors the same as for Fig. 2). To quantify these differences, the mean event-related ROI time courses were extracted for each individual, and the degree of BOLD activity change was taken as the mean percent signal change. The greatest magnitude change was seen in the simultaneous (SOA 0) and highly asynchronous (SOA 300) conditions in both the more anterior pSTS ROI (Fig. 3b; SOA 0: t(10) = 3.09, p = 0.0115; SOA 300: t(10) = 1.54, p = 0.155) and the more posterior pSTS ROI (Fig. 3d; SOA 300: t(10) = 2.57, p = 0.0278) as well as the two taken as one combined ROI (Fig. 3c; SOA 0: t(10) = 2.37, p = 0.0393; SOA 300: t(10) = 1.989; p = 0.0748). In contrast, no significant change was observed for the intermediate temporal (i.e., RWS) condition, defined for each individual using data from the baseline behavioral assessment.
BOLD signal decreases like those seen here have been interpreted to reflect improved efficiency of processing, wherein neuronal firing shifts from a large (and possibly more distributed) population of neurons to a more restricted and specialized subset (Mukai et al., 2007). Thus, the direction of change after training could be interpreted to support the hypothesis that training increases the efficiency of processing of objectively simultaneous and highly asynchronous stimulus pairs. To test this hypothesis further, time courses modeled on correct and incorrect (i.e., committed error) trials were extracted from the pSTS ROIs and analyzed for changes over the course of training. The expectation for these analyses within an increased efficiency of processing framework is a significant decrease in activation for correct SOA 300 trials, but not for correct SOA RWS trials or for incorrect trials at either SOA. This pattern of results was indeed observed in both of the individual ROIs (Fig. 3e,g; SOA 0: t(10) = 3.04, p = 0.0125; SOA 300: t(10) = 1.90, p = 0.0873), as well as for the combined pSTS ROI (Fig. 3f; t(10) = 2.71, p = 0.022). It may also be noted that incorrect trials in all three ROIs elicited greater mean BOLD activity in the RWS trials than in the SOA 300 trials, and that greater mean BOLD activity was seen in correct trials compared with incorrect trials in all three regions, although none of these values reached statistical significance.
Auditory and visual cortices as well as superior cerebellum exhibit decreases in BOLD activity following training
In addition to the training-related changes in activity observed in pSTS, similar decreases were seen in visual and auditory cortices for the SOA 300 condition. Figure 4a depicts the region of overlap between the event-related localizer and this training-related ROI. The region lies on posterior border of BA41, approximately corresponding to the junction between primary and secondary auditory cortex on probabilistic cytoarchitectonic maps (Rademacher et al., 2001). Quantification of the difference in activity observed in this region reveals a similar pattern of change to that seen in the pSTS ROIs at the SOA 300 condition (t(10) = 2.72, p = 0.0214), but little change for either of the other conditions (Fig. 4b). Also similar to the results seen in the pSTS ROIs, activity in this region shows a trend to decline selectively for correct trials on the SOA 300 condition only, although this decrease fails to reach statistical significance (Fig. 4c; t(10) = 1.713, p = 0.117).
A similar but more pronounced pattern of results is seen in visual cortex. Figure 4d illustrates the overlap-defined regions of interest in visual areas in relation to Brodmann areas 17 through 19 on the medial aspect of the occipital lobe, and for the middle temporal area (MT) on its lateral aspect. The two smaller areas of activation displayed on the medial aspect appear to lie within BA 17 and 18 (MNI305 template). Once again, it should be noted that these regions of interest represent the areas of overlap between the synchrony/asynchrony event-related localizer (SOA 0 > SOA 300) and regions that change following training (i.e., Pre-SOA 300 > Post-SOA 300), which have themselves been statistically corrected via cluster-size thresholding (hence, these clusters, while small, represent significant activations). The larger area of overlap on the lateral surface (40 total voxels) appears to lie at the border between MT and the lateral borders of BA 18/19 in the middle occipital sulcus, in close proximity to but not contiguous with the smaller clusters. Combined analysis of BOLD activity in these regions reveals a large decrease after training in SOA 300 conditions (Fig. 4e; t(10) = 3.17, p = 0.0099), as well as a significant preferential decrease in activity in SOA 300 correct trials (Fig. 4f; t(10) = 2.80, p = 0.0188).
Of the group-defined regions of interest listed in Table 1, the activation found in the superior cerebellum stands out as the only area outside of the cerebral cortex. Figure 4g shows a parasagittal section of the cerebellum, with the cerebellar ROI situated in the vermal declive [AAL Region VI (Schmahmann et al., 1999; Tzourio-Mazoyer et al., 2002)]. Again consistent with the previously described patterns, quantification of BOLD activity during pretraining and posttraining conditions revealed a significant decrease only in the SOA 300 condition (Fig. 4h; t(10) = 2.99, p = 0.0135). Also similar to the results seen in the previously characterized ROIs, activity in this region declines preferentially in the correct trials on the SOA 300 condition only (Fig. 4i; t(10) = 2.46, p = 0.0338).
Table 1.
Regions exhibiting event-related localizer and pretraining/posttraining differences
| Region | Center of gravity |
||||||
|---|---|---|---|---|---|---|---|
| Cluster Size (voxels) | X | Y | Z | t(10) | p-unc | p-FDR | |
| Pre 0 > Post 0 ∩ event-related localizer | |||||||
| Right posterior superior temporal sulcus | 77 | 62 | −34 | −4 | 3.83 | 0.003313 | 0.00994 |
| Pre 300 > Post 300 ∩ event-related localizer | |||||||
| Right medial superior cerebellum (culmen) | 162 | 36 | −60 | −32 | 3.34 | 0.007434 | 0.029555 |
| Right posterior superior temporal sulcus | 50 | 52 | −22 | −10 | 3.23 | 0.008987 | 0.029555 |
| Right cuneus | 3 | 4 | −76 | 2 | 3 | 0.013434 | 0.029555 |
| Left superior temporal gyrus | 2 | −46 | −34 | 12 | 2.89 | 0.016233 | 0.029761 |
Regions listed are identified as an overlap of synchrony- and training-responsive areas. p values listed are reported before and after cluster-wise FDR correction for multiple comparisons.
Because BOLD decreases have also been shown to result from repeated exposure to sensory stimuli (Desimone, 1996), differential responses to the various stimulus conditions would lend more evidence to the interpretation that BOLD decreases denote learning as opposed to adaptation effects. Therefore, condition-by-training interactions were calculated as the contrasts of contrasts for the pSTS, visual, auditory, and cerebellar ROIs described above (Table 2). Most noteworthy among these results, there are significant increases in the differential response to SOA 300 and SOA 0 presentations in the anterior pSTS, auditory, visual, and cerebellar ROIs. This was coupled with the absence of effects for the combined pSTS and posterior pSTS ROIs (likely driven by concomitant decreases in response to SOA 0 conditions). Similarly, there are significant increases in the differential response to SOA 300 and SOA RWS presentations in these same regions, with interactions approaching significance in the posterior pSTS (p = 0.199) and combined pSTS (p = 0.123) ROIs. In examination of the differential responses to correct versus incorrect trials, significant results are seen in the cerebellar and visual ROIs at the SOA 300 condition, while other ROIs do not exhibit significant results, likely driven by the exceedingly large variances exhibited by responses in incorrect trials (Figs. 3e–g, 4c,f,i). In contrast, there are no significant correctness-training interactions in RWS trials.
Resting state functional connectivity increases are seen between pSTS and auditory areas after training
Having identified a network of cortical sensory areas that appear to play a role in the training-induced changes in the multisensory temporal binding window, we next sought to identify changes in inherent functional coupling between the pSTS ROI and the other nodes in this network. Data collected during pretraining and posttraining resting-state functional runs were analyzed using the combined pSTS ROI as a seed. While there was nearly complete overlap in the regions coupled with pSTS before and after training, Figure 5 highlights those cortical areas that increase their resting state functional coupling with pSTS after training (Fig. 5a). These include right superior temporal gyrus (secondary auditory cortex; 50 voxels; peak intensity t = 5.36), right parahippocampal gyrus (69 voxels; peak intensity t = 8.77), inferior parietal sulcus (29 voxels; peak intensity t = 5.81), and left premotor cortex (13 voxels; peak intensity, t = 4.26). In addition, increased resting state functional coupling after training was observed in the superior colliculus (44 voxels; peak intensity t = 6.53; Fig. 5b) as well as superior cerebellum (88 voxels; peak intensity t = 6.22). In contrast, a test for areas that decreased their coupling with the pSTS ROI after training yielded no significant results.
Figure 5.

Resting state functional connectivity increases are seen between pSTS and auditory areas after training. a, Cortical areas whose activity is more positively correlated with the combined pSTS ROI after training. b, Resting state functional connectivity increases between pSTS and superior colliculus after training. Coordinates: [0, −31, −11]. Both images, t = 2.76, p = 0.01; cluster-size corrected to α = 0.05.
Effective connectivity increases among pSTS and unisensory areas are seen after training
While resting-state functional connectivity results indicate alterations in inherent functional connectivity between the pSTS and a network of cortical and subcortical structures following perceptual training, they are not able to reveal task-related or directional connectivity changes between these (and other) areas. Hence, as the next step in these analyses, a dynamic causal modeling approach was taken to examine training-related changes in effective connectivity. Figure 6a illustrates a dynamic causal model (DCM) using VOIs based upon the unisensory and multisensory ROIs identified in the current study. The connections (statistical dependencies) among these ROIs are based upon previous functional (Noesselt et al., 2007) and neuroanatomical (Barnes and Pandya, 1992; Hackett et al., 1998; Falchier et al., 2002; Cappe and Barone, 2005) studies. The analysis represents two families of models, structured to examine feedforward and feedback connectivity between pSTS and visual and auditory cortices and either omitting (Fig. 6a, solid lines) or including (Fig. 6a, dashed lines) direct feedforward and feedback connections between the visual and auditory VOIs. Placed into the context of a blocked design during which A, V, and combined AV stimulus pairs were presented, these stimulation periods (interspersed with rest blocks) serve as predictable direct driving forces for the visual and auditory areas being examined (Fig. 6a, red arrows).
Working from this simple model, we hypothesized that the proposed intrinsic connectivity within this network might be modified in response to combined AV presentation in different ways before and after training. Figure 6b depicts results of Bayesian model selection for pretraining and posttraining sessions. In this probabilistic framework, the evidence that a given model has produced the data observed is calculated as the product of the likelihood of observing the data given such a model and the prior likelihood that the model is true (Chater and Oaksford, 2008; Rosa et al., 2010). This value was estimated for each model in each individual dataset for pretraining and posttraining sessions, and the exceedance probability (Pe, the likelihood that one model better explains the data than any other) was calculated for each model. The color plots shown in Figure 6b depict the results of this analysis for both pretraining and posttraining sessions. Note first that the exceedance probabilities associated with the four-connection model family (omitting direct connectivity between auditory and visual regions) are significantly lower than those associated with the six-connection model family in both pretraining and posttraining assessments (four connection mean: 0.0461; six connection mean: 0.0678; t(11) = 2.604; p = 0.0245), indicating that those models including direct connectivity between visual and auditory areas better explain the observed data.
In the pretraining session, the model hypothesizing modulation of feedforward connectivity from auditory and visual regions to pSTS during combined AV presentation emerges as a clear winner (Pe: 0.1580; Fig. 6b, asterisk), followed most closely by the model hypothesizing modulation of only the connection between the visual VOI and pSTS during combined AV presentation. (Pe: 0.1374).
This feedforward dominance is in striking contrast to the pattern observed in the posttraining session. Here, while the model depicting modulated feedback connectivity from pSTS to the visual VOI exhibits the highest Pe (0.0773; Fig. 6b, asterisk), the overall pattern is one of a much more distributed network in the posttraining session. Thus, closely following the leading model are those depicting modulated feedback from pSTS to auditory regions and combined feedback from pSTS to auditory and visual regions (Pe for both: 0.0771) as well as models depicting modulated connectivity from auditory to visual regions (Pe: 0.0769), from visual to auditory regions (Pe: 0.0760), and both (Pe: 0.0768) during combined AV presentation.
This switch from a predominantly feedforward model to a more distributed network after training is further illustrated in the results of group Bayesian model averaging depicted in Figure 6c. Most notably, there are clear differences in intrinsic connectivity (arrows directly linking each VOI depicted) between the averaged pretraining and posttraining models. While both exhibit positive intrinsic connectivity between pSTS and the auditory and visual VOIs (pretraining posterior probabilities for each = 1.00; posttraining posterior probabilities: A→pSTS: 1.000; V→pSTS: 0.988; pSTS→V: 0.912; pSTS→A: 0.912), pretraining intrinsic connectivity from the visual to the auditory VOI does not reach significance (posterior probability: 0.896), whereas that from auditory to visual exhibits significant negative connectivity (posterior probability: 1.000). This is strikingly different from the pattern exhibited in the posttraining averaged model, where significant positive intrinsic connectivity between auditory and visual VOIs is found (posterior probabilities: V→A: 0.974; A→V: 0.999).
Discussion
The data presented here represent the first attempt to both characterize and alter the dynamics of a network of sensory areas underlying a fundamental and ethologically important perceptual process—judgments of audiovisual simultaneity. In doing so, we have demonstrated not only that certain nodes of the network are strongly tied to audiovisual binding, but also that their activity and connectivity change after perceptual learning in a way that clarifies the roles they play during everyday perception of multisensory events.
That the neural signature of learning in this study was associated with a decrease in BOLD activity at key sensory nodes is not unprecedented; activity decreases in sensory cortices have been shown to correlate with perceptual learning of visual contrast (Mukai et al., 2007), illusory contours (Maertens and Pollmann, 2005), and orientation discrimination (Schiltz et al., 1999), along with implicit learning of visual categories (Reber et al., 1998), as well as after training on a visual object tracking task (Tomasi et al., 2004). In the context of multisensory integration, BOLD decreases in right supramarginal gyrus have more recently been shown to correlate with perception of the McGurk illusion (Wiersinga-Post et al., 2010). A consistent interpretation of these learning-related BOLD decreases has been that they reflect improved efficiency of processing, manifested as a shift in neuronal firing from a large population of neurons to a smaller, more specialized (and perhaps more sparsely distributed) subset (Mukai et al., 2007). Such an effect is consistent with electrophysiological studies of visual recognition memory (Miller et al., 1991) and perceptual learning (Ghose et al., 2002), as well as with most efforts to model the neural plasticity associated with perceptual learning (Hoshino, 2004).
Given that adaptation to repeated sensory stimuli also produces decreases in cortical activity profiles (Desimone, 1996), it is important to distinguish between adaptation and perceptual learning as the likely agent of the observed changes. The stimulus conditions presented in the scanning sessions were selected with the expectation that BOLD changes would likely be present in the RWS condition, with less of a change or no change at all observed during the 300 or 0 ms conditions. As noted, the data show an opposite pattern of results. Nonetheless, the fact that the BOLD decreases were specific to the objectively simultaneous (i.e., SOA 0) and highly asynchronous (i.e., SOA 300) conditions, and not to the individualized threshold asynchrony condition (i.e., SOA RWS), argues strongly in favor of perceptual learning (since adaptation effects should accompany all conditions equivalently). This interpretation is further supported by the condition-by-training interactions shown in Table 2, highlighting differential BOLD activity particularly between the SOA 300 condition and the SOA 0 condition after training. Similarly, that decreases were limited to correct trials supports the hypothesis that increased processing efficiency [and thus that decreases in effort needed to reach maximal performance on less challenging conditions (Schiltz et al., 1999)] is driving the observed changes, although the relatively small number of incorrect trials at the SOA 300 condition may represent a significant limitation. A combination of task difficulty and small effect size may have obscured any change in BOLD signal at the RWS condition, but had participants been required to complete a full 5 d of training (Powers et al., 2009), thus overlearning the task, BOLD changes at the RWS condition may well have also been observed.
It is clear from these results that pSTS is a major locus of change in this study. The location of the ROI identified here is remarkably similar to that shown in previous studies of multisensory synchrony perception (Calvert et al., 2000, 2001; Bushara et al., 2001; Macaluso et al., 2004; Noesselt et al., 2007), and the BOLD decreases in adjacent regions in response to synchronous and asynchronous stimuli are highly reminiscent of the adjacent regions within pSTS recently identified to be selectively responsive to synchronous and asynchronous audiovisual stimulus streams (Stevenson et al., 2010). Equally as striking as the training-related decreases in BOLD activity were the changes in functional connectivity within a network of sensory brain areas. Key results of these connectivity-based analyses include that pSTS exhibits a higher degree of resting state functional coupling with auditory cortex after training, and that a network of areas including pSTS and regions of auditory and visual cortex exhibits a switch from a primarily feedforward network to one wherein feedback connectivity during combined AV presentation and inherent connectivity between unisensory auditory and visual regions appears to be enhanced after training. This greater functional coupling may translate to more efficient transfer of information among these regions and may explain the local effect of BOLD decreases observed after training. Recent work with simultaneously recorded EEG and fMRI indicate a relationship between BOLD decreases and enhanced beta power during a semantic encoding task (Hanslmayr et al., 2011), and a similar relationship may be present here between the enhanced functional coupling and BOLD signal decreases after training, but more spatially and temporally precise measures may be needed to test this hypothesis. Anatomical and electrophysiological studies of pSTS provide additional support for the plausibility of this model. Thus, it has been shown that primate auditory belt regions exhibit strong feedforward and feedback interconnectivity with pSTS (Barnes and Pandya, 1992; Hackett et al., 1998; Cappe and Barone, 2005), and that pSTS receives abundant input from adjacent visual areas (Barnes and Pandya, 1992). Likewise, projections from pSTS and auditory cortex to lateral occipital visual areas and even primary visual cortex have been well characterized (Falchier et al., 2002). Moreover, rapid changes in connectivity between association auditory and visual cortices have been demonstrated in the context of several multisensory tasks (von Kriegstein and Giraud, 2006; Cappe et al., 2010), and oscillatory activity has been shown to play a key role in multisensory integration of temporally congruent stimuli (Nozaradan et al., 2011), lending further plausibility to this construct. The current data greatly expand this framework by providing the first evidence that pSTS, in coordination with visual and auditory areas, plays a central role in orchestrating plastic changes in a fundamental construct of multisensory temporal processing that are stable across time, and lend predictive power to the hypothesis that multisensory perceptual training on a simultaneity judgment task may influence other measures of multisensory binding and unisensory temporal processing as well. Indeed, similar circuitry has been shown to be involved in both the McGurk effect (Wiersinga-Post et al., 2010) and the sound-induced-flash illusion (Mishra et al., 2008), and cross-modal effects of temporal training have recently been demonstrated (Alais and Cass, 2010).
The enhanced resting state functional connectivity between pSTS and both superior colliculus (SC) and superior cerebellum following training is interesting because of the roles these regions play in multisensory integration and supramodal temporal processing, respectively. However, the contributions of these areas to the observed perceptual plasticity remain unknown. The SC, despite its central role in multisensory integration (Stein and Meredith, 1993) and its activation in several studies examining audiovisual simultaneity perception (Bushara et al., 2001; Calvert et al., 2001), does not itself exhibit BOLD changes after training. In contrast, the SC does show enhanced coupling with pSTS after training, and offers support to the view that the connectivity between SC and multisensory and unisensory cortical areas is important for audiovisual simultaneity detection (Bushara et al., 2001; Dhamala et al., 2007). The presence of activation changes and functional interactions between the pSTS and the cerebellum carries with it implications for alterations of supramodal timing mechanisms via audiovisual perceptual training, although cerebellar regions have been shown to be directly responsive to visual and auditory stimuli (Baumann and Mattingley, 2010), as well as in the anticipation of sensory events (Bueti et al., 2010).
From a clinical perspective, the similarity between the regions influenced by the current perceptual training protocol and those altered in individuals with conditions in which multisensory processing is impacted is striking. For example, in addition to having enlarged multisensory temporal binding windows (Hairston et al., 2005), individuals with developmental dyslexia also exhibit altered BOLD activity in pSTS compared with typical-reading controls during auditory and visual nonword rhyming (Rumsey et al., 1992; Shaywitz et al., 2002), pseudo-word processing (Brunswick et al., 1999; Paulesu et al., 2001), and letter-word sound matching (Blau et al., 2010). Additionally, an alternate accounting of the functional deficits seen in children with dyslexia has emphasized the role of cerebellum in the development of reading automaticity (Fawcett et al., 2001; Stoodley et al., 2005; Stoodley and Stein, 2011). Supporting evidence for this comes from demonstrated BOLD decreases in vermal lobule VI in children with dyslexia compared with typical-reading controls during pattern learning (Jenkins et al., 1994). Similarly, in children with autism spectrum disorders (ASD), pSTS appears to be an important affected region, with decreases in gray matter density, resting hypoperfusion, and abnormal activation all being noted (Zilbovicius et al., 2006; Redcay, 2008). Moreover, amodal (Brock et al., 2002) and multisensory (Foss-Feig et al., 2010; Kwakye et al., 2011) timing deficits have been demonstrated in individuals with ASD, and may be associated with morphological (Courchesne et al., 1988; Courchesne, 1995; Mitchell et al., 2009) and functional (Mostofsky et al., 2009) changes in the superior cerebellum that correlate with disease severity. Last, it is clear that both multisensory processing (Ross et al., 2007; de Jong et al., 2009; Jardri et al., 2009) and pSTS activity during audiovisual speech binding (Szycik et al., 2009) is altered in individuals with schizophrenia when compared with matched controls. Given that these deficits and the plastic changes demonstrated here are likely to be reflective of changes in local neural architecture (Brock et al., 2002), these results point to multisensory temporal training as an especially promising new avenue for exploration of the contribution of multisensory processing to these disorders.
In summary, the results reported here illustrate that the narrowing of the multisensory temporal binding window is accompanied by decreases in BOLD activity within a network of multisensory and unisensory areas, as well as by changes in resting-state and task-related functional coupling among these areas.
Footnotes
This research was supported by the Vanderbilt Kennedy Center for Research on Human Development, the National Institute for Child Health and Development (Grant HD050860), and the National Institute for Deafness and Communication Disorders (Grant F30 DC009759). We thank Drs. Calum Avison, Randolph Blake, Maureen Gannon, and Daniel Polley, as well as Andrea Hillock, Leslie Dowell, Emily Maston, and Zachary Barnett for their technical, conceptual, and editorial assistance.
References
- Alais D, Cass J. Multisensory perceptual learning of temporal order: audiovisual learning transfers to vision but not audition. PLoS One. 2010;5:e11283. doi: 10.1371/journal.pone.0011283. [DOI] [PMC free article] [PubMed] [Google Scholar]
- Bai B, Kantor P. A shape-based finite impulse response model for functional brain images. Proceedings of the 2007 IEEE International Symposium on Biomedical Imaging: From Nano to Macro; April 12–16; Washington, DC. 2007. pp. 440–443. [Google Scholar]
- Bai B, Kantor P, Shokoufandeh A. Effectiveness of the finite impulse response model in content-based fMRI image retrieval. Med Image Comput Comput Assist Interv. 2007;10:742–750. doi: 10.1007/978-3-540-75759-7_90. [DOI] [PubMed] [Google Scholar]
- Bao S, Chen L, Kim JJ, Thompson RF. Cerebellar cortical inhibition and classical eyeblink conditioning. Proc Natl Acad Sci U S A. 2002;99:1592–1597. doi: 10.1073/pnas.032655399. [DOI] [PMC free article] [PubMed] [Google Scholar]
- Barnes CL, Pandya DN. Efferent cortical connections of multimodal cortex of the superior temporal sulcus in the rhesus monkey. J Comp Neurol. 1992;318:222–244. doi: 10.1002/cne.903180207. [DOI] [PubMed] [Google Scholar]
- Baumann O, Mattingley JB. Scaling of neural responses to visual and auditory motion in the human cerebellum. J Neurosci. 2010;30:4489–4495. doi: 10.1523/JNEUROSCI.5661-09.2010. [DOI] [PMC free article] [PubMed] [Google Scholar]
- Bischoff M, Walter B, Blecker CR, Morgen K, Vaitl D, Sammer G. Utilizing the ventriloquism-effect to investigate audio-visual binding. Neuropsychologia. 2007;45:578–586. doi: 10.1016/j.neuropsychologia.2006.03.008. [DOI] [PubMed] [Google Scholar]
- Biswal B, Yetkin FZ, Haughton VM, Hyde JS. Functional connectivity in the motor cortex of resting human brain using echo-planar MRI. Magn Reson Med. 1995;34:537–541. doi: 10.1002/mrm.1910340409. [DOI] [PubMed] [Google Scholar]
- Blau V, Reithler J, van Atteveldt N, Seitz J, Gerretsen P, Goebel R, Blomert L. Deviant processing of letters and speech sounds as proximate cause of reading failure: a functional magnetic resonance imaging study of dyslexic children. Brain. 2010;133:868–879. doi: 10.1093/brain/awp308. [DOI] [PubMed] [Google Scholar]
- Brock J, Brown CC, Boucher J, Rippon G. The temporal binding deficit hypothesis of autism. Dev Psychopathol. 2002;14:209–224. doi: 10.1017/s0954579402002018. [DOI] [PubMed] [Google Scholar]
- Brunswick N, McCrory E, Price CJ, Frith CD, Frith U. Explicit and implicit processing of words and pseudowords by adult developmental dyslexics: a search for Wernicke's Wortschatz? Brain. 1999;122:1901–1917. doi: 10.1093/brain/122.10.1901. [DOI] [PubMed] [Google Scholar]
- Bueti D, Bahrami B, Walsh V, Rees G. Encoding of temporal probabilities in the human brain. J Neurosci. 2010;30:4343–4352. doi: 10.1523/JNEUROSCI.2254-09.2010. [DOI] [PMC free article] [PubMed] [Google Scholar]
- Buracas GT, Boynton GM. Efficient design of event-related fMRI experiments using M-sequences. Neuroimage. 2002;16:801–813. doi: 10.1006/nimg.2002.1116. [DOI] [PubMed] [Google Scholar]
- Bushara KO, Grafman J, Hallett M. Neural correlates of auditory-visual stimulus onset asynchrony detection. J Neurosci. 2001;21:300–304. doi: 10.1523/JNEUROSCI.21-01-00300.2001. [DOI] [PMC free article] [PubMed] [Google Scholar]
- Calvert GA, Campbell R, Brammer MJ. Evidence from functional magnetic resonance imaging of crossmodal binding in the human heteromodal cortex. Curr Biol. 2000;10:649–657. doi: 10.1016/s0960-9822(00)00513-3. [DOI] [PubMed] [Google Scholar]
- Calvert GA, Hansen PC, Iversen SD, Brammer MJ. Detection of audio-visual integration sites in humans by application of electrophysiological criteria to the BOLD effect. Neuroimage. 2001;14:427–438. doi: 10.1006/nimg.2001.0812. [DOI] [PubMed] [Google Scholar]
- Cappe C, Barone P. Heteromodal connections supporting multisensory integration at low levels of cortical processing in the monkey. Eur J Neurosci. 2005;22:2886–2902. doi: 10.1111/j.1460-9568.2005.04462.x. [DOI] [PubMed] [Google Scholar]
- Cappe C, Thut G, Romei V, Murray MM. Auditory-visual multisensory interactions in humans: timing, topography, directionality, and sources. J Neurosci. 2010;30:12572–12580. doi: 10.1523/JNEUROSCI.1099-10.2010. [DOI] [PMC free article] [PubMed] [Google Scholar]
- Chater N, Oaksford M. The probabilistic mind: prospects for Bayesian cognitive science. Oxford UP: 2008. [Google Scholar]
- Colonius H, Diederich A. Multisensory interaction in saccadic reaction time: a time-window-of-integration model. J Cogn Neurosci. 2004;16:1000–1009. doi: 10.1162/0898929041502733. [DOI] [PubMed] [Google Scholar]
- Courchesne E. New evidence of cerebellar and brainstem hypoplasia in autistic infants, children and adolescents: the MR imaging study by Hashimoto and colleagues. J Autism Dev Disord. 1995;25:19–22. doi: 10.1007/BF02178164. [DOI] [PubMed] [Google Scholar]
- Courchesne E, Yeung-Courchesne R, Press GA, Hesselink JR, Jernigan TL. Hypoplasia of cerebellar vermal lobules VI and VII in autism. N Engl J Med. 1988;318:1349–1354. doi: 10.1056/NEJM198805263182102. [DOI] [PubMed] [Google Scholar]
- de Jong JJ, Hodiamont PP, Van den Stock J, de Gelder B. Audiovisual emotion recognition in schizophrenia: reduced integration of facial and vocal affect. Schizophr Res. 2009;107:286–293. doi: 10.1016/j.schres.2008.10.001. [DOI] [PubMed] [Google Scholar]
- Desimone R. Neural mechanisms for visual memory and their role in attention. Proc Natl Acad Sci U S A. 1996;93:13494–13499. doi: 10.1073/pnas.93.24.13494. [DOI] [PMC free article] [PubMed] [Google Scholar]
- Dhamala M, Assisi CG, Jirsa VK, Steinberg FL, Kelso JA. Multisensory integration for timing engages different brain networks. Neuroimage. 2007;34:764–773. doi: 10.1016/j.neuroimage.2006.07.044. [DOI] [PMC free article] [PubMed] [Google Scholar]
- Falchier A, Clavagnier S, Barone P, Kennedy H. Anatomical evidence of multimodal integration in primate striate cortex. J Neurosci. 2002;22:5749–5759. doi: 10.1523/JNEUROSCI.22-13-05749.2002. [DOI] [PMC free article] [PubMed] [Google Scholar]
- Fawcett AJ, Nicolson RI, Maclagan F. Cerebellar tests differentiate between groups of poor readers with and without IQ discrepancy. J Learn Disabil. 2001;34:119–135. doi: 10.1177/002221940103400203. [DOI] [PubMed] [Google Scholar]
- Forman SD, Cohen JD, Fitzgerald M, Eddy WF, Mintun MA, Noll DC. Improved assessment of significant activation in functional magnetic resonance imaging (fMRI): use of a cluster-size threshold. Magn Reson Med. 1995;33:636–647. doi: 10.1002/mrm.1910330508. [DOI] [PubMed] [Google Scholar]
- Foss-Feig JH, Kwakye LD, Cascio CJ, Burnette CP, Kadivar H, Stone WL, Wallace MT. An extended multisensory temporal binding window in autism spectrum disorders. Exp Brain Res. 2010;203:381–389. doi: 10.1007/s00221-010-2240-4. [DOI] [PMC free article] [PubMed] [Google Scholar]
- Friston KJ, Harrison L, Penny W. Dynamic causal modelling. Neuroimage. 2003;19:1273–1302. doi: 10.1016/s1053-8119(03)00202-7. [DOI] [PubMed] [Google Scholar]
- Ghose GM, Yang T, Maunsell JH. Physiological correlates of perceptual learning in monkey V1 and V2. J Neurophysiol. 2002;87:1867–1888. doi: 10.1152/jn.00690.2001. [DOI] [PubMed] [Google Scholar]
- Hackett TA, Stepniewska I, Kaas JH. Subdivisions of auditory cortex and ipsilateral cortical connections of the parabelt auditory cortex in macaque monkeys. J Comp Neurol. 1998;394:475–495. doi: 10.1002/(sici)1096-9861(19980518)394:4<475::aid-cne6>3.0.co;2-z. [DOI] [PubMed] [Google Scholar]
- Hairston WD, Burdette JH, Flowers DL, Wood FB, Wallace MT. Altered temporal profile of visual-auditory multisensory interactions in dyslexia. Exp Brain Res. 2005;166:474–480. doi: 10.1007/s00221-005-2387-6. [DOI] [PubMed] [Google Scholar]
- Hanslmayr S, Volberg G, Wimber M, Raabe M, Greenlee MW, Bäuml KH. The relationship between brain oscillations and BOLD signal during memory formation: a combined EEG-fMRI study. J Neurosci. 2011;31:15674–15680. doi: 10.1523/JNEUROSCI.3140-11.2011. [DOI] [PMC free article] [PubMed] [Google Scholar]
- Hoshino O. Neuronal bases of perceptual learning revealed by a synaptic balance scheme. Neural Comput. 2004;16:563–594. doi: 10.1162/089976604772744910. [DOI] [PubMed] [Google Scholar]
- Innes-Brown H, Crewther D. The impact of spatial incongruence on an auditory-visual illusion. PLoS One. 2009;4:e6450. doi: 10.1371/journal.pone.0006450. [DOI] [PMC free article] [PubMed] [Google Scholar]
- Jardri R, Pins D, Bubrovszky M, Lucas B, Lethuc V, Delmaire C, Vantyghem V, Despretz P, Thomas P. Neural functional organization of hallucinations in schizophrenia: multisensory dissolution of pathological emergence in consciousness. Conscious Cogn. 2009;18:449–457. doi: 10.1016/j.concog.2008.12.009. [DOI] [PubMed] [Google Scholar]
- Jenkins IH, Brooks DJ, Nixon PD, Frackowiak RS, Passingham RE. Motor sequence learning: a study with positron emission tomography. J Neurosci. 1994;14:3775–3790. doi: 10.1523/JNEUROSCI.14-06-03775.1994. [DOI] [PMC free article] [PubMed] [Google Scholar]
- Kasess CH, Stephan KE, Weissenbacher A, Pezawas L, Moser E, Windischberger C. Multi-subject analyses with dynamic causal modeling. Neuroimage. 2010;49:3065–3074. doi: 10.1016/j.neuroimage.2009.11.037. [DOI] [PMC free article] [PubMed] [Google Scholar]
- Kotani S, Kawahara S, Kirino Y. Purkinje cell activity during learning a new timing in classical eyeblink conditioning. Brain Res. 2003;994:193–202. doi: 10.1016/j.brainres.2003.09.036. [DOI] [PubMed] [Google Scholar]
- Kwakye LD, Foss-Feig JH, Cascio CJ, Stone WL, Wallace MT. Altered auditory and multisensory temporal processing in autism spectrum disorders. Front Integr Neurosci. 2011;4:129. doi: 10.3389/fnint.2010.00129. [DOI] [PMC free article] [PubMed] [Google Scholar]
- Lancaster JL, Woldorff MG, Parsons LM, Liotti M, Freitas CS, Rainey L, Kochunov PV, Nickerson D, Mikiten SA, Fox PT. Automated Talairach atlas labels for functional brain mapping. Hum Brain Mapp. 2000;10:120–131. doi: 10.1002/1097-0193(200007)10:3<120::AID-HBM30>3.0.CO;2-8. [DOI] [PMC free article] [PubMed] [Google Scholar]
- Lee L, Friston K, Horwitz B. Large-scale neural models and dynamic causal modelling. Neuroimage. 2006;30:1243–1254. doi: 10.1016/j.neuroimage.2005.11.007. [DOI] [PubMed] [Google Scholar]
- Macaluso E, George N, Dolan R, Spence C, Driver J. Spatial and temporal factors during processing of audiovisual speech: a PET study. Neuroimage. 2004;21:725–732. doi: 10.1016/j.neuroimage.2003.09.049. [DOI] [PubMed] [Google Scholar]
- Maertens M, Pollmann S. Interhemispheric resource sharing: decreasing benefits with increasing processing efficiency. Brain Cogn. 2005;58:183–192. doi: 10.1016/j.bandc.2004.11.002. [DOI] [PubMed] [Google Scholar]
- Maldjian JA, Laurienti PJ, Kraft RA, Burdette JH. An automated method for neuroanatomic and cytoarchitectonic atlas-based interrogation of fMRI data sets. Neuroimage. 2003;19:1233–1239. doi: 10.1016/s1053-8119(03)00169-1. [DOI] [PubMed] [Google Scholar]
- Meredith MA, Nemitz JW, Stein BE. Determinants of multisensory integration in superior colliculus neurons. I. Temporal factors. J Neurosci. 1987;7:3215–3229. doi: 10.1523/JNEUROSCI.07-10-03215.1987. [DOI] [PMC free article] [PubMed] [Google Scholar]
- Miller EK, Li L, Desimone R. A neural mechanism for working and recognition memory in inferior temporal cortex. Science. 1991;254:1377–1379. doi: 10.1126/science.1962197. [DOI] [PubMed] [Google Scholar]
- Mishra J, Martinez A, Hillyard SA. Cortical processes underlying sound-induced flash fusion. Brain Res. 2008;1242:102–115. doi: 10.1016/j.brainres.2008.05.023. [DOI] [PMC free article] [PubMed] [Google Scholar]
- Mitchell SR, Reiss AL, Tatusko DH, Ikuta I, Kazmerski DB, Botti JA, Burnette CP, Kates WR. Neuroanatomic alterations and social and communication deficits in monozygotic twins discordant for autism disorder. Am J Psychiatry. 2009;166:917–925. doi: 10.1176/appi.ajp.2009.08101538. [DOI] [PubMed] [Google Scholar]
- Mostofsky SH, Powell SK, Simmonds DJ, Goldberg MC, Caffo B, Pekar JJ. Decreased connectivity and cerebellar activity in autism during motor task performance. Brain. 2009;132:2413–2425. doi: 10.1093/brain/awp088. [DOI] [PMC free article] [PubMed] [Google Scholar]
- Mukai I, Kim D, Fukunaga M, Japee S, Marrett S, Ungerleider LG. Activations in visual and attention-related areas predict and correlate with the degree of perceptual learning. J Neurosci. 2007;27:11401–11411. doi: 10.1523/JNEUROSCI.3002-07.2007. [DOI] [PMC free article] [PubMed] [Google Scholar]
- Noesselt T, Rieger JW, Schoenfeld MA, Kanowski M, Hinrichs H, Heinze HJ, Driver J. Audiovisual temporal correspondence modulates human multisensory superior temporal sulcus plus primary sensory cortices. J Neurosci. 2007;27:11431–11441. doi: 10.1523/JNEUROSCI.2252-07.2007. [DOI] [PMC free article] [PubMed] [Google Scholar]
- Nozaradan S, Peretz I, Mouraux A. Steady-state evoked potentials as an index of multisensory temporal binding. Neuroimage. 2011;60:21–28. doi: 10.1016/j.neuroimage.2011.11.065. [DOI] [PubMed] [Google Scholar]
- Paulesu E, Démonet JF, Fazio F, McCrory E, Chanoine V, Brunswick N, Cappa SF, Cossu G, Habib M, Frith CD, Frith U. Dyslexia: cultural diversity and biological unity. Science. 2001;291:2165–2167. doi: 10.1126/science.1057179. [DOI] [PubMed] [Google Scholar]
- Perrett SP, Ruiz BP, Mauk MD. Cerebellar cortex lesions disrupt learning-dependent timing of conditioned eyelid responses. J Neurosci. 1993;13:1708–1718. doi: 10.1523/JNEUROSCI.13-04-01708.1993. [DOI] [PMC free article] [PubMed] [Google Scholar]
- Powers AR, 3rd, Hillock AR, Wallace MT. Perceptual training narrows the temporal window of multisensory binding. J Neurosci. 2009;29:12265–12274. doi: 10.1523/JNEUROSCI.3501-09.2009. [DOI] [PMC free article] [PubMed] [Google Scholar]
- Rademacher J, Morosan P, Schormann T, Schleicher A, Werner C, Freund HJ, Zilles K. Probabilistic mapping and volume measurement of human primary auditory cortex. Neuroimage. 2001;13:669–683. doi: 10.1006/nimg.2000.0714. [DOI] [PubMed] [Google Scholar]
- Reber PJ, Stark CE, Squire LR. Cortical areas supporting category learning identified using functional MRI. Proc Natl Acad Sci U S A. 1998;95:747–750. doi: 10.1073/pnas.95.2.747. [DOI] [PMC free article] [PubMed] [Google Scholar]
- Redcay E. The superior temporal sulcus performs a common function for social and speech perception: implications for the emergence of autism. Neurosci Biobehav Rev. 2008;32:123–142. doi: 10.1016/j.neubiorev.2007.06.004. [DOI] [PubMed] [Google Scholar]
- Rosa MJ, Bestmann S, Harrison L, Penny W. Bayesian model selection maps for group studies. Neuroimage. 2010;49:217–224. doi: 10.1016/j.neuroimage.2009.08.051. [DOI] [PMC free article] [PubMed] [Google Scholar]
- Ross LA, Saint-Amour D, Leavitt VM, Molholm S, Javitt DC, Foxe JJ. Impaired multisensory processing in schizophrenia: deficits in the visual enhancement of speech comprehension under noisy environmental conditions. Schizophr Res. 2007;97:173–183. doi: 10.1016/j.schres.2007.08.008. [DOI] [PubMed] [Google Scholar]
- Rumsey JM, Andreason P, Zametkin AJ, Aquino T, King AC, Hamburger SD, Pikus A, Rapoport JL, Cohen RM. Failure to activate the left temporoparietal cortex in dyslexia. An oxygen 15 positron emission tomographic study. Arch Neurol. 1992;49:527–534. doi: 10.1001/archneur.1992.00530290115020. [DOI] [PubMed] [Google Scholar]
- Schiltz C, Bodart JM, Dubois S, Dejardin S, Michel C, Roucoux A, Crommelinck M, Orban GA. Neuronal mechanisms of perceptual learning: changes in human brain activity with training in orientation discrimination. Neuroimage. 1999;9:46–62. doi: 10.1006/nimg.1998.0394. [DOI] [PubMed] [Google Scholar]
- Schmahmann JD, Doyon J, McDonald D, Holmes C, Lavoie K, Hurwitz AS, Kabani N, Toga A, Evans A, Petrides M. Three-dimensional MRI atlas of the human cerebellum in proportional stereotaxic space. Neuroimage. 1999;10:233–260. doi: 10.1006/nimg.1999.0459. [DOI] [PubMed] [Google Scholar]
- Shams L, Kamitani Y, Shimojo S. Visual illusion induced by sound. Brain Res Cogn Brain Res. 2002;14:147–152. doi: 10.1016/s0926-6410(02)00069-1. [DOI] [PubMed] [Google Scholar]
- Shaywitz BA, Shaywitz SE, Pugh KR, Mencl WE, Fulbright RK, Skudlarski P, Constable RT, Marchione KE, Fletcher JM, Lyon GR, Gore JC. Disruption of posterior brain systems for reading in children with developmental dyslexia. Biol Psychiatry. 2002;52:101–110. doi: 10.1016/s0006-3223(02)01365-3. [DOI] [PubMed] [Google Scholar]
- Slutsky DA, Recanzone GH. Temporal and spatial dependency of the ventriloquism effect. Neuroreport. 2001;12:7–10. doi: 10.1097/00001756-200101220-00009. [DOI] [PubMed] [Google Scholar]
- Stein BE, Meredith MA. The merging of the senses. Cambridge, MA: MIT; 1993. [Google Scholar]
- Stephan KE, Penny WD, Daunizeau J, Moran RJ, Friston KJ. Bayesian model selection for group studies. Neuroimage. 2009;46:1004–1017. doi: 10.1016/j.neuroimage.2009.03.025. [DOI] [PMC free article] [PubMed] [Google Scholar]
- Stephan KE, Penny WD, Moran RJ, den Ouden HE, Daunizeau J, Friston KJ. Ten simple rules for dynamic causal modeling. Neuroimage. 2010;49:3099–3109. doi: 10.1016/j.neuroimage.2009.11.015. [DOI] [PMC free article] [PubMed] [Google Scholar]
- Stevenson RA, Altieri NA, Kim S, Pisoni DB, James TW. Neural processing of asynchronous audiovisual speech perception. Neuroimage. 2010;49:3308–3318. doi: 10.1016/j.neuroimage.2009.12.001. [DOI] [PMC free article] [PubMed] [Google Scholar]
- Stoodley CJ, Stein JF. The cerebellum and dyslexia. Cortex. 2011;47:101–116. doi: 10.1016/j.cortex.2009.10.005. [DOI] [PubMed] [Google Scholar]
- Stoodley CJ, Fawcett AJ, Nicolson RI, Stein JF. Impaired balancing ability in dyslexic children. Exp Brain Res. 2005;167:370–380. doi: 10.1007/s00221-005-0042-x. [DOI] [PubMed] [Google Scholar]
- Szycik GR, Münte TF, Dillo W, Mohammadi B, Samii A, Emrich HM, Dietrich DE. Audiovisual integration of speech is disturbed in schizophrenia: an fMRI study. Schizophr Res. 2009;110:111–118. doi: 10.1016/j.schres.2009.03.003. [DOI] [PubMed] [Google Scholar]
- Teder-Sälejärvi WA, Di Russo F, McDonald JJ, Hillyard SA. Effects of spatial congruity on audio-visual multimodal integration. J Cogn Neurosci. 2005;17:1396–1409. doi: 10.1162/0898929054985383. [DOI] [PubMed] [Google Scholar]
- Tomasi D, Ernst T, Caparelli EC, Chang L. Practice-induced changes of brain function during visual attention: a parametric fMRI study at 4 Tesla. Neuroimage. 2004;23:1414–1421. doi: 10.1016/j.neuroimage.2004.07.065. [DOI] [PubMed] [Google Scholar]
- Tzourio-Mazoyer N, Landeau B, Papathanassiou D, Crivello F, Etard O, Delcroix N, Mazoyer B, Joliot M. Automated anatomical labeling of activations in SPM using a macroscopic anatomical parcellation of the MNI MRI single-subject brain. Neuroimage. 2002;15:273–289. doi: 10.1006/nimg.2001.0978. [DOI] [PubMed] [Google Scholar]
- von Kriegstein K, Giraud AL. Implicit multisensory associations influence voice recognition. PLoS Biol. 2006;4:e326. doi: 10.1371/journal.pbio.0040326. [DOI] [PMC free article] [PubMed] [Google Scholar]
- Watkins S, Shams L, Josephs O, Rees G. Activity in human V1 follows multisensory perception. Neuroimage. 2007;37:572–578. doi: 10.1016/j.neuroimage.2007.05.027. [DOI] [PubMed] [Google Scholar]
- Wiersinga-Post E, Tomaskovic S, Slabu L, Renken R, de Smit F, Duifhuis H. Decreased BOLD responses in audiovisual processing. Neuroreport. 2010;21:1146–1151. doi: 10.1097/WNR.0b013e328340cc47. [DOI] [PubMed] [Google Scholar]
- Zilbovicius M, Meresse I, Chabane N, Brunelle F, Samson Y, Boddaert N. Autism, the superior temporal sulcus and social perception. Trends Neurosci. 2006;29:359–366. doi: 10.1016/j.tins.2006.06.004. [DOI] [PubMed] [Google Scholar]