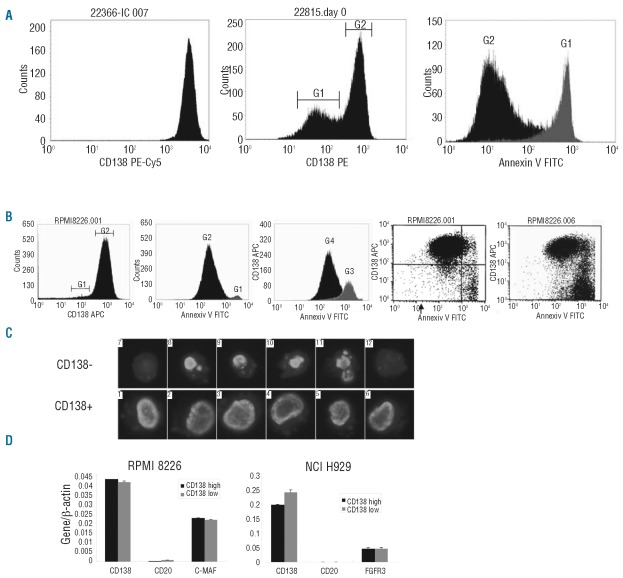
Figure 2.
Characterizing CD138− MM cells. (A) Left: a fresh BM sample. Middle: a BM sample analyzed 3 h after sample taking. G1 defines a population of cells with a decreased CD138 expression. G2 defines CD138+ cells. Right: Annexin V histogram of the same BM sample shown in the middle histogram. G1 is defined in middle histogram and includes Annexin V positive cells. G2 is defined in middle histogram and includes Annexin V negative cells. (B) Left histogram, optimal growing RPMI 8226. G1 includes possible CD138− cells. G2 includes CD138+ cells. Middle histogram: Annexin V histogram of the same RPMI 8226 sample shown in left histogram. G1 is defined in left histogram and includes Annexin V positive cells. G2 is defined in left histogram and includes Annexin V negative cells. Right histogram: RPMI 8226 treated with 10-5 M dexamethasone for 3 h. G3 defines Annexin V positive cells and G4 defines Annexin V negative cells. Left dot-plot: Annexin V versus CD138 expression of optimal growing RPMI8226. Right dot-plot of RPMI cells after 72 h of dexamethasone. (C) LSC images of DAPI stained CD138− and CD138+ MM cells. (D) Q-RT-PCR for FACS-sorted CD138 subsets. A MM specific oncogene expressed by the HMCL was used as a control gene.

