Abstract
Background
Stored vascular tissues are employed in biomedical research for studies in imaging, in biomechanics, and/or assessing vessel diseases. In the present study, The stability of aortic tissue in phosphate buffer saline (PBS) at 4°C was monitored over a course of 10 days as determined by the rate of glucose permeation measured by Optical Coherence Tomography (OCT) and validated by histology.
Methods and Results
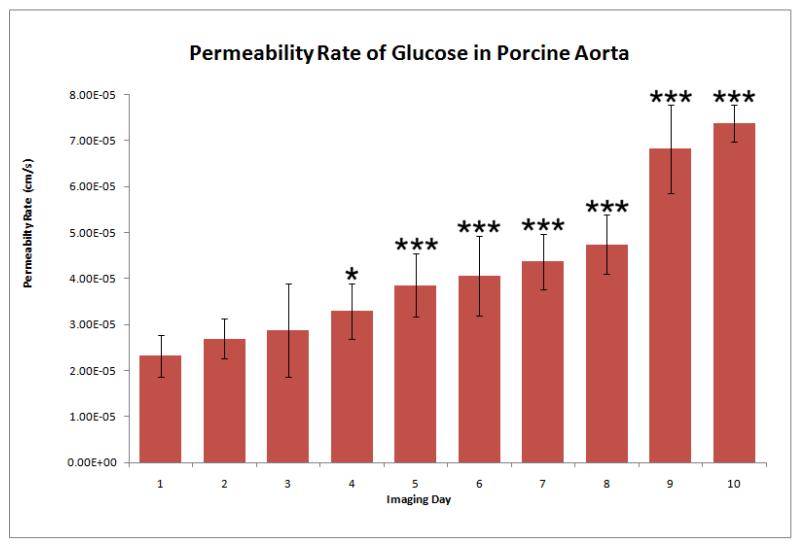
The initial mean permeability through fresh porcine aorta was (2.32 ± 0.46) × 10−5 cm/s (n = 5); after maintaining the tissue at 4°C for 10 days, the mean rate was (7.37 ± 0.41) × 10−5 cm/s (n = 4), an increase of nearly 300%. A z-test verified that a significant change in the permeability rate (p<0.05) had occurred after 4 days of 4 °C storage. Histology was used to quantify changes in tissue pore area. The increase in average pore area paralleled the increase in permeability rate over 10 days.
Conclusions
These results suggest that (1) the structural integrity of aortic tissue at 4°C is retained for at least the first three days after resection, and (2) OCT is a powerful technology well suited for evaluating tissue structural integrity over time.
General Significance
Functional OCT imaging provides for a noninvasive and quantitative technique in determining the structural integrity of aortic tissue stored at 4°C. This modality may be used for assessing the efficacy of other preservation techniques.
Keywords: permeability rate, hypothermal preservation, cold tissue storage, porcine aorta, pore size
1. Introduction
Stored vascular tissues are employed in biomedical research for studies in imaging, in biomechanics, and/or assessing vessel diseases. Improper preservation of vascular tissues can lead to significant experimental errors due to impaired nitric oxide production, vasospasm, increased thrombogenicity, and other dysfunctions [1,2]. Previous studies have investigated the effect on vascular tissue of preservation techniques, such as cold storage in preservation solution[3], cryogenic storage [4], fixation [5], and protease inhibition [6]. Each of these techniques maintains the stability of tissues for a certain amount of time. For instance, cold storage at 4°C is considered effective for a few days, whereas cryogenic storage can be used for several months to years. The general underlying principal for hypothermal storage is that the lower the sample temperature, the greater the sample stability. Fixation and protease inhibition are effective at reducing the biological effect of tissue degradation.
Changes in contraction and relaxation responses of aortic segments using force displacement transducers have been used to determine the effects of certain fixation solutions during cold storage [4]. Previous investigators have noted that deterioration of vascular function becomes more extensive after 72 hours of cold storage [7]. Apoptosis of endothelial cells in vascular tissue has been observed to become more prominent with increasing exposure to cold storage [8]. Although cold storage can be an effective means of preserving vascular tissue, prolonged exposure can still lead to significant morphological changes over time.
The use of microscopic techniques for determining the effect of cold storage on preserved tissue is limited by their depth of sample penetration and lack of dynamic applications. Microscopic techniques can provide a qualitative method for evaluating the effects of cold storage, but little, if any, means for obtaining a quantitative assessment. An imaging modality that can noninvasively and quantitatively evaluate the structural and/or functional integrity of tissues could be useful for evaluating different preservation techniques.
Optical coherence tomography (OCT) is an optical imaging technique that has the potential to enable noninvasive imaging, and to determine the rate at which molecules and particles of wide-ranging sizes pass through the tissue [9,10,11,12,13,14]. OCT captures the backscattered photons from a sample of interest within a coherence length of the source, using a two-beam interferometer. Compared to other popular 3D imaging techniques such as ultrasound, x-ray, and MRI, OCT can provide similar resolution and contrast using a safe and more economical methodology without requiring dyes or contrast agents. A major drawback, however, is the limited penetration depth when dealing with highly scattering media such as skin or vessel wall. We have previously demonstrated the capability of OCT for noninvasive and nondestructive measurement of the permeation rates of different drugs and particles through various biological tissues [9,10,11,12,13,14]. Measuring the permeability rate can be an effective means of quantitatively assessing morphologic changes within the tissue over the preservation time period, since the permeability of tissues can be readily correlated to their structural features.
In this study, we have monitored the structural integrity of porcine aorta at 4°C over a 10 day period by assessing time-dependent parameters of molecular diffusion. OCT was used to measure the rate of glucose permeation through the tissue. Proteolytic release of peptides into the storage buffer was monitored using the BSA assay. Histology was used to determine the extent of morphologic change in the tissues during storage. Functional change in the tissue as reflected in permeability rate could be correlated to structural changes reflected in tissue morphology.
2. Materials and Methods
2.1. Imaging System
An integrated Time Domain-OCT system (IMALUX, Cleveland, Ohio) was used to image the permeation of glucose solution through porcine aortic tissue samples. The system utilized a near-infrared low-coherence broadband light source (Superlum, Russia) with a wavelength of 1310 ± 15 nm, output power of 3 mW, and a resolution of 25 μm (in air). A two-dimensional (2D) (2.2 ×2.4 mm) image was obtained every four seconds by laterally scanning the sample surface with the incident beam, and in-depth with the interferometer.
2.2. Preparation and Imaging of Tissue Samples
Experiments were performed with fresh porcine aorta (J & J Packing, Brookshire, Texas), a tissue closely resembling its human counterpart [15]. The porcine aorta was cut longitudinally, exposing the intimal layer. A 6 mm diameter biopsy punch (Miltex, Germany) was used to cut tissue disks that were transferred to microtiter plates (Becton-Dickinson, Franklin Lakes, New Jersey). The tissue samples were kept hydrated with phosphate buffer saline (PBS) throughout the preparation process. Individual weights were obtained for each sample and recorded as their initial weights. Tissue samples were stored in plates at ~4°C until permeability experiments were initiated, within 2-3 hours.
Each disk was used for a single perfusion experiment. Before they were imaged, the tissue samples were removed from cold storage and individually weighed. Tissues were then placed in an insulated environment maintained at ~37°C, and allowed to thermally equilibrate for ~1 hour. Imaging on the first day of the study was performed on fresh samples upon arrival that had not yet been placed in cold storage. Tissues were imaged in 100 μl of PBS for ~5 min to obtain a baseline in every experiment. A 100 μl solution of 40% m/v glucose in PBS (by mass) maintained at 37°C was added, and its permeation monitored for 40 min. Glucose was used as the diffusing agent due to its biological compatibility, measurable and established permeability rate, and ease of use. Control experiments were performed by adding 100 μl of PBS instead of glucose, after obtaining baseline data. Temperature of the microtiter plate was maintained at 37°C throughout the imaging period with a heating block.
2.3. Analysis
The permeability rate of glucose in the porcine aortic tissue was calculated using the OCT signal slope (OCTSS) method with a custom C++ program explained in details previously [11,12]. The average permeability rate of a specific region in a tissue was computed by analyzing the slope changes in the OCTSS due to glucose permeation. The underlying biophysical mechanism is also introduced in our previous work [11,12]. The permeation of molecular solutions will alter the refractive index of the monitored region within the tissue; thus changing its optical properties.
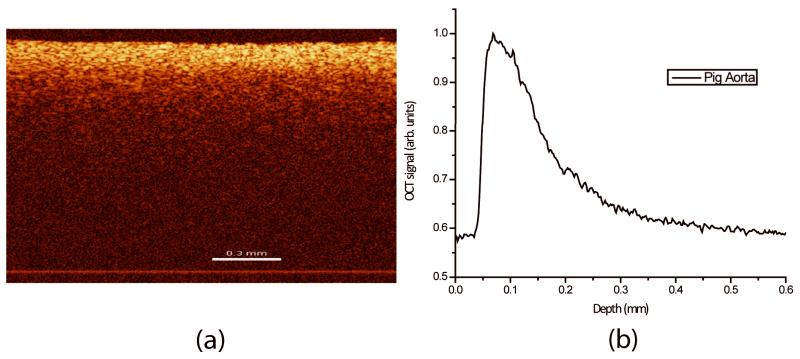
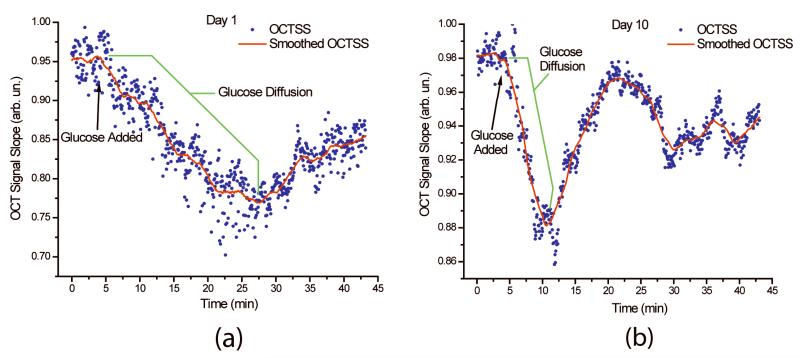
These changes are captured by OCT and reflected in the described OCTSS graphs. A straight and homogenous region (~ 1 mm in lateral direction) was averaged to produce a series of one-dimensional (1D) curves displaying in-depth light attenuation in logarithmic scale. Figure 1a depicts a typical two-dimensional (2D) image obtained using the OCT system. Figure 1b shows the resulting 1D curve obtained by averaging the 2D image laterally to display the distribution of light-in-depth. An OCTSS was obtained by analyzing the slope changes in the OCT signal at a selected region of the tissue depth. The time of permeation was estimated from the instant OCTSS started decreasing until the point where a reverse process began to occur (See Figure 2 for an illustrative example). The permeability rate was obtained by dividing the thickness of the selected in-depth region by the time it took for the permeating species to diffuse. For each day, 4-5 tissue discs were analyzed.
Figure 1.
(a) 2D OCT image of a porcine aorta (b) and its resulting 1D curve displaying in-depth light attenuation. Bar represents 0.3 mm.
Figure 2.
The permeation of glucose monitored by OCT signal slope analysis for (a) day 1 and (b) day 10 of the study. The permeability rate of glucose was calculated to be 2.38 × 10⁻⁵ (cm/s) for day 1 and 7.59 × 10⁻⁵for day 10.
2.4. Protein Concentration
Before each experiment was started a 100 μl sample of the tissue bathing solution was removed from the microtiter plate well and frozen at −20°C. The protein concentration was measured on a 50:1 dilution using the BCA protein assay (Pierce, Rockford, Illinois). The samples and controls were measured in triplicate on a 96-well microtitre plate (MaxiSorp Nunc-Immuno by NUNC, Denmark) using a volume of 4 μl buffer, to which was added 32 μl of the components of the BCA assay kit. The 96-well plate was gently agitated for 30 min on a shaker (American Rotator V R4140, American Dade, Miami, FL). The plate was read at 562 nm (μQuant Universal Microplate Spectrophotometer, Bio-Tek Instruments, Winooski, VT) using the KCJunior software. The protein values obtained were normalized to the corresponding tissue’s initial wet weight. Three different aliquots were measured each day.
2.5. Histology
After tissue imaging was complete, the tissue samples were individually suspended in Optimal Cutting Temperature compound with the intima mounted upward (Tissue-Tek, Sakura, The Netherlands) then placed on dry ice and allowed to freeze. After freezing, the tissues were then cut laterally in 10 μm sections, mounted on microscope slides, and stained for hematoxylin and eosin (H&E). The ratio of pore area to the entire tissue area was then calculated using the Analyze Particles function of ImageJ software (NIH). In order to use this function, color images were converted to 8-bit black and white. A background was subtracted from all images, and the threshold was set to 45/115, so that all tissue samples were represented as white and the pores as black. Each image was segmented into three equally sized samples. Six tissue discs were studied for each day.
3. Results
3.1. Permeability Studies
A representative OCTSS graphs from fresh tissue (Figure 2a) and tissue after 10 days of storage in PBS at 4°C (Figure 2b). The scatter plot depicts the values of the slopes of the monitored region over time for selected images, and the trend line represents a 50-point line smoothing. The permeability rate of glucose obtained from these OCT signal slopes was calculated to be 2.38 × 10⁻⁵ cm/s for day 1 and 7.59 × 10⁻⁵ cm/s for day 10.
The permeability rate of glucose in porcine aorta followed an increasing trend over the 10 day period, as shown in Figure 3. Relative to the permeability rate obtained on day 1, when fresh porcine aorta was used, a significant change in the permeability rate was observed upon day 4 of the study. The permeability rate calculated from day 4 images was statistically different from day 1 data, rejecting the null hypothesis (p-value of 0.0164 with a significance value of <0.05). During the following days (5-10) significance values of <0.001 were obtained.
Figure 3.
Permeability rate of 20% glucose in PBS (by mass) in porcine aorta preserved at 4°C for a ten-day period. Permeability rate was measured using the OCT system and the OCTSS method outlined in Methods. The trend portrays a gradual increase in the permeability rate which can be correlated to the morphological changes occurring within the tissue over the preservation period. One star indicates that the data point rejects the null hypothesis (p<0.05), whereas three stars indicate that the data point rejects the null hypothesis with a significance value p<0.001, with respect to the mean value for Day 1. Statistics were obtained from 4 - 5 experiments (tissue discs) for each day.
3.2. Protein Concentration
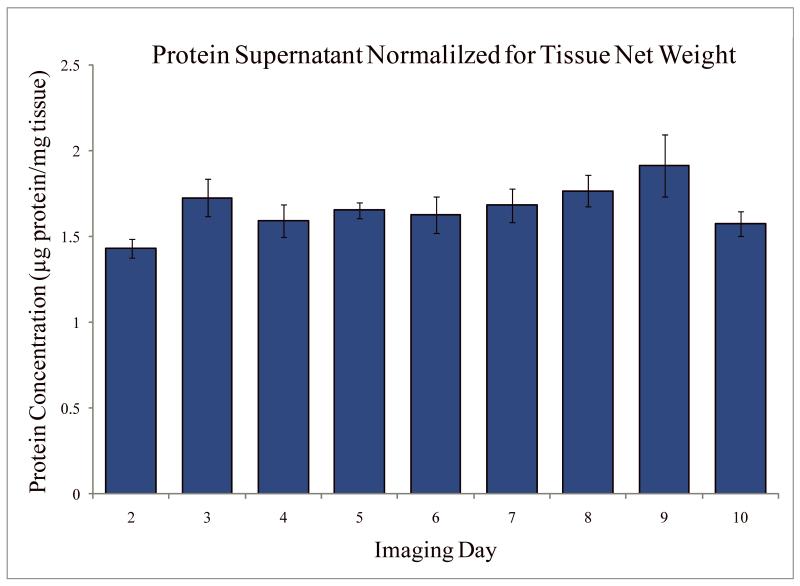
On each day of the 10 day experiment, an aliquot of buffer was withdrawn from each tissue well and protein concentration was measured. The concentration value presented in Figure 4 was obtained in μg/ml and was normalized by the initial wet weight of the tissue. The concentration of protein in the tissue buffer did not vary significantly over the 10 days.
Figure 4.
Protein concentration in tissue storage buffer resulting from time of tissue storage at 4°C. Statistics were obtained from measuring 3 different aliquots each day.
3.3. Histology
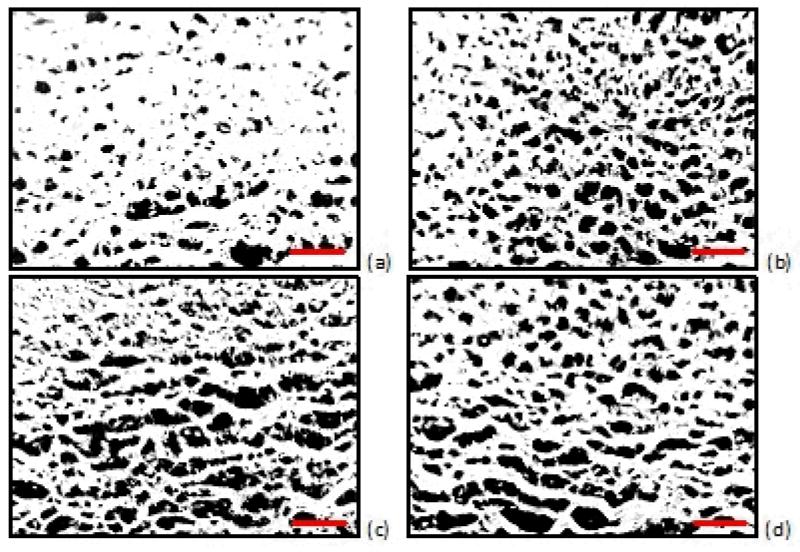
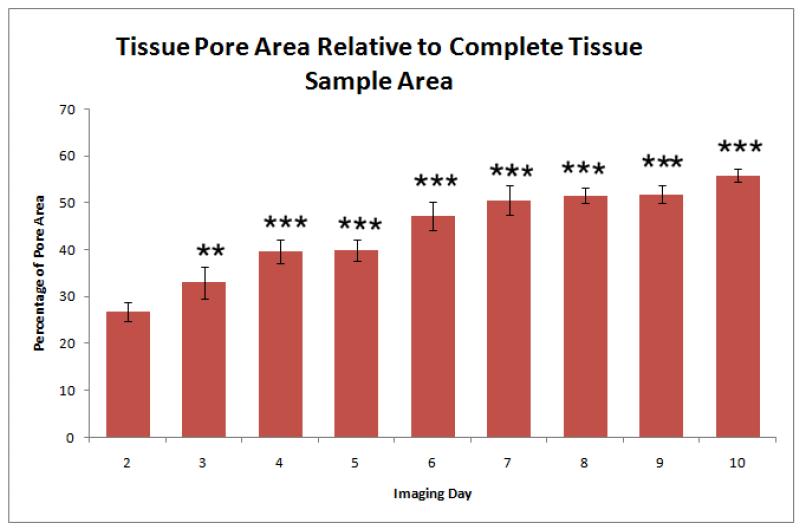
Histological analysis performed on the tissues used in the permeability studies revealed a gradual change in the morphology of the tissue over the 10 day experiment. The images obtained after 3 days of 4°C storage revealed a change of the tissue structure and an increase in the observed pore sizes. Representative histological images are shown in Figure 5. To quantify these morphologic changes, the pore areas of selected images were calculated. The ratio of the pore area to the area of the sectioned samples of the tissue is presented in Figure 6.
Figure 5.
Histology images of porcine aorta (which has been cut longitudinally and laid flat to facilitate harvesting tissue discs). The photographs represent predominantly medial layer for (a) day 3, (b) day 5, (c) day 7, and (d) day 9 of tissue maintained at 4°C. Sections (10 μm) were stained with hematoxylin and eosin (H&E). Histology images were converted to 8-bit grayscale images and the threshold was decreased so that the image background (pores) was rendered black. The ratio of pore area to total area tissue was calculated by averaging the pore area (shown in black) of three sections within each image (10x). Scale bars: 100μm.
Figure 6.
Pore area of porcine tissues maintained for 10 days at 4°C. Percentages were calculated relative to complete tissue sample areas within corresponding histology images. Two stars indicate that the data point rejects the null hypothesis (p<0.01), whereas three stars indicate that the data point rejects the null hypothesis (p<0.001), with respect to the mean value for Day 1. Statistics were obtained from 6 tissue discs for each day.
4. Discussion
The permeability rate of glucose in porcine aorta maintained at 4°C increased significantly on day 4 as compared to day 1 (Figure 3). This increase in permeability rate could be correlated to morphological changes that occur within the tissue. Hypothermal temperatures tend to reduce the rate of tissue degradation. Nevertheless, even tissues held just above freezing will undergo a decay process, including but not limited to the disintegration of the epithelial layer [16], collagen dissociation [17], and loss of protein [18]. Each of these physiological changes generally causes the tissue to become less dense, allowing a species to permeate more rapidly through the tissue. The morphological changes within the tested aortic samples were enough to cause a 300% increase in the permeability rate of glucose over a 10 day period.
As shown in Figure 3, the change in statistical significance of the permeability rate shows that storage at 4°C can maintain the stability of porcine aorta for at least 3 days. By the fourth day of storage, the permeability rate changed by a significant amount (p<0.05), which could be related to a substantial change in the morphology of the porcine aorta. Hence, permeability studies using vascular tissues stored for more than 4 days at 4°C in PBS, could lead to invalid experimental results.
Histology performed on the tissues used in our permeability experiments revealed an increase in tissue pore size. Initially, the change in pore size could be attributed to swelling of the tissue as it absorbs water. This possibility was tested by comparing the weight of fresh tissues to tissues that had been stored in PBS for more than 24 hrs. For all tissues, the weight after storage and before imaging was greater than the initial weight before storage. Previous studies suggest that hypothermia-induced cellular swelling is caused by inhibition of the Na+/K+ ATPase [19]. This inhibition, in turn, causes the intracellular accumulation of sodium followed by chloride influx, which, by osmosis, leads to cellular swelling. Preservation solutions such as Euro-Collins Buffer and University of Wisconsin Solution are designed to prevent cellular swelling by containing high concentrations of osmotically active substances which are impermeable to the cellular membrane [20]. However, our study utilized a physiological buffer (PBS), which contained calcium chloride and magnesium chloride, both of which can contribute to the influx of chloride into the cell. The resulting cellular swelling can rupture the cells, allowing the initially intracellular fluid to escape into the extracellular environment. As a result, pores within the tissue can form and increase in size as the preservation time is extended; this sequence of events could explain the changes in tissue pore size we observed.
The catabolism of extracellular proteins by a range of proteases could be another explanation for the noted increase in pore size. As the tissue structure degrades, proteins might be released into the tissue medium. In the present study however, measurement of the concentration of protein in the tissue supernatant did not reveal a significant increase over time. This could be due to retention of the proteolytic fragments within the tissue.
Along with morphology changes that could occur from swelling and protein degradation, cold storage could also cause other injurious processes on a cellular and molecular level. These processes such as hypoxia and a decline in ATP levels [21] are considered to be mechanisms whereby the hypothermal effects can be manifested. In addition, the adverse effects of re-warming tissue after hypothermal preservation are known to cause apoptotic events, such as cellular and nuclear shrinkage, chromatin condensation, and the formation of blebs and apoptotic bodies [22].
While previous studies have examined the mechanisms for hypothermal injury to biological samples on a structural, cellular, and molecular level, the extent to which a certain tissue can experience hypothermal preservation in physiological solution has not been rigorously described. Our study demonstrates that the effectiveness of low temperature in preserving tissue integrity can be determined by utilizing OCT to noninvasively monitor changes in permeability rate.
5. Conclusion
The change in permeation of glucose through porcine aorta as the tissue was maintained at 4°C for 10 days was quantified using an optical coherence tomography (OCT) imaging system. The permeability rate for tissue was measured to be (2.32 ± 0.46) × 10−5 cm/s; after maintaining the tissue at 4°C for 10 days, the rate was (7.37 ± 0.41) × 10−5 cm/s, an increase of nearly 300%. The increasing permeability rate was correlated to the morphological changes which occurred in the tissue during 4°C exposure. The permeability rates obtained exhibited a significant change by the fourth day of storage. These results suggest the usefulness of OCT in assessing the nativity of tissue structure and function under various conditions and over certain time frames.
Acknowledgement
This study was supported in part by grants from The Institute of Biomedical Imaging Sciences (IBIS-97708), NIH/NHLBI (T32-HL07812), CRDF (RUB1-2932-SR-08), and NSF (CMMI-0900743). The authors would like to thank Mrs. Iou Chen for her assistance in histology slide preparation.
References
- [1].Trivedi U, Forsyth A. Effects of storage solutions on in vitro vasoreactivity of radial artery conduits. Journal of Thoracic and Cardiovascular Surgery. 2002;124:1261–1261. doi: 10.1067/mtc.2002.128074. [DOI] [PubMed] [Google Scholar]
- [2].Dragun D, Hoff U, Park JK, Qun Y, Schneider W, Luft FC, Haller H. Prolonged cold preservation augments vascular injury independent of renal transplant immunogenicity and function. Kidney International. 2001;60:1173–1181. doi: 10.1046/j.1523-1755.2001.0600031173.x. [DOI] [PubMed] [Google Scholar]
- [3].Corner JA, Berwanger CS, Stansby G. Preservation of vascular tissue under hypothermic conditions. Journal of Surgical Research. 2003;113:21–25. doi: 10.1016/s0022-4804(03)00235-x. [DOI] [PubMed] [Google Scholar]
- [4].Karlsson JOM, Toner M. Long-term storage of tissues by cryopreservation: Critical issues. Biomaterials. 1996;17:243–256. doi: 10.1016/0142-9612(96)85562-1. [DOI] [PubMed] [Google Scholar]
- [5].Pirenne J, Van Gelder F, Coosemans W, Aerts R, Gunson B, Koshiba T, Fourneau I, Mirza D, Van Steenbergen W, Fevery J, Nevens F, McMaster P. Type of donor aortic preservation solution and not cold ischemia time is a major determinant of biliary strictures after liver transplantation. Liver Transplantation. 2001;7:540–545. doi: 10.1053/jlts.2001.24641. [DOI] [PubMed] [Google Scholar]
- [6].Smejkal GB. Providing ‘freeze frames’ of cellular processes by thermal stabilization of samples: The inactivation of proteases, preservation of molecular complexes, and elimination of apocryphal spots on two-dimensional gels; AIChE Annual Meeting; 2009. [Google Scholar]
- [7].Berwanger CS, Cleanthis TM, Hafez HM, Fuller BJ, Mansfield AO, Stansby G. Deuterium oxide-based University of Wisconsin solution improves viability of hypothermically stored vascular tissue. Transplantation. 1998;65:735–737. doi: 10.1097/00007890-199803150-00022. [DOI] [PubMed] [Google Scholar]
- [8].Rauen U, Polzar B, Stephan H, Mannherz HG, de Groot H. Cold-induced apoptosis in cultured hepatocytes and liver endothelial cells: mediation by reactive oxygen species. Faseb Journal. 1999;13:155–168. doi: 10.1096/fasebj.13.1.155. [DOI] [PubMed] [Google Scholar]
- [9].Ghosn MG, Carbajal EF, Befrui NA, Tellez A, Granada JF, Larin KV. Permeability of hyperosmotic agent in normal and atherosclerotic vascular tissues. Journal of Biomedical Optics. 2008;13 doi: 10.1117/1.2870153. [DOI] [PubMed] [Google Scholar]
- [10].Ghosn MG, Carbajal EF, Befrui NA, Tuchin VV, Larin KV. Differential permeability rate and percent clearing of glucose in different regions in rabbit sclera. Journal of Biomedical Optics. 2008;13 doi: 10.1117/1.2907699. [DOI] [PubMed] [Google Scholar]
- [11].Ghosn MG, Tuchin VV, Larin KV. Nondestructive quantification of analyte diffusion in cornea and sclera using optical coherence tomography. Investigative Ophthalmology & Visual Science. 2007;48:2726–2733. doi: 10.1167/iovs.06-1331. [DOI] [PubMed] [Google Scholar]
- [12].Ghosn MG, Tuchin VV, Larin KV. Depth-resolved monitoring of glucose diffusion in tissues by using optical coherence tomography. Optics Letters. 2006;31:2314–2316. doi: 10.1364/ol.31.002314. [DOI] [PubMed] [Google Scholar]
- [13].Larin KV, Ghosn MG, Ivers SN, Tellez A, Granada JF. Quantification of glucose diffusion in arterial tissues by using optical coherence tomography. Laser Physics Letters. 2007;4:312–317. [Google Scholar]
- [14].Larin KV, Ghosn MG. Influence of experimental conditions on drug diffusion in cornea. Quantum Electron. 2006;36:1083–1088. [Google Scholar]
- [15].Mehran RJ, Ricci MA, Graham AM, Carter K, Symes JF. Porcine model for vascular graft studies. J Invest Surg. 1991;4:37–44. doi: 10.3109/08941939109140760. [DOI] [PubMed] [Google Scholar]
- [16].Lee CY, MatsumotoPon J, Widdicombe JH. Cultured lung epithelium: A cellular model for lung preservation. Cryobiology. 1997;35:209–218. doi: 10.1006/cryo.1997.2042. [DOI] [PubMed] [Google Scholar]
- [17].Quintana AB, Rodriguez JV, Scandizzi AL, Guibert EE. The benefit of adding sodium nitroprusside (NPNa) or S-nitrosoglutathion (GSNO) to the University of Wisconsin solution (UW) to prevent morphological alterations during cold preservation/reperfusion of rat livers. Ann Hepatol. 2003;2:84–91. [PubMed] [Google Scholar]
- [18].Weist S, Brunkau C, Wittke J, Eravci M, Broedel O, Krause E, Stephanowitz H, Eravci S, Baumgartner A. Effects of thawing, refreezing and storage conditions of tissue samples and protein extracts on 2-DE spot intensity. Proteomics. 2010;10:1515–1521. doi: 10.1002/pmic.200900471. [DOI] [PubMed] [Google Scholar]
- [19].Hochachka PW. Defense Strategies against Hypoxia and Hypothermia. Science. 1986;231:234–241. doi: 10.1126/science.2417316. [DOI] [PubMed] [Google Scholar]
- [20].Belzer FO, Southard JH. Principles of Solid-Organ Preservation by Cold-Storage. Transplantation. 1988;45:673–676. doi: 10.1097/00007890-198804000-00001. [DOI] [PubMed] [Google Scholar]
- [21].Zatschler B, Dieterich P, Muller B, Kasper M, Rauen U, Deussen A. Improved vessel preservation after 4 days of cold storage: Experimental study in rat arteries. Journal of Vascular Surgery. 2009;50:397–406. doi: 10.1016/j.jvs.2009.04.064. [DOI] [PubMed] [Google Scholar]
- [22].Rauen U, de Groot H. New insights into the cellular and molecular mechanisms of cold storage injury. Journal of Investigative Medicine. 2004;52:299–309. doi: 10.1136/jim-52-05-29. [DOI] [PubMed] [Google Scholar]


