Abstract
Malignant progression in cancer requires populations of tumor-initiating cells (TICs) endowed with unlimited self renewal, survival under stress, and establishment of distant metastases. Additionally, the acquisition of invasive properties driven by epithelial-mesenchymal transition (EMT) is critical for the evolution of neoplastic cells into fully metastatic populations. Here, we characterize 2 human cellular models derived from prostate and bladder cancer cell lines to better understand the relationship between TIC and EMT programs in local invasiveness and distant metastasis. The model tumor subpopulations that expressed a strong epithelial gene program were enriched in highly metastatic TICs, while a second subpopulation with stable mesenchymal traits was impoverished in TICs. Constitutive overexpression of the transcription factor Snai1 in the epithelial/TIC-enriched populations engaged a mesenchymal gene program and suppressed their self renewal and metastatic phenotypes. Conversely, knockdown of EMT factors in the mesenchymal-like prostate cancer cell subpopulation caused a gain in epithelial features and properties of TICs. Both tumor cell subpopulations cooperated so that the nonmetastatic mesenchymal-like prostate cancer subpopulation enhanced the in vitro invasiveness of the metastatic epithelial subpopulation and, in vivo, promoted the escape of the latter from primary implantation sites and accelerated their metastatic colonization. Our models provide new insights into how dynamic interactions among epithelial, self-renewal, and mesenchymal gene programs determine the plasticity of epithelial TICs.
Introduction
There is a wealth of evidence that the acquisition of aggressive traits of cancer, or malignant progression, can be determined both by the occurrence of genetic mutations and by the imposition of heritable epigenetic marks on relevant genes (1). Within a tumor, these newly acquired genetic and epigenetic events can emerge either sequentially within a single lineage or in parallel in multiple, independent lineages (2). In either scenario of cancer cell evolution, the final outcome is the coexistence in a given tumor of different subpopulations of tumor cells, each endowed with particular phenotypes (intratumoral heterogeneity). There is also evidence that transcriptional reprogramming in tumor cells can be induced in response to nontumor environmental cues that include factors such as TGF-β, PDGF, or EGF (3), hormones, or hypoxic stress (4). Therefore, cancer cells endowed with a capacity for indefinite self renewal (cancer stem cells [CSCs]), but still retaining some capacity for differentiation, could evolve into distinct phenotypes in response to environmental cues and to new mutations. It has been proposed that, as in any ecological niche (5), these subpopulations could interact among each other, either by competing for common resources (6) or by cooperating for mutual benefit (2, 7). These tumoral subpopulations can also interact with, and use to their advantage, nontumoral elements, as has been convincingly shown in many models of tumor progression and metastasis (8).
Tumor-initiating cells (TICs) constitute subpopulations of cells capable of initiating and sustaining the growth of tumors in immunodeficient mice (9–11). In turn, TICs and CSCs share with ES and adult stem cells gene networks that are essential for self renewal and pluripotency (12, 13). Independent of their origin, it is still unclear whether CSCs are a population of tumor cells endowed with irreversible self-renewal properties or whether they are subject to dynamic influences that can affect their phenotypes (14, 15). A second process and gene program critical for cancer progression is epithelial-mesenchymal transition (EMT) (16–19). Whether induced by environmental cues or by other mechanisms, EMT is driven by transcriptional factors such as SNAI1/2, ZEB1/2, or TWIST1/2, results in enhanced migration and invasive potentials of epithelial cells, and is critical for the metastatic spread of epithelial tumors (16, 20, 21). In several models of cancer, the induction of EMT potentiates self renewal and the acquisition of CSC properties (22–24). Consequently, a common notion is that EMT may be a general feature of cancer stem or progenitor populations, associating local invasiveness with the ability to colonize distant organs as expressions of 2 tightly interdependent gene programs borne by the same tumor cells (15, 21). However, other models of neoplasia have found an inverse correlation between local invasiveness and the ability of tumor cells to colonize distant organs (25), suggesting a dichotomy between these 2 critical features of the metastatic process, possibly expressed by separate tumor cell subpopulations (26, 27) in which tumor cells that display a strong epithelial phenotype are endowed with the strongest capacity to survive in circulation and to establish distant metastases (14, 25, 28).
To better understand the relationship between CSC and EMT programs in local invasiveness and distant metastasis, we have characterized 2 cellular models, derived from prostate and bladder cancer cell lines, displaying a dissociation between these 2 programs. We have found that forced induction of constitutive EMT in subpopulations of tumor cells displaying relatively stable epithelial/TIC features caused the suppression of major properties associated with TICs, including anchorage-independent growth and metastatic potential. Conversely, knockdown in the TIC-enriched epithelial subpopulations of self-renewal genes and of E-cadherin led, in addition to an inhibition of anchorage-independent growth, to a loss of their epithelial features, enhanced invasiveness, and an inhibition of their capacity to colonize distant organs. These observations closely link properties of metastatic TICs to an epithelial phenotype and gene program and suggest that, in our models, EMT, while enabling the invasiveness of tumor cells, opposes the self-renewal gene program that drives their local and metastatic growth.
Results
Cellular models of metastasis in which TIC and EMT properties are dissociated.
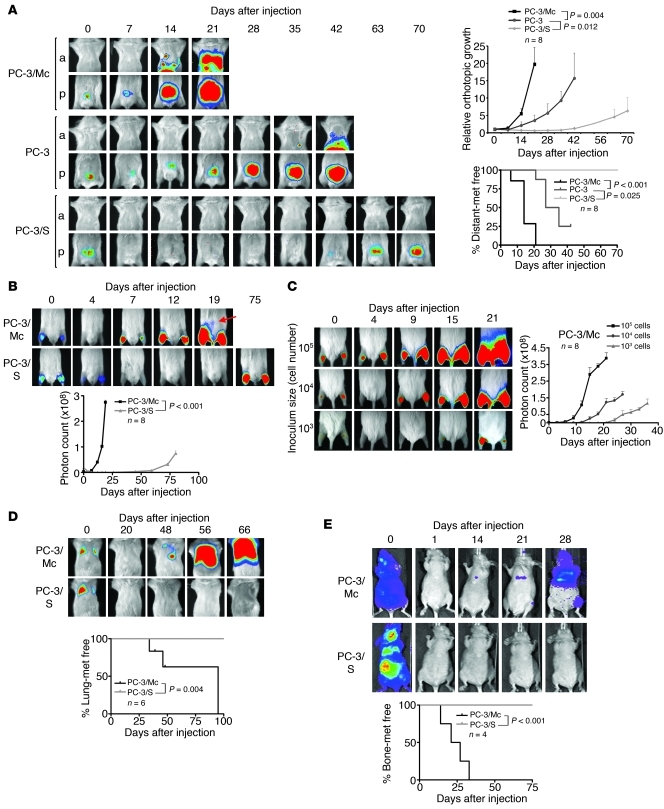
The PC-3 prostate cancer cell line was used to generate 2 distinct clonal populations. PC-3/S cells were isolated in vitro by single-cell cloning from luciferase-expressing PC-3 cells (29). A second single-cell progeny, hereafter designated PC-3/Mc, was isolated from luciferase-expressing PC-3/M cells, a PC-3 subline that had been selected in vivo for its high metastatic potential (30). Orthotopic implantation in the ventral prostate lobe of NOD-SCID mice of 1.0 × 10⁵ PC-3/Mc cells quickly produced large tumors, spreading to regional lymph nodes shortly after implantation and to distant organs at later times (Figure 1A). In contrast, PC-3/S cells grew slowly and were not detected outside of the implantation site for the duration of monitoring (70 days). Parental PC-3 cells displayed an intermediate behavior in local growth rate and in the dissemination to regional lymph nodes and distant sites (Figure 1A). Intramuscular (i.m.) grafting corroborated the remarkable differences in tumorigenicity between these 2 cell subpopulations (Figure 1B). Grafting of limited numbers of PC-3/Mc cells yielded robust tumor growth (Figure 1C), and they could be serially transplanted in immunodeficient mice, maintaining or gaining their efficiency for local growth upon successive transplantations (Supplemental Figure 1A; supplemental material available online with this article; doi: 10.1172/JCI59218DS1). They also readily colonized lungs and bones after i.v. (Figure 1D) or intracardiac (i.c.) (Figure 1E and Supplemental Figure 1B) injection, suggesting enrichment in metastasis-prone TICs. In contrast, PC-3/S cells did not grow detectable colonies in lungs or bones after i.v. or i.c. injection at any time during monitoring (Figure 1, D and E). Therefore, the PC-3/Mc and PC-3/S subpopulations of PC-3 prostate cancer cells display highly contrasting phenotypes, with PC-3/Mc cells enriched in serially transplantable TICs with high metastatic potential.
Figure 1. Divergent growth and metastatic potentials of 2 clonal populations derived from PC-3 prostate cancer cells.
(A) PC-3/Mc, but not PC-3/S, cells rapidly formed tumors upon orthotopic implantation in NOD-SCID mice, developing lymph node and distant metastases as early as 14 days after implantation. Parental PC-3 cells grew and metastasized with efficiencies intermediate between the 2 clonal populations. Cells (1.0 × 10⁵) were implanted in the ventral lobes of 6-week-old male mice. Anterior (a) or posterior (p) halves were imaged independently for enhanced resolution. Upper right panel: growth curves of orthotopic tumors, with photon counts normalized to values on day 0. Lower right panel: Kaplan-Meier plots for metastasis-free (met free) mice. (B) PC-3/Mc cells grew rapidly after i.m. grafting (2.0 × 10⁵ cells), with detection in lymph nodes after 19 days (arrow). PC-3/S cells formed tumors after 75 days, without detectable distant spread. Bottom panel: growth curves at the i.m. implantation sites. (C) Grafting of limited numbers of PC-3/Mc cells readily produced tumors. 105, 104, or 103 cells were injected i.m. in each hind limb. Right panel: growth curves at the i.m. implantation site. (D) PC-3/Mc, but not PC-3/S, cells readily colonized lungs upon i.v. injection (2.5 × 10⁵ cells). Bottom panel: Kaplan-Meier plots for lung colonization–free mice at each time point. (E) PC-3/Mc, but not PC-3/S, cells readily colonized bones upon i.c. injection (2.0 × 10⁵ cells). Bottom panel: Kaplan-Meier plots for bone metastasis–free mice. Results are expressed as mean ± SEM.
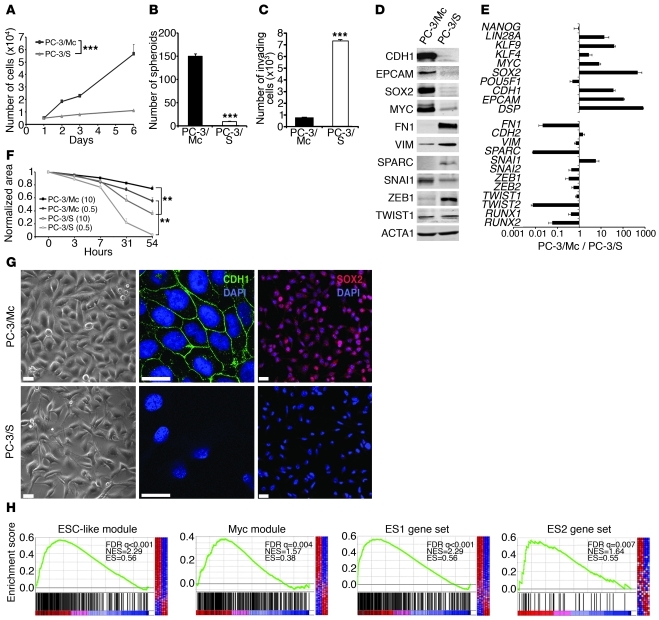
In vitro, PC-3/Mc cells grew much faster and had 1.5-fold more cells in the S phase of the cell cycle than PC-3/S cells (Figure 2A and Supplemental Figure 2A). Likewise, PC-3/Mc cells readily formed large spheroids under nonadherent growth conditions (Figure 2B and Supplemental Figure 2B) and maintained this capacity upon serial plating (Supplemental Figure 2C), whereas PC-3/S cells showed limited anchorage-independent growth (Figure 2B and Supplemental Figure 2B). Contrary to our expectations, PC-3/Mc cells were barely invasive in Matrigel-Boyden chamber assays, while PC-3/S cells were highly invasive and motile (Figure 2, C and F). Thus, the in vitro invasiveness and motility of PC-3/Mc and PC-3/S cells are inversely correlated to their in vitro spheroid-forming and proliferative potentials. This suggests a dichotomy in these cells between 2 processes that determine the capacity of tumor cells to metastasize, namely the capacities to grow serially transplantable tumors in vivo and spheroids in vitro and to invade through extracellular matrix in vitro.
Figure 2. Opposing phenotypes and distinct gene programs expressed by 2 clonal populations derived from PC-3 cells.
(A) PC-3/Mc cells grew with short doubling times (22–24 hours), while PC-3/S cells grew with long doubling times (60–72 hours). (B) PC-3/Mc, but not PC-3/S, cells displayed robust anchorage-independent growth. Cells (103) seeded in low-attachment plates in the presence of 0.5% methyl cellulose were scored for spheroids after 14 days (triplicate assays). (C) PC-3/Mc cells were barely invasive, while PC-3/S cells were highly invasive. Cells seeded on the upper chamber of Matrigel- and hyaluronic acid–coated Transwell units were scored for invading cells after 24 hours (triplicate assays). (D) PC-3/Mc cells expressed higher levels than PC-3/S cells of E-cadherin and EpCAM. PC-3/S cells expressed higher levels than PC-3/Mc cells of fibronectin, vimentin, and SPARC, by Western blotting. (E) PC-3/Mc cells expressed higher levels than PC-3/S cells of genes associated with self renewal and pluripotency. PC-3/S cells expressed higher levels than PC-3/Mc cells of genes associated with mesenchymal phenotypes and EMT. Relative transcript levels are represented as the log10 of ratios between the 2 cell lines of their 2–ΔΔCp real-time PCR values. (F) PC-3/S cells were more motile than PC-3/Mc cells in wound-healing assays (triplicate assays). Parentheses denote percentages of FBS. (G) PC-3/Mc cells were round and expressed membrane-associated E-cadherin and nuclear SOX2. PC-3/S cells were flat and spindled and with undetectable E-cadherin. Scale bar: 20 μm. (H) Gene-set enrichment analysis (GSEA) showing significant enrichment in PC-3/Mc cells of the ESC-like, MYC, ES1, and ES2 gene modules. FDR q, false discovery rate q value; NES, normalized enrichment score; ES, enrichment score. Results are expressed as mean ± SEM. **P < 0.01; ***P < 0.001.
Gene profiling revealed a striking divergence in transcriptional programs between these 2 subpopulations derived from a common parental cell line (Supplemental Table 1 and Supplemental Figure 3). PC-3/Mc cells expressed an epithelial gene program, including E-cadherin (CDH1), EpCAM (TACSTD1), and desmoplakin (DSP), and also genes associated with pluripotency and self renewal (31, 32), including KLF4, MYC, SOX2, KLF9, and LIN28A (Figure 2, D, E, G, and Supplemental Figure 3A). Gene set enrichment analysis revealed that PC-3/Mc cells have very active DNA repair, DNA replication, and mitotic transition and checkpoint gene networks (Supplemental Table 2 and Supplemental Figure 3, A and B). Importantly, PC-3/Mc cells were strongly enriched in an ES cell–like module (ESC-like module) shown to be highly active in epithelial cancers associated with metastasis and death (13), with 265 of the 335 genes of this module overrepresented in PC-3/Mc cells and also in a MYC gene module (33) and ES1 and ES2 gene sets (ref. 12, Figure 2H, and Supplemental Table 4). This supports the conclusion that PC-3/Mc cells, which have a high potential for anchorage-independent and metastatic growth but are poorly invasive in vitro, display both an epithelial phenotype and a very active self-renewal/pluripotency gene program. In contrast, PC-3/S cells expressed high levels of many mesenchymal markers (e.g., VIM, SPARC, and FN1) and genes linked to EMT, such as TWIST2, SNAI2, ZEB1, and RUNX2 (Figure 2, D and E, and Supplemental Figure 3, C and D). Of interest, PC-3/S cells expressed many genes for chemokines and inflammatory cytokines and their receptors at levels much higher than those of PC-3/Mc cells (Supplemental Tables 3 and 5 and Supplemental Figure 3, C and D), suggesting that this subpopulation has engaged a proinflammatory program similar to that induced in cells under stress or in presenescent states (34, 35). Intriguingly, PC-3/Mc cells expressed higher levels than PC-3/S cells of the EMT factor SNAI1. The endogenous SNAI1 protein showed a correct nuclear localization in PC-3/Mc cells, clearly visible when allowed to accumulate upon treatment with the GSK3 inhibitor LiCl or the proteasome inhibitor MG132 (Supplemental Figure 4A). However, knockdown of endogenous SNAI1 in PC-3/Mc cells did not significantly alter the levels of expression of E-cadherin or other epithelial markers, suggesting a defect in the function of endogenous SNAI1 in these cells (Supplemental Figure 4, B and C), possibly explaining why the expression of this factor in PC-3/Mc cells still allows the expression of high levels of E-cadherin and a strong epithelial phenotype.
Analysis of histone marks associated with relevant promoters supported the transcriptional basis for these divergent expression profiles (Supplemental Figure 5). Thus, the SOX2 and E-cadherin (CDH1) promoters were enriched in acetylated histone H4 in PC-3/Mc but not in PC-3/S and were more enriched in the H3K27me3 repressive mark in PC-3/S. Conversely, the promoters of the mesenchymal genes TWIST2 and RUNX2 were enriched in acetylated histones H3 and H4 only in PC-3/S cells and were impoverished in H3K27me3 in either cell type.
We next determined whether the epithelial-aggressive versus mesenchymal-nonaggressive dichotomy observed in our PC-3 prostate cancer cell line subpopulations applied to other models for which epithelial tumor cell subpopulations with distinct potentials for growth and metastasis had been characterized. We chose a cellular model derived from the human bladder cancer cell line T24 (TSU-Pr1 and TSU-Pr1-B2) (36, 37). It had been previously shown that the more epithelial TSU-Pr1-B2 cells are more tumorigenic and metastatic than the more mesenchymal TSU-Pr1 subpopulation and can colonize bones after i.c. inoculation in immunodeficient mice (36, 37). We confirmed that TSU-Pr1-B2 cells display features of epithelial cells when compared with the more mesenchymal TSU-Pr1 subpopulation: higher E-cadherin and desmoplakin expression levels and lower levels of fibronectin and EMT factors (SNAI2, ZEB1, ZEB2) (Supplemental Figure 6, A–C). Compared with the mesenchymal-like TSU-Pr1 cells, epithelial TSU-Pr1-B2 cells expressed higher levels of the pluripotency factors SOX2, LIN28A, NANOG, and KLF9 (Supplemental Figure 6, A–C). Functionally, the more epithelial TSU-Pr1-B2 cells formed significantly more and larger spheroids than the mesenchymal-like TSU-Pr1 cells, but were significantly less invasive in vitro (Supplemental Figure 6, D and E). Upon i.c. injection in immunocompromised mice, the more epithelial TSU-Pr1-B2 cells established metastases to the bones and other organs significantly more efficiently and at earlier times than the more mesenchymal TSU-Pr1 cells (Supplemental Figure 6F). Thus, the TSU-Pr1 and TSU-Pr1-B2 bladder cancer dual cell model share gene expression and functional features with the PC-3 prostate cancer model described above.
The maintenance of critical properties of TICs is associated with an epithelial gene program in prostate and bladder cancer cells.
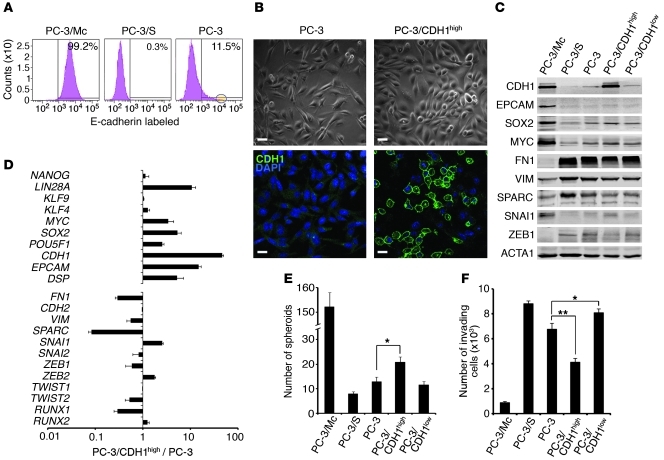
We next determined whether selection from parental PC-3 cells of a subpopulation with epithelial features could enrich for cells with higher anchorage-independent growth potential. About 11% of parental PC-3 cells expressed high levels of E-cadherin (Figure 3A). Sorting of cells at the top 1% level of CDH1 expression selected for a subpopulation (PC-3/CDH1hi) that expressed higher levels than parental or CDH1lo PC-3 cells of epithelial markers such as CDH1 and EPCAM, and also LIN28A, SOX2, MYC, POU5F1/OCT4, and KLF4 (Figure 3, B–D). PC-3/CDH1hi cells formed significantly more spheroids (Figure 3E) and were less invasive (Figure 3F) than parental or CDH1lo PC-3 cells. Additional cell-surface phenotyping showed that most PC-3/Mc cells were CD44hiCD24hiCD71hiCD40lo, while most PC-3/S cells were CD44hiCD24loCD71loCD40hi (Supplemental Table 6). Although several studies have associated prostate and breast CSCs with a CD44hiCD24lo profile (10, 38, 39), other reports have found that CSCs and aggressive tumors can express high levels of CD24 (12, 40, 41). Transferrin receptor (CD71) is expressed in actively cycling compartments in different tissues (42). Therefore, PC-3 cells enriched for an epithelial phenotype show a stronger expression of self-renewal/pluripotency gene networks.
Figure 3. E-cadherin–positive PC-3 cells show an enhanced anchorage-independent growth and a stronger expression of a self-renewal gene program relative to parental or E-cadherin–negative cells.
(A) Over 99% of PC-3/Mc cells were positive, and 0.3% of PC-3/S cells were positive for surface E-cadherin. A minor fraction (11.5%) of parental PC-3 prostate cancer cells expressed cell-surface E-cadherin. The circle on the right panel indicates the 1% sorted population with the highest CDH1 expression (PC-3/CDH1hi). (B) The bulk of parental PC-3 cells displayed a spindled morphology and low levels of membrane-bound E-cadherin. Most PC-3/CDH1hi cells displayed a round morphology and a strong expression of membrane-bound E-cadherin. Scale bars: 20 μm. (C) PC-3/CDH1hi cells expressed higher levels of MYC and SOX2 and lower levels of the mesenchymal markers fibronectin or ZEB1 than PC-3/S or PC-3/CDH1lo cells, as determined by Western blotting. (D) PC-3/CDH1hi cells expressed self-renewal/ pluripotency genes at levels significantly higher than parental PC-3 cells, as determined by real-time qPCR. Relative transcript levels are represented as the log10 of ratios between the 2 subpopulations of their 2–ΔΔCp real-time PCR values. (E) PC-3/CDH1hi cells grew more spheroids than E-cadherin–negative (PC-3/CDH1lo) or parental PC-3 cells. For comparison, the spheroid growth of PC-3/Mc and PC-3/S cells is also illustrated. (F) PC-3/CDH1hi cells were less invasive in Transwell-Matrigel assays than PC-3/CDH1lo or parental PC-3 cells. For comparison, the invasiveness of PC-3/Mc and PC-3/S cells is also illustrated. Results are expressed as mean ± SEM. *P < 0.05; **P < 0.01.
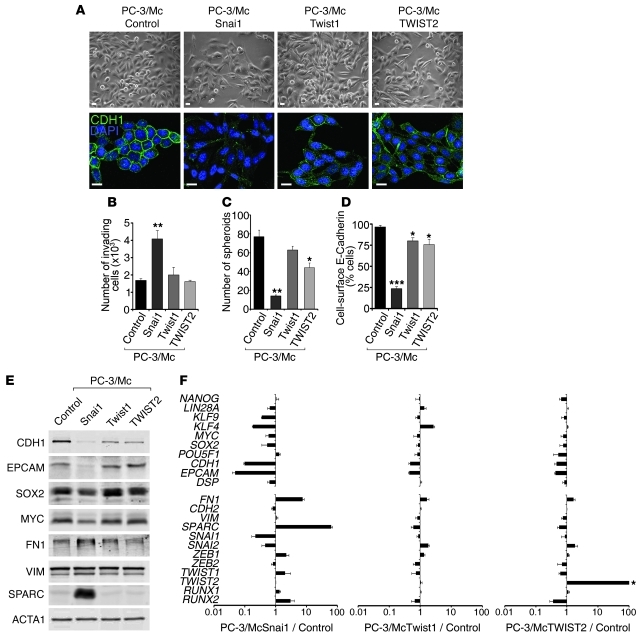
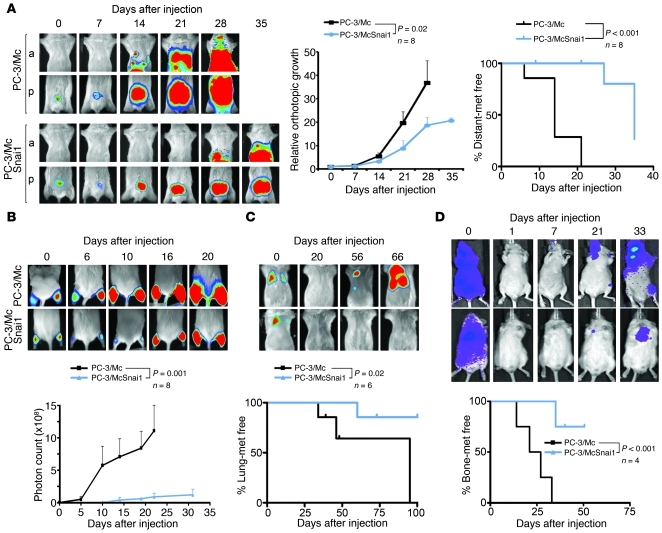
To explore whether maintenance of an epithelial gene program is important for the properties of PC-3/Mc or TSU-Pr1-B2 cells, we induced a mesenchymal program by transduction and overexpression of the EMT transcription factors Snai1, Twist1, and TWIST2 (Supplemental Figure 7). This caused, in addition to the expected changes to more fibroblastoid morphologies (Figure 4A and Supplemental Figure 8A) and enhanced invasiveness (Figure 4B and Supplemental Figure 8B), a reduced formation of spheroids (Figure 4C and Supplemental Figure 8C), in particular in response to the overexpression of Snai1. These phenotypic changes were accompanied with a downregulation of the self-renewal/pluripotency factors KLF4, SOX2, and MYC in addition to a downregulation of the epithelial markers E-cadherin, EpCAM, and desmoplakin and upregulation of the mesenchymal markers fibronectin and SPARC (Figure 4, D–F, and Supplemental Figure 8, D–F). As expected (43), the constitutive overexpression of exogenous SNAI1 in PC-3/Mc cells strongly suppressed the expression of endogenous Snai1 transcripts (Figure 4F and Supplemental Figure 8F). The switch in transcriptional programs caused by high levels of exogenous Snai1 was accompanied by an enrichment of the repressive histone mark H3K27me3 and depletion of the active transcription marks acetylated histones H3 and H4 at the promoters of SOX2 and CDH1 (Supplemental Figure 9). In addition, the overexpression of Snai1 in PC-3/Mc cells caused a decreased growth rate (Supplemental Figure 10A) and decreased the number of cells in the S phase of the cell cycle (Supplemental Figure 10B). In vivo, overexpression of Snai1 in PC-3/Mc cells led to a significant inhibition of local growth upon orthotopic (Figure 5A) or i.m. implantation (Figure 5B) as well as inhibition of their capacity to spread to regional lymph nodes and distant sites (Figure 5A) and to colonize lungs (Figure 5C) or bones (Figure 5D). Likewise, constitutive overexpression of Snai1 in TSU-Pr1-B2 bladder cancer cells led to a marked suppression of their potential for distant organ colonization (Supplemental Figure 8G).
Figure 4. Overexpression of Snai1 in PC-3/Mc cells induces EMT and suppresses anchorage-independent growth and the expression of a self-renewal gene program.
(A) Overexpression of Snai1, Twist1, or TWIST2 in PC-3/Mc cells induced a fibroblastoid morphology and a downregulation of membrane-associated E-cadherin. Cells were transduced with retroviruses for the expression of mouse Snai1 or Twist1 or human TWIST2. Controls were PC-3/Mc cells transduced with pBABE and selected for puromycin resistance. Scale bars: 20 μm. (B) Overexpression of Snai1 strongly induced the invasiveness of PC-3/Mc cells, with a moderate effect by Twist1 or TWIST2. (C) Overexpression of Snai1 strongly inhibited spheroid growth by PC-3/Mc cells, with a moderate effect by TWIST2. (D) Overexpression of Snai1 in PC-3/Mc cells caused a strong downregulation of cell-surface E-cadherin, with a moderate effect by Twist1 or TWIST2, as determined by flow cytometry. (E) Overexpression of Snai1 in PC-3/Mc cells induced a downregulation of E-cadherin and EpCAM, a modest downregulation of SOX2 and MYC, and an upregulation of fibronectin and SPARC, as determined by Western blotting. Overexpression of Twist1 or TWIST2 induced a moderate downregulation of E-cadherin. (F) Overexpression of Snai1 and, more moderately, Twist1 or TWIST2, caused a downregulation of self-renewal and epithelial genes and an upregulation of mesenchymal genes. Relative transcript levels are represented as the log10 of ratios between experimental and control cells of their 2–ΔΔCp real-time PCR values. The levels of SNAI1 correspond to the endogenous, human transcripts, downregulated by overexpression of the exogenous (mouse) Snai1. Asterisk in F indicates that values for ectopic TWIST2 are off scale. Results are expressed as mean ± SEM. *P < 0.05; **P < 0.01; ***P < 0.001.
Figure 5. Constitutive overexpression of Snai1 inhibits local growth, metastatic spread, and distant organ colonization of PC-3/Mc cells.
(A) Overexpression of Snai1 strongly inhibited local growth and metastatic spread after orthotopic prostatic implantation of PC-3/Mc-SNAI1 cells (1.0 × 10⁵) in 6-week-old male NOD-SCID mice. Anterior or posterior halves were imaged independently for enhanced resolution. Middle panel: growth curves of orthotopic tumors, with photon counts normalized to values on day 0. Right panel: Kaplan-Meier plots for metastasis-free mice. (B) Overexpression of Snai1 strongly inhibited the growth of PC-3/Mc cells (2.5 × 10⁵) grafted i.m. Mice grafted with control PC-3/Mc cells were euthanized at day 22 after grafting. Bottom panel: growth curve at the i.m. implantation site. (C) Overexpression of Snai1 prevented lung colonization of PC-3/Mc cells (2.5 × 10⁵) inoculated i.v. Bottom panel: Kaplan-Meier plots for lung colonization–free mice. (D) Overexpression of Snai1 suppressed bone colonization of PC-3/Mc cells (2.0 × 10⁵) inoculated i.c. Bottom panel: Kaplan-Meier plots for bone colonization–free mice. Results are expressed as mean ± SEM.
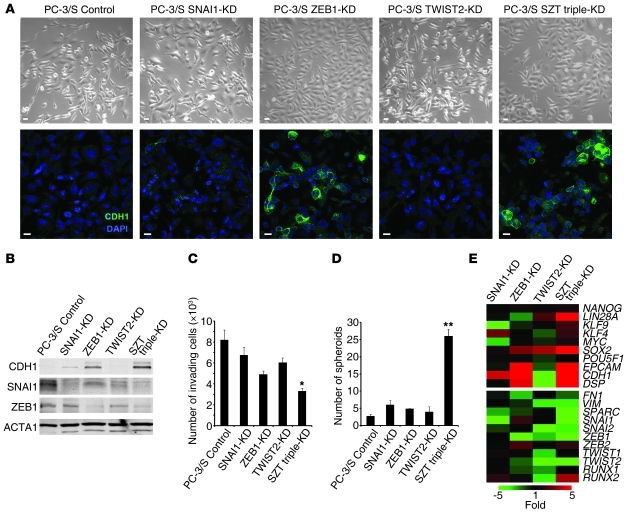
In reciprocal experiments, the mesenchymal-like PC-3/S tumor cells were manipulated to reduce the levels of EMT factors. Knockdown in these cells of SNAI1, ZEB1, or TWIST2 or a triple knockdown (SNAI1, ZEB1, and TWIST2) (Supplemental Figure 11) caused a loss of their fibroblastoid morphology (Figure 6A), an upregulation of E-cadherin (Figure 6, A, B, and E), decreased invasiveness (Figure 6C), and enhanced spheroid formation (Figure 6D), features that were more evident with the triple knockdown. This phenotypic switch was accompanied with the upregulation of genes characteristic of epithelial and self-renewal programs (Figure 6E).
Figure 6. Knockdown of EMT transcription factors in mesenchymal-like PC-3/S cells causes a gain in anchorage-independent growth and the expression of a self-renewal gene network.
(A). Knockdown of SNAI1, ZEB1, TWIST2, or a triple SZT knockdown in PC-3/S cells was associated with fewer cells with fibroblastoid morphologies and a gain in the expression of E-cadherin, most evident in ZEB1 knockdowns (single or triple SZT). Scale bars: 20 μm. (B) Knockdown in mesenchymal-like PC-3/S cells of SNAI1, ZEB1, or a triple SZT knockdown caused an upregulation of E-cadherin, as determined by Western blotting, with the strongest effect observed in the triple knockdown. (C) Knockdown of SNAI1, ZEB1, TWIST2, or a triple SZT knockdown caused a diminished invasive capacity of PC-3/S cells in Transwell-Matrigel assays, with the triple SZT knockdown showing the strongest effects. (D) Knockdown of SNAI1, ZEB1, TWIST2, or a triple SZT knockdown caused a gain in the capacity of PC-3/S cells to grow spheroids, with the triple knockdown showing the strongest effects. (E) Knockdown of SNAI1, ZEB1, TWIST2, or a triple SZT knockdown in mesenchymal-like PC-3/S cells caused an upregulation of the epithelial genes CDH1, EPCAM, and DSP and of the self-renewal/ pluripotency genes LIN28, SOX2, MYC, and KLF4, most evident for the triple SZT knockdown. Real-time RT-PCR values, determined by the ΔΔCp method, are represented as a heat map with pseudocoloring ranging from green (underexpressed relative to values in control PC-3/S cell) to red (overexpressed relative to control PC- 3/S cells). Controls were puromycin-selected PC-3/S cells bearing control pLK0-scrambled lentiviral vector. Results are expressed as mean ± SEM. *P < 0.05; **P < 0.01.
In support of the importance of an epithelial phenotype in the maintenance of properties of self renewal and metastatic potential, knockdown of E-cadherin in PC-3/Mc cells (Figure 7, A, D, and E) caused, in addition to the expected enhanced invasiveness (Figure 7B), a significant reduction in their capacity to form spheroids (Figure 7C) and to colonize lungs in NOD-SCID mice (Figure 7F). Knockdown of E-cadherin in PC-3/Mc cells was accompanied with a modest but relatively broad downregulation of self-renewal/pluripotency transcription factors, including SOX2, KLF4, and MYC, and the upregulation of several mesenchymal genes, such as FN1 and ZEB2 (Figure 7, A and D), suggesting that the expression of E-cadherin may play an active role in the maintenance of a epithelial gene program.
Figure 7. E-cadherin is required for anchorage-independent growth and lung colonization of PC-3/Mc cells.
(A) Knockdown of E-cadherin in PC-3/Mc cells downregulated SOX2 and MYC. Controls were puromycin-selected PC-3/Mc cells bearing pLK0-scrambled lentiviral vector. (B) Knockdown of E-cadherin enhanced the invasiveness of PC-3/Mc cells. (C) Knockdown of E-cadherin inhibited the spheroid-forming potential of PC-3/Mc cells. (D) Knockdown of E-cadherin in PC-3/Mc cells caused a modest downregulation of self-renewal/pluripotency genes. Relative transcript levels are represented as the log10 of ratios between experimental and control cells of 2–ΔΔCp real-time PCR values. Controls were PC-3/Mc cells bearing pLK0-scrambled vector. (E) Knockdown of E-cadherin in PC-3/Mc cells detected by indirect immunofluorescence. Scale bars: 20 μm. (F) Knockdown of E-cadherin in PC-3/Mc cells inhibited their lung colonization after i.v. injection into SCID mice. The Kaplan-Meier plot reflects the actuarial numbers of lung colonization–free mice. (G) Overexpression of E-cadherin in PC-3/S cells caused a downregulation of FN1. (H) Overexpression of E-cadherin strongly inhibited the invasiveness of PC-3/S cells. (I) Overexpression of E-cadherin strongly enhanced the spheroid-forming potential of PC-3/S cells. (J) Overexpression of E-cadherin strongly enhanced the tumorigenicity of PC-3/S cells. PC-3/S-CDH1 and control cells (5 × 10⁵) were implanted i.m. in the hind limbs of male Swiss-nude mice and tumor growth monitored with a caliper. (K) Overexpression of E-cadherin induced a moderate upregulation of self-renewal/pluripotency genes and a moderate downregulation of mesenchymal genes. Asterisk in K shows E-cadherin levels determined in murine E-cadherin–overexpressing cells reflect the exogenous transcripts, quantified with mouse-specific primers and probes (values are off scale). Results are expressed as mean ± SEM. *P < 0.05; **P < 0.01; ***P < 0.001.
Conversely, overexpression of exogenous E-cadherin in PC-3/S cells, which do not express this epithelial marker under standard growth conditions (Figure 7G), caused a strong inhibition of invasiveness (Figure 7H) and a striking gain in the capacity of cells to form spheroids (Figure 7I). Upon i.m. implantation in immunocompromised mice, and consistent with their in vitro phenotypes, PC-3/S-CDH1 cells grew tumors at significantly faster rates than control cells (Figure 7J). This phenotypic switch was accompanied with a modest upregulation of self-renewal/pluripotency factors and an inhibition of the mesenchymal-like gene profile characteristic of PC-3/S cells (Figure 7K).
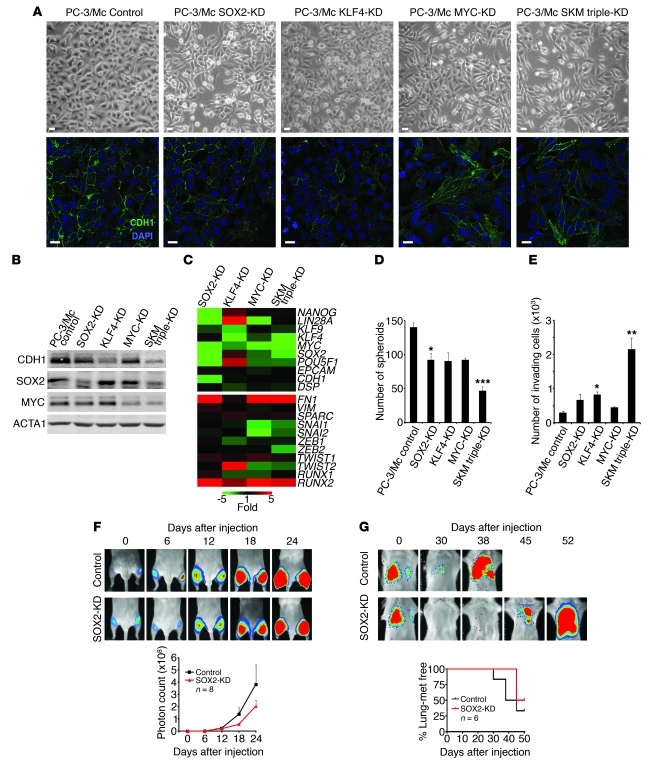
The above results suggest a tight association between the expression of an epithelial gene program and the maintenance of a self-renewal gene program and properties of TICs, as well as an inhibition of the latter properties by induction of a mesenchymal gene program. To further explore the relationship between the self-renewal gene network and the growth properties of PC-3/Mc cells, we knocked down SOX2, KLF4, or MYC, or all 3 transcripts in these cells (Supplemental Figure 12). This caused a downregulation of E-cadherin and other epithelial markers (Figure 8, A–C), a decrease in the formation of spheroids (Figure 8D), and enhanced invasiveness (Figure 8E), changes that were most evident in cells with a triple knockdown for all 3 self-renewal/pluripotency factors. In vivo, knockdown of SOX2 was sufficient to inhibit the local growth of PC-3/Mc cells (Figure 8F) and their lung colonization (Figure 8G). Knockdown of SOX2 in TSU-Pr1-B2 bladder cancer cells also resulted in a downregulation of E-cadherin (Supplemental Figure 13, A and B), loss of spheroid-forming potential (Supplemental Figure 13C), gain in invasiveness (Supplemental Figure 13D), and a strong inhibition of distant organ colonization (Supplemental Figure 13E).
Figure 8. Self-renewal factors are required for a strong epithelial program, anchorage-independent growth, and lung colonization of PC-3/Mc cells.
(A) Knockdown in PC-3/Mc cells of SOX2, KLF4, MYC, or a triple SKM knockdown induced a fibroblastoid morphology and downregulation of membrane-associated E-cadherin. Controls were puromycin-selected PC-3/Mc cells bearing pLK0-scrambled control vector. Scale bars: 20 μm. (B) Knockdown in PC-3/Mc cells of SOX2, KLF4, MYC, or a triple SKM knockdown caused a downregulation of E-cadherin, strongest for the triple knockdown and KLF4. (C) Knockdown in PC-3/Mc cells of SOX2, KLF4, MYC, or a triple SKM knockdown caused a downregulation of CDH1 and an upregulation of FN1 and SPARC. Real-time RT-PCR values, determined by the ΔΔCp method, are represented as a heat map (green, underexpressed relative to control PC-3/Mc cells; red, overexpressed). (D) Knockdown of SOX2, KLF4, MYC, or a triple SKM knockdown caused an inhibition of the capacity of PC-3/Mc cells to grow spheroids under anchorage-independent conditions, strongest for the triple knockdown. (E) Knockdown of SOX2, KLF4, MYC, or a triple SKM knockdown caused an enhanced invasiveness of PC-3/Mc cells, strongest for the triple knockdown. (F) Knockdown of SOX2 was sufficient to inhibit the tumorigenic potential of PC-3/Mc cells. Cells (2.0 × 10⁵) were implanted i.m. in male SCID mice. Bottom panel: graphical representation of photon counts at the indicated times. (G) Knockdown of SOX2 was sufficient to inhibit lung colonization by PC-3/Mc cells. Cells (2.5 × 10⁵) were inoculated i.v. in male SCID mice. Bottom: Kaplan-Meier actuarial plot for lung colonization–free mice. Results are expressed as mean ± SEM. *P < 0.05; **P < 0.01; ***P < 0.001.
In a reciprocal approach, the transduction and overexpression of SOX2 in PC-3/S cells caused the upregulation of E-cadherin and downregulation of fibronectin (Supplemental Figure 14A) and enhanced the formation of spheroids (Supplemental Figure 14B) concomitant with an inhibition of invasiveness (Supplemental Figure 14C), and a strong enhancement of tumorigenicity upon i.m. implantation (Supplemental Figure 14D).
Taken together, these observations reinforce the notion that expression of an epithelial gene program and phenotype is critical for the maintenance of a self-renewal gene program and more aggressive attributes of these tumor cells.
A cell subpopulation enriched in TICs cooperates with a subpopulation with traits of stable EMT for enhanced in vitro invasiveness and in vivo organ colonization.
The above results suggest that tumor cells with strong epithelial phenotypes and low autonomous (in vitro) invasive potential display strong metastatic potential. However, in order to develop distant metastases, tumor cells must first breach local barriers that contain them within their primary site. That the highly metastatic PC-3/Mc cells are poorly invasive in vitro may contradict this principle unless they become invasive under certain conditions. Indeed, shortly after i.m. grafting in immunodeficient mice, PC-3/Mc cells downregulated E-cadherin and upregulated fibronectin (Figure 9A), suggesting that murine factors may induce EMT in these cells in vivo. On the other hand, tumors and lung colonies formed by PC-3/Mc cells in NOD-SCID mice coexpressed SOX2 and E-cadherin (Figure 9B), suggesting that PC-3/Mc cells, when implanted alone in vivo, may escape their primary implantation sites aided by EMT induced by murine factors and that, after leaving their primary site, they may revert to an epithelial phenotype in order to grow distant metastases.
Figure 9. Downregulation of E-cadherin from PC-3/Mc cells at primary implantation sites and maintenance of its expression in lung metastasis.
(A) Downregulation of E-cadherin and upregulation of fibronectin in PC-3/Mc cells after implantation in NOD-SCID mice. Seven days after i.m. implantation, PC-3/Mc cells, homogeneously positive for E-cadherin and negative for fibronectin in culture prior to implantation, become heterogeneous for expression of membrane-associated E-cadherin, as determined by immunohistochemistry (left panel), and downregulate E-cadherin and upregulate fibronectin, as determined by Western blotting (right panel). Lanes separated by the white lines were run on the same gel but were noncontiguous. Scale bar: 100 μm. (B) PC-3/Mc cells that had metastasized to lungs after i.v. injection were largely positive for nuclear SOX2 and membrane-associated E-cadherin, as determined by immunohistochemistry. Scale bars: 100 μm.
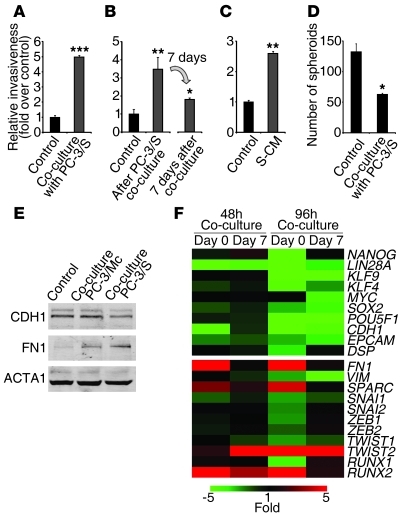
In addition, the mirror-image phenotypes of subpopulations with either epithelial or mesenchymal phenotypes in our prostate and bladder cancer models raise the question of whether diverse populations isolated from a common parental tumor cell line might interact with each other in order to compound a collective behavior that has an impact on the tumor’s potential for local invasiveness or establishment of distant metastases (2, 6, 7, 26). Upon coculture with PC-3/S cells, PC-3/Mc cells became invasive (Figure 10A), suggesting a cooperation between these 2 subpopulations in order to facilitate the local invasiveness of the more epithelial tumor cell subpopulations, which display a poor autonomous invasive potential in vitro. In addition, we found that PC-3/Mc cells that had been cocultured with PC-3/S cells were still invasive after separation from PC-3/S cells by FACS (Supplemental Figure 15), a phenotypic change that was maintained for at least 7 days after coculture (Figure 10B) and was reversible, following a time-dependent decline after separation from PC-3/S cells (Figure 10, B and F). Coculture of PC-3/Mc cells with NIH3T3 fibroblasts also stimulated their invasiveness (Supplemental Figure 16), suggesting that the invasiveness of epithelial PC-3/Mc can be enhanced by exposure to both tumoral and nontumoral mesenchymal cell types. We further found that conditioned medium (CM) from PC-3/S cells markedly induced the invasiveness of PC-3/Mc cells (Figure 10C), suggesting that diffusible factors play a significant role in the stimulation of invasiveness of PC-3/Mc cells induced by PC-3/S cells. Moreover, PC-3/Mc cells that had been cocultured with PC-3/S cells not only gained in invasive potential, but were inhibited in their anchorage-independent growth potential (Figure 10D), reminiscent of the inhibition of self renewal and anchorage-independent growth by EMT observed in the experiments described above.
Figure 10. PC-3/S cells enhance the invasiveness of PC-3/Mc cells.
(A) Coculture with PC-3/S cells induced the invasiveness of PC-3/Mc cells. Green-labeled PC-3/Mc cells were cocultured with red-labeled PC-3/S cells on Transwell units and green or red fluorescent invading cells scored by flow cytometry. Controls were green-labeled PC-3/Mc cells cocultured with unlabeled PC-3/Mc cells. (B) The enhanced invasiveness of PC-3/Mc cells was maintained for several days after coculture with PC-3/S cells. GFP-labeled PC-3/Mc cells were cocultured for 48 hours with red-labeled PC-3/S cells, sorted, and assayed for invasiveness either immediately or 7 days later. (C) Diffusible factors secreted by PC-3/S cells enhanced the invasiveness of PC-3/Mc cells. PC-3/Mc cells were exposed for 48 hours to CM from PC-3/S cells (S-CM) and assayed for invasiveness. (D) Coculture with PC-3/S cells inhibited the spheroid growth of PC-3/Mc cells. GFP-expressing PC-3/Mc cells and RFP-expressing PC-3/S cells were cocultured and scored for spheroids after 14 days. (E) Coculture of PC-3/Mc cells with PC-3/S cells induced a downregulation of E-cadherin and an upregulation of fibronectin. Green-labeled PC-3/Mc cells and red-labeled PC-3/S cells were cocultured for 48 hours, sorted, and analyzed by Western blotting. (F) PC-3/Mc cells cocultured with PC-3/S cells shifted their transcriptional programs following a time-dependent reversion after coculture. Green-labeled PC-3/Mc cells were cocultured with red-labeled PC-3/S cells for 48 or 96 hours, sorted, and analyzed either immediately (day 0) or 7 days after sorting (day 7). Relative qPCR transcript levels are represented as a heat map (green, underexpressed relative to control PC-3/Mc; red, overexpressed). Results are expressed as mean ± SEM. *P < 0.05; **P < 0.01; ***P < 0.001.
The observed phenotypic switch was accompanied with a downregulation of the epithelial genes CDH1, EPCAM, and DSP and the self-renewal/pluripotency genes SOX2, OCT4, KLF4, and LIN28A along with upregulation of the mesenchymal genes FN1, SPARC, TWIST2, and RUNX2, which also declined with time after coculture (Figure 10, E and F). Changes in histone marks at relevant promoters support an epigenetic basis for this gene program switch (Supplemental Figure 17) and may help explain the persistence of the invasive program of PC-3/Mc cells 7 or more days after their coculture and separation from PC-3/S cells (Figure 10, B and F). These observations suggest that the escape of epithelial/TIC subpopulations from local environments may follow not only passive mechanisms through the action of stromal components and mesenchymal tumor cells (25), but also an active mechanism through transient EMT of epithelial tumor subpopulations induced by mesenchymal tumor subpopulations.
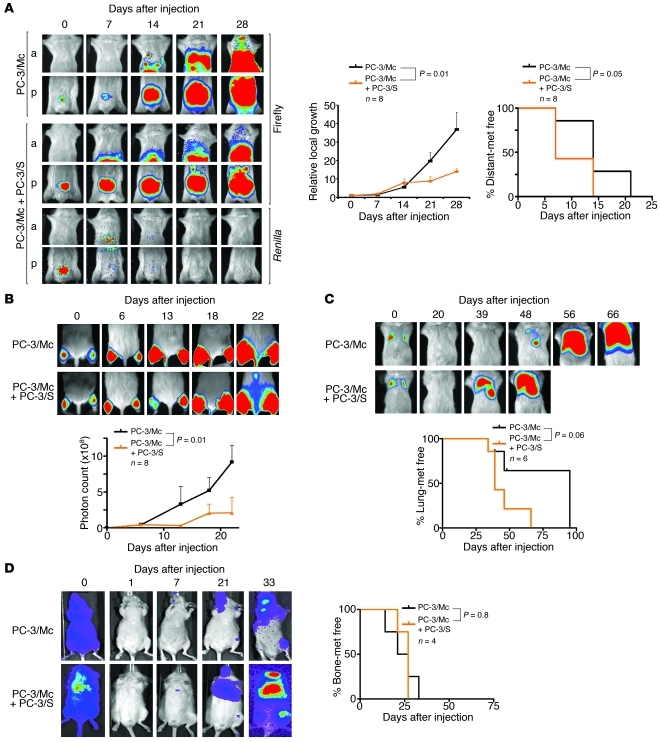
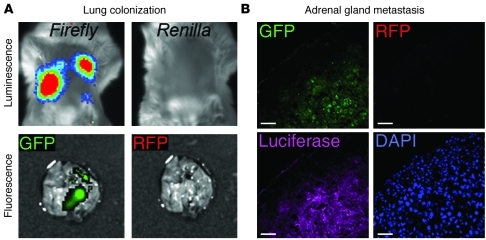
In vivo, PC-3/Mc cells coinjected with PC-3/S cells grew at significantly slower rates than PC-3/Mc cells alone upon orthotopic (Figure 11A) or i.m. (Figure 11B) implantation, but metastasized to regional lymph nodes after orthotopic implantation at earlier times than control PC-3/Mc cells alone (Figure 11A). In these experiments, Renilla luciferase–expressing PC-3/S cells were transiently detected outside of the site of orthotopic implantation at early times after orthotopic implantation (Figure 11A), but ceased to be detected after more prolonged monitoring both at the site of implantation or at distant sites (Figure 11A), consistent with the highly invasive but poorly metastatic properties of these cells. These results are also consistent with the in vitro observations, described above, of reduced growth of PC-3/Mc cells when cocultured with PC-3/S cells, along with an increased capacity to escape from implantation sites, followed by a subsequent restoration of their growth potential at distant sites where PC-3/S cells are no longer present. Upon i.v. injection, PC-3/Mc cells coinjected with PC-3/S cells colonized lungs at earlier times than PC-3/Mc cells alone (Figure 11C), suggesting that interaction with PC-3/S cells also rendered them more efficient at extravasation. Indeed, upon i.c. inoculation, PC-3/Mc cells coinjected with PC-3/S cells were not more efficient than PC-3/Mc cells injected alone at colonizing bones (Figure 11D), where the permeable sinusoidal capillary system of bone marrow represents a much weaker barrier to extravasation than the capillaries in the lungs or other organs (44). Additionally, PC-3/Mc cells coinjected i.c. with PC-3/S cells colonized adrenal glands (Supplemental Table 7), which they never colonized when injected alone. Coinjection of PC-3/Mc cells expressing green fluorescent protein together with PC-3/S cells expressing red fluorescent protein (RFP) and Renilla luciferase allowed us to identify the cells of origin of the tumors that developed in distant organs. Such tumors contained only green fluorescence but not red fluorescence — or Renilla luciferase–expressing cells, indicating that only PC-3/Mc cells contributed to distant organ colonization (Figure 11A and Figure 12).
Figure 11. PC-3/S cells facilitate the spread and metastatic growth of PC-3/Mc cells.
(A) Orthotopic coimplantation of GFP-PC-3/Mc cells with RFP- and Renilla luciferase–expressing PC-3/S cells in the ventral prostate of NOD-SCID mice diminished their growth rate at the implantation, while accelerating the appearance of metastatic growth. Bioluminescence monitoring was performed separately for the anterior and posterior halves of the mice, for improved resolution. Middle: growth curves of orthotopically implanted tumor cells, with photon counts normalized relative to values on day 0. Right: Kaplan-Meier actuarial plots for metastasis-free mice. (B) Coimplantation (i.m.) of GFP-PC-3/Mc cells with RFP-PC-3/S cells diminished their growth rate as compared with GFP-PC-3/Mc cells implanted alone. Bottom: graphical representation of growth at the implantation site. (C) Coinoculation (i.v.) of GFP-PC-3/Mc cells with RFP-PC-3/S cells accelerated their lung colonization. Bottom: Kaplan-Meier actuarial plots for lung colony–free mice. (D) Coinoculation (i.c.) of GFP-PC-3/Mc cells with RFP-PC-3/S cells did not significantly affect their bone colonization efficiency. Right panel: Kaplan-Meier actuarial plots for bone colony–free mice. Results are expressed as mean ± SEM.
Figure 12. Metastases formed after joint injection of PC-3/Mc and PC-3/S cells contain exclusively epithelial PC-3/Mc cells.
(A) Only PC-3/Mc cells, but not PC-3/S cells, colonized lungs after joint i.v. injection. PC-3/S, but not PC-3/Mc, cells also expressed Renilla luciferase. Firefly luciferase, but not Renilla, signal was detected in lung tumors. In parallel, GFP (expressed by GFP-PC-3/Mc cells) or RFP (expressed by RFP-PC-3/S cells) was visualized microscopically. Only GFP signal, but not RFP signal, was detected in lung tumors. (B) Only PC-3/Mc cells, but not PC-3/S cells, colonize adrenal glands after i.c. joint inoculation. Thirty-three days after inoculation, mice were sacrificed and adrenal metastatic tumors frozen and processed for fluorescent visualization of GFP or RFP and for immunofluorescent detection of firefly luciferase (as a marker common to both cell types). Samples were counterstained for nuclei with DAPI. Only GFP signal, but not RFP signal, was detected in adrenal metastases. Scale bars: 50 μm.
These results suggest that, in vivo, while the mesenchymal-like PC-3/S tumor cells can escape local tumor sites but lack metastatic potential, their presence facilitates the escape of the more epithelial PC-3/Mc cells from local tumor sites in order to establish distant metastases.
Expression of a self-renewal gene network active in PC-3/Mc cells is associated with more advanced stages of prostate cancer.
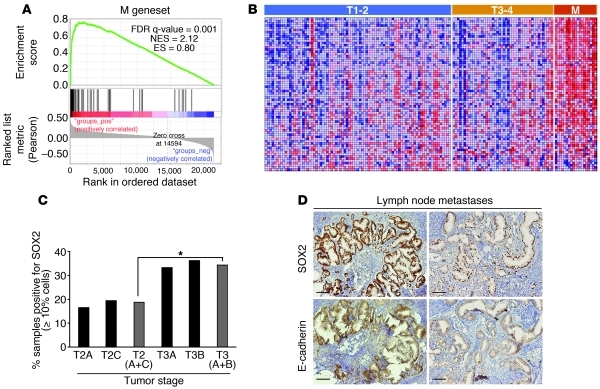
The above observations suggest that more aggressive tumors contain larger representations of epithelial tumor cells with high self-renewal potential. To determine whether the self-renewal gene network active in the more epithelial PC-3/Mc subpopulation is associated with aggressive prostate cancers, we extracted a subset of the ESC gene set (12) that most significantly discriminated PC-3/Mc from PC-3/S cells (designated M gene set; Supplemental Table 8) and interrogated it for its enrichment in an expression data set for 150 samples from prostate cancer patients. (45). This analysis showed that the M gene set is indeed significantly enriched in metastatic relative to primary prostate cancer samples and also in primary tumor samples from more advanced stages (T3 and T4 vs. T1 and T2) (Figure 13, A and B).
Figure 13. Expression of a self-renewal gene network active in PC-3/Mc cells is associated with more advanced stages of prostate cancer.
(A) GSEA on an expression data set for 150 prostate cancer samples (45) showing a significant enrichment of the M geneset (genes of the ESC module [ref. 13] enriched in PC-3/Mc cells) in metastases relative to primary tumors, and in T3 and T4 stage primary tumors relative to T1 and T2 stage primary tumors. Pearson’s correlation was applied to determine linear relationships between gene profiles and 3 phenotypes (class 1: metastatic; class 2: T3 and T4 stage primary; class 3: T1 and T2 stage primary) taken as continuous variables. (B). Heat map illustrating the relative expression levels for the 70 genes of the M gene set. Samples are ordered as primary tumors with stages T1 or T2, stages T3 or T4, or metastases (M). (C) Ninety-four cases of prostate cancer were analyzed for SOX2 expression by immunohistochemistry. Positive cases contained at least 10% of cells with nuclear SOX2 staining. *P < 0.05, between the frequencies of SOX2-positive cases in stages T2A and T2C versus and stage T3A and T3B tumors. (D) In some lymph node metastases, but in none of the 94 primary tumors, all visible tumor cells were strongly positive for nuclear SOX2, and stronger SOX2 expression correlated with stronger E-cadherin expression. Right: a second metastatic sample with a more heterogeneous and weaker nuclear SOX2 staining of tumor cells displays weaker membrane E-cadherin staining. Scale bars: 100 μm.
To determine whether these observations could be applied in in situ histopathological analyses, we studied the expression of SOX2 as a potential indicator of self-renewing populations by immunohistochemistry on samples from primary and metastatic prostate cancer (Supplemental Table 9). The results revealed a significantly higher frequency of SOX2-positive samples in stage T3 than in stage T2 tumors (Figure 13C). Strikingly, in several SOX2-positive metastases, all tumor cells expressed SOX2 with a strong nuclear staining. Such strong and homogeneous expression of SOX2 was not observed in any of the primary tumors studied. In addition, those metastatic samples with the strongest expression of SOX2 showed the strongest staining for E-cadherin (Figure 13D). This suggests that some prostate cancer metastases are enriched in tumor cells with active self-renewal programs expressing high levels of SOX2 and E-cadherin, consistent with the finding by Tsuji et al. that cells that colonize to organs are non-EMT cells (25) and also with studies describing a stronger expression of E-cadherin in metastatic tumors (46, 47).
Discussion
A major focus of study of the metastasis problem is understanding the mechanisms by which tumor cells escape the local environment and colonize distant organs (19, 20, 48). It has been proposed that the engagement of an EMT program simultaneously leads, through mechanisms not yet elucidated, to the acquisition of a self-renewal program (24, 48), endowing tumor cells not only with the capacity to invade and migrate through tissues, but also to survive in the circulation and form colonies in distant organs. The latter hypothesis is largely based on experiments in which the expression of transcription factors that direct the expression of EMT programs is manipulated for overexpression or silencing in relatively heterogeneous populations of tumor cells and on the study of their capacity to form tumors, invade local tissues, and establish metastases in immunocompromised mice.
Here, we have studied clonal populations derived from the PC-3 prostate cancer and the TSU-Pr1 bladder cancer cell lines displaying relatively stable and contrasting phenotypes, namely cells with a strong epithelial phenotype (PC-3/Mc and TSU-Pr1-B2) and a more mesenchymal phenotype (PC-3/S and TSU-Pr1), as determined by the expression of genes characteristic of either program. Our analysis shows that the subpopulations with the stronger epithelial phenotypes display clearly enhanced capacities to form spheroids in culture and to colonize lungs and bone, compared with the tumor subpopulations with stable mesenchymal-like phenotypes, despite the fact that the latter are more invasive through extracellular matrix in in vitro assays.
In order to further explore the hypothesis that a strong self-renewal and metastatic phenotype requires the maintenance of an epithelial program in our cell models, we have (a) induced constitutive EMT in epithelial tumor subpopulations through the transduction and overexpression of EMT-directing transcription factors, (b) knocked down the same factors in the mesenchymal-like PC-3/S cell subpopulation, (c) knocked down E-cadherin in the epithelial tumor subpopulations, (d) transduced and overexpressed E-cadherin in PC-3/S cells, (e) knocked down self-renewal/pluripotency factors in the strongly epithelial PC-3/Mc subpopulation, and (f) transduced and overexpressed the self-renewal factor SOX2 and the epithelial gene E-cadherin in the mesenchymal-like PC-3/S tumor cells. The results from all these complementary approaches lead to the same conclusions, namely that the suppression of an epithelial program (through constitutive expression of EMT transcription factors or knockdown of E-cadherin) inhibits the self-renewal/pluripotency gene network of tumor cells, their capacity to grow under attachment-independent conditions, and their tumorigenic and metastatic potentials. The association between properties attributed to TICs and an epithelial phenotype is further supported by the fact that knockdown of 3 of the 4 canonical Yamanaka pluripotency transcription factors (SOX2, KLF4, and MYC) in PC-3/Mc cells reduced their epithelial phenotype and TIC attributes and induced an invasive and more mesenchymal phenotype, while the overexpression of SOX2 in PC-3/S cells was sufficient to enhance the expression of epithelial markers and properties of TICs in these cells, including enhanced tumorigenicity, while inhibiting invasiveness and the expression of mesenchymal markers.
These results suggest that the self-renewal properties of these tumor cells depend on the same factors that endow normal cells with self renewal and pluripotency (31, 32), that this gene network sustains the expression of an epithelial gene program and, at the same time, opposes the expression of a mesenchymal gene program and the acquisition of a motile and invasive phenotype. Reciprocally, the induction of a mesenchymal gene program in our cells opposes not only their epithelial gene program, but also their self-renewal gene network and associated properties. This situation is reminiscent of the requirement for normal adult fibroblasts to undergo a mesenchymal-epithelial transition (MET) for their reprogramming into self-renewing pluripotent cells (49–51). In fact, it has been shown that the expression of E-cadherin by itself can facilitate the reprogramming of adult fibroblasts and the acquisition of pluripotency (52, 53). Our results suggest that the association between self renewal and epithelial gene programs also holds true for at least the 2 cellular models studied here, derived from prostate and bladder cancers.
The contraposition between a gene program that drives self renewal and an invasive program also has precedents in other biological settings. During normal vertebrate development, neural crest progenitor cell migration and specification require the activation, among other factors, of Snail/Slug and concomitant suppression of Sox2, events that are induced both by diffusible factors and cell-cell interactions (54, 55). On the other hand, epithelial reprogramming is required for the induction or maintenance of pluripotent states, which are facilitated by inhibition of EMT (49, 51), while induction of EMT by SNAI1 can be antiproliferative (56, 57). This evidence and our own observations suggest that mutual exclusion between progenitor/stem cell (or CSC in tumors) and EMT programs may be the prevalent mode in the differentiation of normal progenitor cells in some tissues and also in the evolution of some epithelial tumors.
The suppression of major attributes of TICs by constitutive EMT found in our study may seem to contradict other models, in which EMT induced by a number of factors potentiates self renewal together with enhanced tumorigenic and metastatic capacities (22, 24). However, our observations are supported by models in which local invasiveness is inversely correlated with metastatic or organ colonization potential (25, 28). Additional studies, including some in which EMT is proposed to enhance tumorigenic and metastatic potentials, have also shown that tumor cell subpopulations with clear epithelial phenotypes are endowed with the strongest metastatic potential (23, 28, 58, 59). Our observations led us to propose that tumor cells that depend on a self-renewal/pluripotency gene network for their aggressive properties may be susceptible to an inhibition of those properties by EMT, perhaps through direct or indirect downregulation of the self-renewal/pluripotency gene network by factors such as SNAI1. We speculate that tumor cell types that do not depend on the self-renewal/pluripotency gene network for their tumorigenic and metastatic potentials may use EMT factors to induce a self-renewal state, as described for several models (23, 60), through a variety of mechanisms. Tissue-specific regulatory networks could also account for different phenotypic consequences of EMT in different cell types. For example, it has been reported that EMT of primary prostate epithelial cells is not accompanied with enhanced anchorage-independent growth, (61), and as we have found in this study, EMT can suppress the self-renewal states of prostate and bladder cancer cells, while the induction of EMT in noncancerous MCF10 breast epithelial cells enhances their potential to form mammospheres (22, 24).
A second major finding of our study is that, during cooperation between epithelial and mesenchymal-like tumor subpopulations, the former transiently undergo an EMT. The cooperation between epithelial and mesenchymal-like tumor cell subpopulations for enhanced local invasiveness has been described in other models (25, 26). Our findings add a further level of regulatory complexity in these cell-cell interactions and suggest that the escape of epithelial TICs from their primary sites is facilitated by both passive and active mechanisms. Passive escape mechanisms include the breakdown of extracellular matrix and other tissue structures by tumor-associated stromal cells (8, 19, 48) and by tumor cells that have acquired relatively stable mesenchymal-like gene programs (25, 26). We consider here as an active mechanism the reversible acquisition of a mesenchymal-like invasive state by epithelial tumor cells with self-renewal potential, as observed in this study. In this scheme, it is important to distinguish between tumor cell subpopulations that have acquired relatively stable mesenchymal-like phenotypes and those subpopulations with strong epithelial phenotypes that can undergo transient EMT. In our prostate cancer model, the former subpopulation is unable to establish distant metastases, while the latter cells maintain their capacity to metastasize, suggesting that they undergo a reversion of the EMT, or MET, after they escape from their primary sites. The latter hypothesis is supported by our observations that many experimental metastases express E-cadherin and that metastases from prostate cancer patients also frequently display a strong expression of E-cadherin.
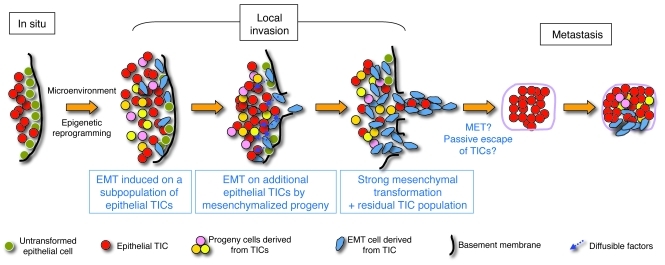
Collectively, our observations suggest that, in some cancers, the acquisition of mesenchymal traits by tumor cells that leads to their loss of epithelial properties occurs at the expense of their self-renewal potential. When the induction of EMT is constitutive, as by forced overexpression of Snai1, the losses in self renewal and tumorigenic and metastatic potentials are also sustained. On the other hand, transient EMT, such as that induced by the cooperation between epithelial and mesenchymal tumor subpopulations described in this study, could enhance the local invasiveness of the epithelial subpopulation, thus contributing to the overall metastatic potential of a tumor in which heterogeneous epithelial and mesenchymal subpopulations coexist. This model is schematically summarized in Figure 14 and proposes that the more epithelial/self-renewal tumor populations that leave their primary site either passively, aided by stromal or mesenchymal-like tumor cells, or actively, through their own transient EMT, can form metastases because they have maintained their epithelial phenotypes or, if they have undergone EMT at the primary site, revert to an epithelial/self-renewal program at distant sites. We further propose that, once at their metastatic sites, epithelial TICs may follow a cycle similar to that occurring at the primary sites, with induction of EMT at varying degrees, depending on the environment of the metastatic sites. Formal proof of this model, in particular the demonstration of transient local EMT of epithelial TICs followed by MET at distant sites, would require additional experimental confirmation. Our model is compatible with a more direct participation of stromal or other nontumoral cells in promoting the local invasiveness of tumor cells (8).
Figure 14. A model of metastasis potentiated by cooperation between tumor cell populations expressing either epithelial/TIC or mesenchymal programs.
We propose a model in which some TICs, with properties of CSCs, undergo EMT under the influence of environmental factors. This results in epigenetic reprogramming, including a repression in those cells of pluripotency programs that sustain cell self renewal. These “mesenchymalized” cells, in turn, either through direct cell-cell interaction or through diffusible factors, drive the mesenchymal conversion of additional populations of TIC/CSCs that have not yet undergone EMT, resulting in a reinforcement of the mesenchymalization of the tumor. The predominantly mesenchymalized populations of tumor cells complete the breach of local barriers and thus the tumor becomes fully invasive. The tumor cells escaping from the local site would thus be a combination of stably mesenchymalized tumor cells, cells retaining TIC/CSC properties that leave the tumor following paths open by actively invading cells (passive escape), or TIC/CSCs that have undergone transient EMT (active escape). After hematogenous or lymphogenous spread, TIC/CSCs that have not undergone EMT or that have reverted to an epithelial program and phenotype from their transient EMT (MET) can establish distant metastases. This cycle may be repeated at the metastatic site. Tumor cells with stable mesenchymal-like phenotypes that have escaped from the local tumor site but that do not revert to an epithelial gene program and phenotype would not have the capacity to establish distant metastases.
Methods
Additional information appears in Supplemental Methods.
Cell lines and reagents.
PC-3/Mc and PC-3/S were clonally derived from the human cell line PC-3, isolated from the bone metastasis of a prostate adenocarcinoma (62). Both sublines carry the integrated firefly luciferase gene coding region cloned in the Superluc pRC/CMV vector (Invitrogen). The PC-3/Mc clone was selected by limiting dilution from PC-3/M, isolated from liver metastases produced in nude mice subsequent to intrasplenic injection of PC-3 cells (30). PC-3/S cells were selected by limiting dilution from parental PC-3 cells. Cells were grown at 37°C in a 5% CO2 atmosphere in complete RMPI 1640 supplemented with 200 μg/ml Geneticin (Sigma-Aldrich) to maintain the chromosomal integration of the luciferase gene. TSU-Pr1 and B2 cells (36, 37) were maintained at 37°C in a 5% CO2 atmosphere in complete DMEM. All media were supplemented with 2 mM l-glutamine, 100 U/ml penicillin, 100 μg/ml streptomycin, and 10% FBS. Unless otherwise indicated, media and sera were from PAA.
Spheroid formation assay.
Cells (103/well) were seeded on 24-well Ultra Low Attachment culture plates (Corning) in complete culture medium containing 0.5% methyl cellulose (Sigma-Aldrich) and allowed to grow for 14 days. For serial transfer experiments, single spheroids were picked with a pipette, disgregated, and processed as above. All experimental conditions were done in triplicate.
In vitro invasiveness assay.
Transwell chambers (Costar) with 8-μm diameter pore membranes were coated with growth factor–reduced Matrigel (BD Biosciences) at 410 μg/ml and human umbilical cord hyaluronic acid (Sigma-Aldrich) at 100 μg/cm2. Cells (1.5 × 10⁵/well in 24-well plates; 7 × 10⁴/well in 96-well plates) were serum deprived for 24 hours, detached, resuspended in medium supplemented with 0.1% BSA/0.5% FBS, and then seeded onto the precoated Transwell inserts, with the lower chamber containing medium supplemented with 0.5% FBS. After 24 hours, cells migrating to the lower chamber were collected by detachment with trypsin-EDTA, washed with PBS, and counted in a Coulter Multisizer II instrument (Coulter Electronics). Each experiment was done in triplicate.
Coculture and cell-sorting experiments.
PC-3/Mc cells were labeled with Oregon Green 488 carboxy-DFFDA-SE (Invitrogen) with excitation maximum at 488 nm and emission at 524 nm. PC-3/S cells were labeled with Far Red DDAO-SE (Invitrogen), with excitation maximum at 600 nm and emission at 670 nm. Cells were labeled by adding 25 μM of fluorophore to the cell suspensions for 30 minutes, washed with PBS, and reseeded. Fluorophore-preloaded cells were cocultured at a 1:1 proportion for 48 or 96 hours and either assayed for invasiveness on Transwell-Matrigel chambers or sorted with a FACSAria SORP instrument (BD). After sorting, cells were either assayed for invasiveness in Transwell-Matrigel assays or processed for protein extraction (for Western blotting), RNA extraction (for quantitative PCR [qPCR]), or ChIP. As controls, PC-3/Mc cells were preloaded with Oregon Green, cocultured with unlabeled PC-3/Mc cells, and sorted by FACS.
Invasiveness assays with PC-3/S CM.
PC-3/S cells were cultured at 70% confluence, at which time they were changed to fresh CD-CHO medium (Invitrogen) without FBS; CM was collected after 48 hours, centrifuged, and filtered through a 0.22-μm filter (Millipore). PC-3/Mc cells were cultured with PC-3/S CM (S-CM) mixed with fresh medium without FBS at a 1.5:1 proportion for 48 hours, and these cells were then analyzed for invasiveness and Western blotting.
Statistics.
Results are expressed as mean ± SEM, illustrated as error bars. A 2-tailed Student’s t test was applied for statistical analysis.
Study approval.
All tests in this study employing human tissues were performed on postdiagnosis surplus samples obtained at the Hospital Clínic de Barcelona, following protocols previously approved by the Hospital Clínic Institutional Review Board. All animal studies were performed following protocols previously approved by the CID-CSIC Institutional Review Board. As independently certified by these 2 institutional review boards, all studies involving human or animal materials or subjects were performed in compliance with Spanish laws regulating ethics in research and patient data confidentiality (Ley de Investigación Biomédica 14/2007, de 3 de Julio de 2007).
Supplementary Material
Acknowledgments
We thank Dídac Domínguez and Marc Guiu (xenograft experiments), Mònica Marín (immunohistochemistry), Mònica Pons (confocal microscopy), and Jaume Comas and Ricard ρlvarez (flow cytometry) for excellent technical assistance. T. Celià-Terrassa is a recipient of a doctoral fellowship from the CSIC. Ó. Meca-Cortés, A. Arnal-Estapé, and C. Estarás are recipients of doctoral fellowships and F. Mateo of a Juan de la Cierva postdoctoral fellowship from the Ministerio de Ciencia e Innovación (MICINN). R.R. Gomis is a researcher of the Institució Catalana de Recerca i Estudis Avançats. Financial support was provided to T.M. Thomson by MICINN (SAF2008-04136-C02-01 and SAF2011-24686), the Agència de Gestió d’Ajuts Universitaris i de Recerca (2009SGR1482), the Agencia Española de Cooperación Internacional y Desarrollo (A/023859/09), and the Xarxa de Referencia en Biotecnologia; to P.L. Fernández by MICINN (FIS-PI080274), the Fondo de Investigaciones de la Seguridad Social (PI080274), the Spanish National Biobank Network, the Instituto de Salud Carlos III (ISCIII-RETIC RD06/0020), the Xarxa de Bancs de Tumours de Catalunya-Pla Director d’Oncologia, and the Fondo Europeo de Desarrollo Regional (FEDER) — Unión Europea “Una manera de hacer Europa”; and to R.R. Gomis by the BBVA Foundation and MICINN (SAF2007-62691).
Footnotes
Conflict of interest: The authors have declared that no conflict of interest exists.
Citation for this article: J Clin Invest. 2012;122(5):1849–1868. doi:10.1172/JCI59218.
References
- 1.Feinberg AP, Ohlsson R, Henikoff S. The epigenetic progenitor origin of human cancer. Nat Rev Genet. 2006;7(1):21–33. doi: 10.1038/nrg1748. [DOI] [PubMed] [Google Scholar]
- 2.Axelrod R, Axelrod DE, Pienta KJ. Evolution of cooperation among tumor cells. Proc Natl Acad Sci U S A. 2006;103(36):13474–13479. doi: 10.1073/pnas.0606053103. [DOI] [PMC free article] [PubMed] [Google Scholar]
- 3.Balkwill F. Cancer and the chemokine network. Nat Rev Cancer. 2004;4(7):540–550. doi: 10.1038/nrc1388. [DOI] [PubMed] [Google Scholar]
- 4.Yang MH, et al. Direct regulation of TWIST by HIF-1alpha promotes metastasis. Nat Cell Biol. 2008;10(3):295–305. doi: 10.1038/ncb1691. [DOI] [PubMed] [Google Scholar]
- 5.Merlo LM, Pepper JW, Reid BJ, Maley CC. Cancer as an evolutionary and ecological process. Nat Rev Cancer. 2006;6(12):924–935. doi: 10.1038/nrc2013. [DOI] [PubMed] [Google Scholar]
- 6.Moreno E. Is cell competition relevant to cancer? Nat Rev Cancer. 2008;8(2):141–147. doi: 10.1038/nrc2252. [DOI] [PubMed] [Google Scholar]
- 7.Wu M, Pastor-Pareja JC, Xu T. Interaction between Ras(V12) and scribbled clones induces tumour growth and invasion. Nature. 2010;463(7280):545–548. doi: 10.1038/nature08702. [DOI] [PMC free article] [PubMed] [Google Scholar]
- 8.Karnoub AE, et al. Mesenchymal stem cells within tumour stroma promote breast cancer metastasis. Nature. 2007;449(7162):557–563. doi: 10.1038/nature06188. [DOI] [PubMed] [Google Scholar]
- 9.Lapidot T, et al. A cell initiating human acute myeloid leukaemia after transplantation into SCID mice. Nature. 1994;367(6464):645–648. doi: 10.1038/367645a0. [DOI] [PubMed] [Google Scholar]
- 10.Al-Hajj M, Wicha MS, Benito-Hernandez A, Morrison SJ, Clarke MF. Prospective identification of tumorigenic breast cancer cells. Proc Natl Acad Sci U S A. 2003;100(7):3983–3988. doi: 10.1073/pnas.0530291100. [DOI] [PMC free article] [PubMed] [Google Scholar]
- 11.Singh SK, et al. Identification of a cancer stem cell in human brain tumors. Cancer Res. 2003;63(18):5821–5828. [PubMed] [Google Scholar]
- 12.Ben-Porath I, et al. An embryonic stem cell-like gene expression signature in poorly differentiated aggressive human tumors. Nat Genet. 2008;40(5):499–507. doi: 10.1038/ng.127. [DOI] [PMC free article] [PubMed] [Google Scholar]
- 13.Wong DJ, Liu H, Ridky TW, Cassarino D, Segal E, Chang HY. Module map of stem cell genes guides creation of epithelial cancer stem cells. Cell Stem Cell. 2008;2(4):333–344. doi: 10.1016/j.stem.2008.02.009. [DOI] [PMC free article] [PubMed] [Google Scholar]
- 14.Floor S, van Staveren WC, Larsimont D, Dumont JE, Maenhaut C. Cancer cells in epithelial-to-mesenchymal transition and tumor-propagating-cancer stem cells: distinct, overlapping or same populations. Oncogene. 2011;30(46):4609–4621. doi: 10.1038/onc.2011.184. [DOI] [PubMed] [Google Scholar]
- 15.Gupta PB, Chaffer CL, Weinberg RA. Cancer stem cells: mirage or reality? Nat Med. 2009;15(9):1010–1012. doi: 10.1038/nm0909-1010. [DOI] [PubMed] [Google Scholar]
- 16.Huber MA, Kraut N, Beug H. Molecular requirements for epithelial-mesenchymal transition during tumor progression. Curr Opin Cell Biol. 2005;17(5):548–558. doi: 10.1016/j.ceb.2005.08.001. [DOI] [PubMed] [Google Scholar]
- 17.Peinado H, Olmeda D, Cano A. Snail, Zeb and bHLH factors in tumour progression: an alliance against the epithelial phenotype? Nat Rev Cancer. 2007;7(6):415–428. doi: 10.1038/nrc2131. [DOI] [PubMed] [Google Scholar]
- 18.Acloque H, Adams MS, Fishwick K, Bronner-Fraser M, Nieto MA. Epithelial-mesenchymal transitions: the importance of changing cell state in development and disease. J Clin Invest. 2009;119(6):1438–1449. doi: 10.1172/JCI38019. [DOI] [PMC free article] [PubMed] [Google Scholar]
- 19.Thiery JP, Acloque H, Huang RY, Nieto MA. Epithelial-mesenchymal transitions in development and disease. Cell. 2009;139(5):871–890. doi: 10.1016/j.cell.2009.11.007. [DOI] [PubMed] [Google Scholar]
- 20.Chaffer CL, Weinberg RA. A perspective on cancer cell metastasis. Science. 2011;331(6024):1559–1564. doi: 10.1126/science.1203543. [DOI] [PubMed] [Google Scholar]
- 21.Yang J, Weinberg RA. Epithelial-mesenchymal transition: at the crossroads of development and tumor metastasis. Dev Cell. 2008;14(6):818–829. doi: 10.1016/j.devcel.2008.05.009. [DOI] [PubMed] [Google Scholar]
- 22.Ansieau S, et al. Induction of EMT by twist proteins as a collateral effect of tumor-promoting inactivation of premature senescence. Cancer Cell. 2008;14(1):79–89. doi: 10.1016/j.ccr.2008.06.005. [DOI] [PubMed] [Google Scholar]
- 23.Yang J, et al. Twist, a master regulator of morphogenesis, plays an essential role in tumor metastasis. Cell. 2004;117(7):927–939. doi: 10.1016/j.cell.2004.06.006. [DOI] [PubMed] [Google Scholar]
- 24.Mani SA, et al. The epithelial-mesenchymal transition generates cells with properties of stem cells. Cell. 2008;133(4):704–715. doi: 10.1016/j.cell.2008.03.027. [DOI] [PMC free article] [PubMed] [Google Scholar]
- 25.Tsuji T, et al. Epithelial-mesenchymal transition induced by growth suppressor p12CDK2-AP1 promotes tumor cell local invasion but suppresses distant colony growth. Cancer Res. 2008;68(24):10377–10386. doi: 10.1158/0008-5472.CAN-08-1444. [DOI] [PMC free article] [PubMed] [Google Scholar]
- 26.Tsuji T, Ibaragi S, Hu GF. Epithelial-mesenchymal transition and cell cooperativity in metastasis. Cancer Res. 2009;69(18):7135–7139. doi: 10.1158/0008-5472.CAN-09-1618. [DOI] [PMC free article] [PubMed] [Google Scholar]
- 27.Hermann PC, et al. Distinct populations of cancer stem cells determine tumor growth and metastatic activity in human pancreatic cancer. Cell Stem Cell. 2007;1(3):313–323. doi: 10.1016/j.stem.2007.06.002. [DOI] [PubMed] [Google Scholar]
- 28.Korpal M, et al. Direct targeting of Sec23a by miR-200s influences cancer cell secretome and promotes metastatic colonization. Nat Med. 2011;17(9):1101–1108. doi: 10.1038/nm.2401. [DOI] [PMC free article] [PubMed] [Google Scholar]
- 29.El Hilali N, Rubio N, Martinez-Villacampa M, Blanco J. Combined noninvasive imaging and luminometric quantification of luciferase-labeled human prostate tumors and metastases. Lab Invest. 2002;82(11):1563–1571. doi: 10.1097/01.lab.0000036877.36379.1f. [DOI] [PubMed] [Google Scholar]
- 30.Kozlowski JM, Fidler IJ, Campbell D, Xu ZL, Kaighn ME, Hart IR. Metastatic behavior of human tumor cell lines grown in the nude mouse. Cancer Res. 1984;44(8):3522–3529. [PubMed] [Google Scholar]
- 31.Takahashi K, Okita K, Nakagawa M, Yamanaka S. Induction of pluripotent stem cells from fibroblast cultures. Nat Protoc. 2007;2(12):3081–3089. doi: 10.1038/nprot.2007.418. [DOI] [PubMed] [Google Scholar]
- 32.Wernig M, et al. In vitro reprogramming of fibroblasts into a pluripotent ES-cell-like state. Nature. 2007;448(7151):318–324. doi: 10.1038/nature05944. [DOI] [PubMed] [Google Scholar]
- 33.Kim J, et al. A Myc network accounts for similarities between embryonic stem and cancer cell transcription programs. Cell. 2010;143(2):313–324. doi: 10.1016/j.cell.2010.09.010. [DOI] [PMC free article] [PubMed] [Google Scholar]
- 34.Coppe JP, et al. Senescence-associated secretory phenotypes reveal cell-nonautonomous functions of oncogenic RAS and the p53 tumor suppressor. PLoS Biol. 2008;6(12):2853–2868. doi: 10.1371/journal.pbio.0060301. [DOI] [PMC free article] [PubMed] [Google Scholar]
- 35.Kuilman T, Peeper DS. Senescence-messaging secretome: SMS-ing cellular stress. Nat Rev Cancer. 2009;9(2):81–94. doi: 10.1038/nrc2560. [DOI] [PubMed] [Google Scholar]
- 36.Chaffer CL, Brennan JP, Slavin JL, Blick T, Thompson EW, Williams ED. Mesenchymal-to-epithelial transition facilitates bladder cancer metastasis: role of fibroblast growth factor receptor-2. Cancer Res. 2006;66(23):11271–11278. doi: 10.1158/0008-5472.CAN-06-2044. [DOI] [PubMed] [Google Scholar]
- 37.Chaffer CL, et al. Upregulated MT1-MMP/TIMP-2 axis in the TSU-Pr1-B1/B2 model of metastatic progression in transitional cell carcinoma of the bladder. Clin Exp Metastasis. 2005;22(2):115–125. doi: 10.1007/s10585-005-5141-3. [DOI] [PubMed] [Google Scholar]
- 38.Hurt EM, Kawasaki BT, Klarmann GJ, Thomas SB, Farrar WL. CD44+ CD24(-) prostate cells are early cancer progenitor/stem cells that provide a model for patients with poor prognosis. Br J Cancer. 2008;98(4):756–765. doi: 10.1038/sj.bjc.6604242. [DOI] [PMC free article] [PubMed] [Google Scholar]
- 39.Shipitsin M, et al. Molecular definition of breast tumor heterogeneity. Cancer Cell. 2007;11(3):259–273. doi: 10.1016/j.ccr.2007.01.013. [DOI] [PubMed] [Google Scholar]
- 40.Li C, et al. Identification of pancreatic cancer stem cells. Cancer Res. 2007;67(3):1030–1037. doi: 10.1158/0008-5472.CAN-06-2030. [DOI] [PubMed] [Google Scholar]
- 41.Yeung TM, Gandhi SC, Wilding JL, Muschel R, Bodmer WF. Cancer stem cells from colorectal cancer-derived cell lines. Proc Natl Acad Sci U S A. 2010;107(8):3722–3727. doi: 10.1073/pnas.0915135107. [DOI] [PMC free article] [PubMed] [Google Scholar]
- 42.Tani H, Morris RJ, Kaur P. Enrichment for murine keratinocyte stem cells based on cell surface phenotype. Proc Natl Acad Sci U S A. 2000;97(20):10960–10965. doi: 10.1073/pnas.97.20.10960. [DOI] [PMC free article] [PubMed] [Google Scholar]
- 43.Peiro S, et al. Snail1 transcriptional repressor binds to its own promoter and controls its expression. Nucleic Acids Res. 2006;34(7):2077–2084. doi: 10.1093/nar/gkl141. [DOI] [PMC free article] [PubMed] [Google Scholar]
- 44.Kopp H-G, Avecilla ST, Hooper AT, Rafii S. The bone marrow vascular niche: home of HSC differentiation and mobilization. Physiology (Bethesda). 2005;20:349–356. doi: 10.1152/physiol.00025.2005. [DOI] [PubMed] [Google Scholar]
- 45.Taylor BS, et al. Integrative genomic profiling of human prostate cancer. Cancer Cell. 2010;18(1):11–22. doi: 10.1016/j.ccr.2010.05.026. [DOI] [PMC free article] [PubMed] [Google Scholar]
- 46.Jeschke U, et al. Expression of E-cadherin in human ductal breast cancer carcinoma in situ, invasive carcinomas, their lymph node metastases, their distant metastases, carcinomas with recurrence and in recurrence. Anticancer Res. 2007;27(4A):1969–1974. [PubMed] [Google Scholar]
- 47.Park D, Karesen R, Axcrona U, Noren T, Sauer T. Expression pattern of adhesion molecules (E-cadherin, alpha-, beta-, gamma-catenin and claudin-7), their influence on survival in primary breast carcinoma, and their corresponding axillary lymph node metastasis. APMIS. 2007;115(1):52–65. doi: 10.1111/j.1600-0463.2007.apm_524.x. [DOI] [PubMed] [Google Scholar]
- 48.Kalluri R, Weinberg RA. The basics of epithelial-mesenchymal transition. J Clin Invest. 2009;119(6):1420–1428. doi: 10.1172/JCI39104. [DOI] [PMC free article] [PubMed] [Google Scholar]
- 49.Li R, et al. A mesenchymal-to-epithelial transition initiates and is required for the nuclear reprogramming of mouse fibroblasts. Cell Stem Cell. 2010;7(1):51–63. doi: 10.1016/j.stem.2010.04.014. [DOI] [PubMed] [Google Scholar]
- 50.Polo JM, Hochedlinger K. When fibroblasts MET iPSCs. Cell Stem Cell. 2010;7(1):5–6. doi: 10.1016/j.stem.2010.05.018. [DOI] [PubMed] [Google Scholar]
- 51.Samavarchi-Tehrani P, et al. Functional genomics reveals a BMP-driven mesenchymal-to-epithelial transition in the initiation of somatic cell reprogramming. Cell Stem Cell. 2010;7(1):64–77. doi: 10.1016/j.stem.2010.04.015. [DOI] [PubMed] [Google Scholar]
- 52.Lowry WE. E-cadherin, a new mixer in the Yamanaka cocktail. EMBO Rep. 2011;12(7):613–614. doi: 10.1038/embor.2011.117. [DOI] [PMC free article] [PubMed] [Google Scholar]
- 53.Redmer T, Diecke S, Grigoryan T, Quiroga-Negreira A, Birchmeier W, Besser D. E-cadherin is crucial for embryonic stem cell pluripotency and can replace OCT4 during somatic cell reprogramming. EMBO Rep. 2011;12(7):720–726. doi: 10.1038/embor.2011.88. [DOI] [PMC free article] [PubMed] [Google Scholar]
- 54.Nieto MA, Sargent MG, Wilkinson DG, Cooke J. Control of cell behavior during vertebrate development by Slug, a zinc finger gene. Science. 1994;264(5160):835–839. doi: 10.1126/science.7513443. [DOI] [PubMed] [Google Scholar]
- 55.Sauka-Spengler T, Bronner-Fraser M. A gene regulatory network orchestrates neural crest formation. Nat Rev Mol Cell Biol. 2008;9(7):557–568. doi: 10.1038/nrm2428. [DOI] [PubMed] [Google Scholar]
- 56.Liu J, et al. Slug inhibits proliferation of human prostate cancer cells via downregulation of cyclin D1 expression. Prostate. 2010;70(16):1768–1777. doi: 10.1002/pros.21213. [DOI] [PMC free article] [PubMed] [Google Scholar]
- 57.Vega S, Morales AV, Ocana OH, Valdes F, Fabregat I, Nieto MA. Snail blocks the cell cycle and confers resistance to cell death. Genes Dev. 2004;18(10):1131–1143. doi: 10.1101/gad.294104. [DOI] [PMC free article] [PubMed] [Google Scholar]
- 58.Dykxhoorn DM, et al. miR-200 enhances mouse breast cancer cell colonization to form distant metastases. PLoS One. 2009;4(9):e7181. doi: 10.1371/journal.pone.0007181. [DOI] [PMC free article] [PubMed] [Google Scholar]
- 59.Lou Y, et al. Epithelial-mesenchymal transition (EMT) is not sufficient for spontaneous murine breast cancer metastasis. Dev Dyn. 2008;237(10):2755–2768. doi: 10.1002/dvdy.21658. [DOI] [PubMed] [Google Scholar]
- 60.Olmeda D, Moreno-Bueno G, Flores JM, Fabra A, Portillo F, Cano A. SNAI1 is required for tumor growth and lymph node metastasis of human breast carcinoma MDA-MB-231 cells. Cancer Res. 2007;67(24):11721–11731. doi: 10.1158/0008-5472.CAN-07-2318. [DOI] [PubMed] [Google Scholar]
- 61.Ke XS, et al. Epithelial to mesenchymal transition of a primary prostate cell line with switches of cell adhesion modules but without malignant transformation. PLoS One. 2008;3(10):e3368. doi: 10.1371/journal.pone.0003368. [DOI] [PMC free article] [PubMed] [Google Scholar]
- 62.Kaighn ME, Narayan KS, Ohnuki Y, Lechner JF, Jones LW. Establishment and characterization of a human prostatic carcinoma cell line (PC-3). Invest Urol. 1979;17(1):16–23. [PubMed] [Google Scholar]
Associated Data
This section collects any data citations, data availability statements, or supplementary materials included in this article.


