

Background: The soybean genome encodes the most expanded plant heterotrimeric G-protein network reported to date.
Results: Each Gα has distinct biochemical properties, and the RGS proteins have different GTPase-activating effects on each Gα.
Conclusion: The core G-protein components, their interactions, and biochemical properties are conserved across phyla, but important mechanistic differences exist.
Significance: This study provides insight into the complexity of plant G-protein networks.
Keywords: G-proteins, GTPase, Heterotrimeric G-proteins, Protein-Protein Interactions, RGS Proteins, Signal Transduction, GAP Activity, GTP Binding, Soybean
Abstract
Heterotrimeric G-proteins and the regulator of G-protein signaling (RGS) proteins, which accelerate the inherent GTPase activity of Gα proteins, are common in animals and encoded by large gene families; however, in plants G-protein signaling is thought to be more limited in scope. For example, Arabidopsis thaliana contains one Gα, one Gβ, three Gγ, and one RGS protein. Recent examination of the Glycine max (soybean) genome reveals a larger set of G-protein-related genes and raises the possibility of more intricate G-protein networks than previously observed in plants. Stopped-flow analysis of GTP-binding and GDP/GTP exchange for the four soybean Gα proteins (GmGα1–4) reveals differences in their kinetic properties. The soybean genome encodes two chimeric RGS proteins with an N-terminal seven transmembrane domain and a C-terminal RGS box. Both GmRGS interact with each of the four GmGα and regulate their GTPase activity. The GTPase-accelerating activities of GmRGS1 and -2 differ for each GmGα, suggesting more than one possible rate of the G-protein cycle initiated by each of the Gα proteins. The differential effects of GmRGS1 and GmRGS2 on GmGα1–4 result from a single valine versus alanine difference. The emerging picture suggests complex regulation of the G-protein cycle in soybean and in other plants with expanded G-protein networks.
Introduction
Heterotrimeric G-proteins are important signal transducers in all eukaryotes. Signal transduction by G-proteins depends on the guanine nucleotide-bound status of the Gα protein that switches between GDP·Gα and GTP·Gα to represent “off” and “on” signaling modes, respectively (1, 2). This classic system entails three biochemically distinct steps that control all physiological responses regulated by G-proteins: the rate of GTP binding, the rate of GTP hydrolysis, and the rate of GDP/GTP exchange. The biochemical properties of the G-protein cycle necessitate precise regulation of each step. In mammalian systems, networks of regulatory proteins provides exquisite control of the G-protein cycle (3). The human genome, for example, encodes over 1,000 G-protein-coupled receptors (GPCR).5 The GPCR act as specific guanine nucleotide exchange factors for different Gα proteins to promote GDP/GTP exchange (4), which is the rate-limiting step of the G-protein signaling cycle (5, 6). The rate of GTP hydrolysis in Gα proteins is enhanced by regulator of G-protein signaling (RGS) proteins (3, 4, 7), which act as GTPase-activating proteins (GAPs) to promote continuous G-protein cycling, thereby accelerating both signal onset and decay.
In plants, understanding the heterotrimeric G-protein signaling mechanisms is still in its infancy, with most data coming from Arabidopsis and rice. Both of these plants possess a limited repertoire of heterotrimeric G-proteins with one Gα, one Gβ, and three Gγ subunits, whereas the human genome encodes for 23 Gα, 5 Gβ, and 12 Gγ subunits (8–10). Likewise, there is a single RGS protein in Arabidopsis but 37 in humans (8, 11). The rice genome does not encode any obvious candidate for an RGS protein (9, 12). Despite their limited quantities, plant G-proteins are involved in multiple signaling pathways controlling various aspects of growth and development (12–21).
We have recently identified an elaborate G-protein family in soybean that has greatly expanded the diversity and complexity of plant G-protein networks. The soybean genome encodes four Gα, four Gβ, and ten Gγ subunits, suggesting more than a hundred possible heterotrimeric combinations compared with three in Arabidopsis (10, 22, 23). Moreover, the expression patterns and interaction specificity of G-protein subunits suggest the formation of tissue- and signal-specific heterotrimers in soybean, as reported in mammals (24–27).
Detailed biochemical characterization of the different steps of G-protein cycling in plants is currently limited to the Arabidopsis Gα protein AtGPA1 and its regulatory RGS protein AtRGS1 (11, 28–30). AtGPA1 is an extremely slow GTPase with significantly high rates of GTP binding and GDP release and is proposed to exist almost entirely in the GTP-bound conformation. Based on these observations, GTP hydrolysis by AtGPA1 is proposed as the rate-limiting step of the Arabidopsis G-protein signaling cycle (28, 31), in contrast to the GDP/GTP exchange of Gα proteins in mammalian G-protein signaling (2, 4).
Initial biochemical analysis of GmGα1–4 predicted important kinetic differences among them. For example, group II GmGα proteins (GmGα2 and GmGα3) exhibited a faster rate of GTP -hydrolysis than group I GmGα proteins (GmGα1 and GmGα4) and AtGPA1 (23). This study was designed to compare the GTP-binding rates and GDP/GTP exchange rates of GmGα1–4 and to examine the role of two soybean RGS proteins (GmRGS1 and GmRGS2) on the intrinsic GTPase activity of the GmGα proteins. Our data show that each GmGα protein has a distinct rate of GTP binding and GTPase activity. The two GmRGS proteins exert differential GAP activities on each of the GmGα proteins, and the difference in their GAP activity results from a single valine versus alanine alteration. These results suggest a complex regulation of the G-protein cycle in soybean and, by extension, in other plants with expanded G-protein networks.
EXPERIMENTAL PROCEDURES
Plant Material and Growth Conditions
Soybean (Glycine max L.) cv. Jack seeds were grown in a growth chamber (26/20 °C day/night temperature, photoperiod of 14/10 h, 800 μmol m−2 s−1 light intensity, and 60% humidity). Tissue samples for different stages were prepared as described previously (23).
Cloning of Soybean RGS Protein Genes and Recombinant Protein Purification
Soybean RGS protein genes were identified by BLAST analysis of the latest G. max genome assembly using Arabidopsis and mammalian RGS protein sequences as queries. Full-length GmRGS genes were amplified from soybean seedling cDNA using gene-specific primers (supplemental Table S1), cloned into the pENTR/d-TOPO vector (Invitrogen), and confirmed by sequencing. The RGS domains of GmRGS1 and GmRGS2 (amino acids 251–464) were cloned into pET-28a (Novagen, WI) and transformed into E. coli Rosetta cells (Novagen). Recombinant proteins were purified using Ni2+-affinity chromatography (32). Protein aliquots were snap-frozen in liquid nitrogen and stored at −80 °C. Mutant GmRGS constructs were prepared by site-directed mutagenesis using the QuikChange PCR method (Agilent). Protein expression and purification were as for the wild-type GmRGS. The four GmGα proteins were purified as described previously (23).
RNA Isolation and Quantitative RT-PCR
RNA isolation and quantitative real time PCR were performed as described previously (23). The oligonucleotides used for PCR are listed in supplemental Table S1. Experiments were repeated three times, and data were averaged.
Protein-Protein Interaction Assays
The interaction assay between GmGα and GmRGS was performed using the mating-based yeast split-ubiquitin system (33). Briefly, full-length GmRGS1–2 genes were fused with the C-terminal half of ubiquitin (CUb fusions) and the GmGα1–4 genes were fused with the N-terminal half of ubiquitin (NUb fusions). NUb fusions with each GmGα were created in both N- and C-terminal orientations (i.e. GmGα-NUb and NUb-GmGα). NUbwt fusion constructs, which exhibit intrinsic interaction with CUb fusion constructs, were used as positive controls. Yeast transformations and mating were performed as in Bisht et al. (23). For the split-ubiquitin interaction assays, yeast were grown on minimal media lacking leucine, tryptophan, histidine, and adenine, in the presence of 1 mm methionine. For in planta interactions, the GmGα1–4 genes were cloned into 77 nEYFP-N1 vectors (containing nEYFP at the C-terminal end; see Ref. 34), and the GmRGS1–2 genes were cloned into 78 cEYFP-N1 vectors (containing cEYFP at the C-terminal end; Ref. 34). All constructs were transformed into Agrobacterium tumefaciens strain GV3101, resuspended in AS medium (10 mm MgCl2, 150 μm acetosyringone and 10 mm MES, pH 5.7) to A600 = 0.8, and co-infiltrated in the abaxial side of tobacco leaves. The leaves were imaged 36 h post-infiltration with the Nikon Eclipse E800 microscope with epi-fluorescence module for YFP fluorescence detection. At least four independent transformations were performed for each construct. Localization of GmRGS-YFP was performed as described previously (22).
G-protein and RGS Protein Activity Assay
The kinetics of GTP-binding and GTP/GDP exchange were determined by stopped-flow analysis using an Olis DM45 spectrofluorimeter with a 150-watt xenon lamp and stopped-flow accessory. Fluorescence resonance energy transfer (FRET) signal between tryptophan and the 2′-/3′-O-N′-methylanthraniloyl) (MANT) group (from either MANT-GTP or MANT-GDP, λex = 280 nm with a cutoff filter >420 nm) was followed to measure the rate of GTP-binding exchange and GDP/GTP exchange. Assays were performed at 20 °C in 20 mm Tris, pH 8.0, 100 mm NaCl, and 10 mm MgCl2. An average of 8–11 scans were collected for each condition and normalized. KintekGlobal Kinetic Explorer version 2.5 (35) was used to fit the binding data using a model describing binding followed by a conformational change. Exchange of MANT-GDP with GTP was fit to a single exponential curve.
Real time fluorescence-based GTP binding and GTP hydrolysis assays were performed using BODIPY-GTP FL (36). Assays were performed at 25 °C in a 200-μl reaction volume of assay buffer (20 mm Tris, pH 8.0, and 10 mm MgCl2). The reaction was started by addition of labeled nucleotide. For each assay, 250 nm of GmGα protein was used. To evaluate the GAP activity of each GmRGS, 500 nm of protein was incubated with GmGα, and fluorescence (λex = 485 nm, λem = 530 nm) was recorded every 16 s for up to 54 min using a fluorescence microplate reader (FLUOstar Optima, BMG Lab Technologies).
GAP activity of GmRGS1 and GmRGS2 was also assayed using the ENZchek phosphate assay kit (Invitrogen). Each GmGα (5 μm) was pre-loaded with GTP (1 mm) and incubated with 0.1–2 μm of GmRGS. Phosphate (Pi) production was recorded as a change in absorbance at 360 nm using a Spectramax M2 spectrophotometer (Molecular Devices, Sunnyvale, CA) for up to 30 min at 25 °C. The amount of Pi released was evaluated from the corresponding values obtained with a standard curve. Data were plotted as nanomoles of Pi released min−1 mg−1 of GmRGS and fit using nonlinear regression in GraphPad Prism version 5.0.
RESULTS
Analysis of GTP Binding and GTP/GDP Exchange in GmGα1–4
Initial BODIPY-fluorescence assays suggested that GmGα1–4 may have different GTP binding, hydrolysis, and/or exchange kinetics (23). To further examine the properties of each GmGα, the rate of GTP binding and GDP release were determined using MANT-GTP and MANT-GDP analogs, respectively, in a stopped-flow assay system.
For GTP binding, 1 μm of each GmGα protein was examined with varied concentrations of MANT-GTP (Fig. 1A). The rate constants (kon) derived from the data (Table 1) indicate that GmGα1 and GmGα4 bind GTP more rapidly than GmGα2 and GmGα3. In addition, the GTP-binding rates of all four GmGα proteins are faster than AtGPA1 (kon = 1.1 ± 0.1), which is also 2 orders of magnitude faster than mammalian G-proteins (28).
FIGURE 1.

GmGα have distinct rates of GTP binding and GDP/GTP exchange. A, kinetics of GTP binding of GmGα3. GmGα3 (1 μm) was incubated with 1–10 μm of MANT-GTP, and FRET signal between tryptophan (λex = 280 nm) was measured using an Olis DM45 spectrofluorimeter with stopped-flow accessory. Similar data were obtained for other GmGα (not shown). Data were fit using KintekGlobal Kinetic Explorer using a model for binding followed by a conformational change. B, comparison of GDP/GTP exchange kinetics of GmGα3 and GmGα4. GmGα (1 μm) was pre-loaded with 5 μm MANT-GDP. Unlabeled GTP (160 μm) was then shot into the reaction, and the rate of GTP/GDP exchange was followed by measuring the change in fluorescence due to FRET signal between tryptophan and MANT versus time. Curves for GmGα1 and GmGα2 overlapped with GmGα4 and are not shown for clarity. Exchange of MANT-GDP with GTP was fit to a single exponential curve.
TABLE 1.
Comparative kinetics of GmGα proteins
All values are expressed as a mean ± S.E. (n = 3).
| Proteins | MANT-GTP binding kon | MANT-GDP dissociation koff |
|---|---|---|
| μm−1min−1 | min−1 | |
| GmGα1 | 4.0 ± 0.1 | 41.0 ± 0.5 |
| GmGα2 | 2.8 ± 0.4 | 28.9 ± 0.4 |
| GmGα3 | 2.2 ± 0.1 | 8.6 ± 0.1 |
| GmGα4 | 8.0 ± 2.3 | 32.9 ± 0.2 |
To assess the rate of GDP release from GmGα, 1 μm of each of the proteins was preincubated with 5 μm MANT-GDP. An excess (160 μm) of unlabeled GTP was then used to start the reaction, and the GTP/GDP exchange rate was determined. Fig. 1B shows the kinetics of MANT-GDP/GTP exchange for GmGα3 and GmGα4. GmGα3 exhibits a lower rate of GDP/GTP exchange compared with GmGα4. The reactions for GmGα1 and GmGα2 essentially overlap with that of GmGα4 and are not shown for the sake of clarity. Table 1 summarizes the comparative rates of MANT-GTP binding and MANT-GDP/GTP exchange for GmGα1–4.
For GmGα1–4, the GTP hydrolysis rate of each protein in the absence of an RGS protein was very slow, and only approximate values derived from the single turnover reactions were determined (supplemental Table S2). The kcat value for GmGα2 was 0.055 min−1, which was similar to the rate of AtGPA1 GTPase activity (0.063 min−1) reported previously (28, 31). This extremely slow rate of GTP hydrolysis of GmGα proteins together with the rate of nonenzymatic GTP hydrolysis made it difficult to compare the small quantitative differences between GmGα proteins and to evaluate Km values.
Soybean Genome Encodes Two Chimeric Proteins with RGS Domains
In most organisms, the expansion and diversity of Gα proteins correlate with the expansion and diversity of RGS proteins (37). The only exception known to date is rice, which contains a Gα protein and lacks an RGS protein (12). To determine whether RGS proteins are as prevalent in plants as they are in animals, and whether genome duplication led to an expansion of RGS proteins in soybean similar to that reported for the Gα proteins (23), we queried the soybean data base using Arabidopsis and animal RGS protein sequences.
Genome analysis identified one or more homologs of AtRGS1 in all dicot plants but none in monocot plants (with the exception of Setaria italica, see supplemental Fig. S1). The soybean genome has two loci (Glyma18g01490.1 and Glyma11g37540.1) with 64% sequence identity to AtRGS1 (11). These are renamed GmRGS1 and GmRGS2, respectively. The GmRGS1 gene is mis-annotated in the current version of the soybean genome with a predicted protein lacking the first exon as identified here. Discrepancies between the reported and experimentally validated sequence of the GmRGS2 gene were also identified. The correct sequences of both these genes and their exon-intron boundaries are detailed in supplemental Figs. S2 and S3.
GmRGS1 and GmRGS2 each encode open reading frames of 464 amino acids that share 96% identity, which suggests their origin from a recent genome duplication event (38). This was corroborated by the analysis of their chromosomal location and exon-intron architecture. Both genes contain 11 exons and 10 introns with highly conserved exon lengths (Fig. 2A) and are present on the duplicated regions of the chromosomes.
FIGURE 2.

Sequence features and localization of GmRGS proteins. A, exon/intron organization of GmRGS genes. Black boxes represent exons and triangles represent introns. The numbers at the bottom and top represent exon and intron lengths, respectively. B, most plant RGS proteins are chimeric proteins with N-terminal 7TM domain and C-terminal RGS domain. Amino acid sequence alignment of Arabidopsis, soybean, S. italica, Selaginella moellendorffii, and Ectocarpus siliculosus RGS proteins was performed using Clustal W. The position of the seven transmembrane domains was determined by TMHMM server, version 2.0. The predicted domains are marked with horizontal lines on the top and are numbered TM I to TM VII. The nine α-helices of the RGS domains are represented and marked with I to IX. ▾ represents the conserved Glu-319 crucial for RGS protein activity and binding with Gα proteins, and the star represents amino acid identified in this study as responsible for slow activity of GmRGS1. The amino acid positions are numbered in accordance with GmRGS1. C, YFP-GmRGS is localized to the cell periphery in transiently transformed tobacco leaves. At least three independent transformations were performed. The figure shows representative picture from each transformation.
The GmRGS proteins share both common sequence features and cellular localization with AtRGS1. Both GmRGS proteins display a chimeric architecture with an N-terminal 7-transmembrane (7TM) domain (amino acids 15–252), as found in classic GPCRs, and a C-terminal RGS box (amino acids 294–412) (Fig. 2B). The RGS box of each GmRGS contains nine predicted α-helical regions typical of all RGS proteins (Fig. 2B). The predicted secondary structure of each GmRGS C-terminal domain aligns with mammalian homologs as determined by I-TASSER (39). None of the mammalian RGS box-containing proteins have a 7TM GPCR-like domain associated with them, although such domains have been identified in some protozoan and many fungal RGS proteins (37). Intriguingly, the sole representative of a monocot plant RGS protein from S. italica lacks the N-terminal 7TM domain (Fig. 2B). Both GmRGS proteins also contain two cysteine residues (i.e. Cys-83 and Cys-153) that may form a disulfide linkage found in many GPCRs (11). In addition, both GmRGS localized to the cell periphery (Fig. 2C), which is similar to the localization of AtRGS1 (11).
GmRGS Proteins Have Overlapping Expression Patterns with Gα Proteins
Previous work reported the expression patterns of GmGα1–4 in different tissues of soybean and at various growth and development phases (23). Because RGS proteins work with Gα proteins to regulate G-protein signaling, the degree of overlap between the expression of specific GmGα and GmRGS genes was evaluated using real time quantitative PCR.
Similar to the expression of GmGα genes, the two GmRGS genes are expressed widely in most organs and tissue types (Fig. 3A). Moreover, both GmRGS genes were expressed at a very high level in the first trifoliate leaf, which is similar to the expression pattern of GmGα4 (23).
FIGURE 3.

GmRGS genes have distinct expression patterns. A, expression of GmRGS genes in different tissue types. The stages are defined as follows: VC, cotyledon; V1-R, primary root at stage V1 (appearance of the first set of unfolded trifoliolate leaves); V1-S, primary stem at stage V1; V1-TF, first trifoliate leaf; Vn-R, mature root; Vn-S, mature stem; Vn-L, mature leaves; Apex, shoot apex; Vn-F, flower; S4, seed stage S4. Expression in V1-R roots was set at 1. B, expression of GmRGS genes in nodules and hairy roots. Expression in mature roots (Vn-R) is set at 1. C, expression of GmRGS genes during different stages of seed development. The seed development stages (S1–S8) are according to Ref. 41. Dry seed (DS) stage was also used for the analysis. The expression in seeds at S1 was set at 1. D, expression of GmRGS genes during seed germination. Seed germination was followed starting from dry seeds (0 h) up to 30 h when an obvious radical had protruded. Seed samples were collected at every 6 h following imbibition of dry seeds. The expression in dry seeds at 0 h was set at 1. For each data set quantitative RT-PCR amplification experiments were performed three times independently for each target, and the data were averaged. The expression values were normalized against soybean Actin gene expression. Error bars represent the mean ± S.E.
The role of the G-protein during nodulation has been analyzed in legumes (40), and two of the soybean Gα genes (i.e. GmGα1 and GmGα3) are expressed at a very high level in nodules compared with non-nodulating roots (23). Our results show that both GmRGS genes have 12–15-fold higher expression in nodules compared with non-nodulating mature roots (Fig. 3B). The expression analysis suggests potential isoform- specific roles for GmGα1 and GmGα3 in nodulation.
The four GmGα genes also exhibited interesting expression profiles during seed development and seed germination (23). Given the role of G-proteins during seed germination in Arabidopsis and rice and the importance of soybean seeds as food and feed, we compared the expression patterns of the two GmRGS genes during seed development and germination. During seed development (defined here as stages S1–S8; see Ref. 41), the GmRGS1 transcript level remained relatively constant through S7, followed by a greater than 10-fold increase at S8 and in dry seeds (Fig. 3C). Conversely, expression of GmRGS2 during seed development did not change. The expression profile of GmRGS1 correlates with that of the group II GmGα (Gα2 and Gα3), whereas GmRGS2 expression corresponds to expression of the group I GmGα (Gα1 and Gα4).
Expression of GmRGS1 and GmRGS2 genes was also analyzed during soybean seed germination. Previous work showed that all four GmGα genes are expressed at significantly higher levels up to 12 h post-imbibition, followed by a gradual decrease (23). The expression of GmRGS1 and GmRGS2 genes, however, showed an overall decrease following imbibition (Fig. 3D).
GmRGS Proteins Interact with GmGα Proteins
Computer modeling studies suggest that amino acids crucial for RGS1 and Gα interaction are conserved between mammalian and plant homologs (28). AtGPA1 interacts with full-length AtRGS1, as well as the RGS domain of the same protein (11, 28). In non-plant systems, where multiple Gα and RGS proteins exist in a single organism, a high degree of interaction specificity occurs between particular Gα and RGS proteins (42, 43).
To assess interaction between GmGα and GmRGS proteins, the eight possible interaction combinations (four GmGα × two RGS proteins) were tested using the membrane-based split ubiquitin system (33). For this experiment, GmRGS1 and GmRGS2 were used as bait proteins (CUb fusions) and GmGα1–4 as prey proteins (NUb fusions). NUb fusions with GmGα proteins were made in both orientations, NUb-GmGα and GmGα-NUb, resulting in 16 different test interactions. Each GmRGS interacts with all four GmGα proteins, in at least one orientation (Fig. 4A). To confirm the yeast-based interaction data, bimolecular fluorescence complementation was used in planta to test for interaction between the two protein combinations (34). Each GmGα was cloned as an N-terminal fusion to the C terminus of YFP (Gα-cYFP). Each GmRGS was cloned as an N-terminal fusion to the N terminus of YFP (RGS-nYFP). Interactions were examined by co-infiltrating specific RGS and Gα combinations and looking for reconstitution of YFP fluorescence in the infiltrated tobacco leaves. YFP fluorescence was observed in all eight possible combinations confirming that both GmRGS can interact with each GmGα in vivo (Fig. 4B).
FIGURE 4.

GmRGS proteins interact with GmGα proteins. A, interaction between GmRGS and GmGα proteins using split ubiquitin-based interaction assay. The picture shows yeast growth on selective media with 1 mm methionine. In all cases, GmGα proteins were used as NUb fusions in both orientations (NUb-GmGα denoting NUb fused to the N terminus of GmGα and GmGα-NUb denoting NUb fused to the C terminus of GmGα) and RGS proteins as CUb fusions. NUbwt fusion constructs were used as positive controls for interaction, and NUb vectors were used as negative controls. Two biological replicates of the experiment were performed with identical results. B, interaction between GmRGS (in 77-nEYFP-N1) and GmGα (in 78-cEYFP-N1) proteins using bimolecular complementation assay. Agrobacteria containing different combinations of GmRGS and GmGα were infiltrated in tobacco leaves, and reconstitution of YFP fluorescence due to protein-protein interaction was visualized with a microscope (34). At least four independent infiltrations were performed for each protein combination with similar results.
RGS Proteins Act as GAPs for the GmGα
To establish that GmRGS interact with GmGα and function as GAPs, we assayed their effect on the GTPase activity of GmGα1–4. Full-length cDNAs corresponding to GmGα1–4 and the RGS domain of GmRGS1–2 (amino acids 251–464) were expressed as recombinant proteins in E. coli and purified by Ni2+-affinity chromatography. Each protein was purified to greater than 95% purity (Fig. 5A).
FIGURE 5.

GmRGS act as GAPs for GmGα. A, SDS-PAGE analysis of purified recombinant GmGα1–4 and RGS domains (amino acids 251–464) of GmRGS1 and GmRGS2. B–E, effect of GmRGS1 and GmRGS2 on GTPase activity of GmGα1 (B), GmGα2 (C), GmGα3 (D), and GmGα4 (E). GTP hydrolysis was measured by using GTP-BODIPY-FL in real time fluorescence assays. Data are one of two independent experiments, each with three replicates, mean ± S.D.
Fluorescence-based real time assays were performed to evaluate the effect of each GmRGS on the GTPase activity of each GmGα using BODIPY-GTP. In this assay, the slope of the curve denotes GTPase activity (Fig. 5, B–E). As reported previously, the group I GmGα were slower GTPases than the group II GmGα (23). Both GmRGS1 and GmRGS2 accelerated the GTPase activity of each GmGα, as evident by the steeper slopes for GTP hydrolysis (Fig. 5, B–E). Interestingly, the GTPase activity of all four GmGα was appreciably higher in the presence of GmRGS2 than GmRGS1 (Fig. 5, B–E), suggesting GmRGS2 as a more active GAP than GmRGS1.
BODIPY-based assays record the overall fluorescence emission resulting from simultaneous GTP binding and GTP hydrolysis and therefore at best provide initial information but not accurate estimation of the rates. To measure the distinct activities of the GmGα proteins and the steady-state GAP activity of the GmRGS, an assay that allowed for quantification of Pi release was used. These assays confirmed the results obtained in the BODIPY-based fluorescence assay that GmRGS2 was more active than GmRGS1 (Fig. 6 and Table 2). Furthermore, the rate of Pi released from the group II GmGα was faster than the group I GmGα in the presence of both GmRGS1 and GmRGS2 (Table 2). GmGα1 and GmGα3 have similar EC50 values for both GmRGS1 and GmRGS2, whereas GmGα2 and GmGα4 have ∼3-fold higher EC50 for GmRGS1 than GmRGS2.
FIGURE 6.

GmRGS1 and GmRGS2 have distinct GAP activities on different GmGα. A, rate of Pi release due to the GTPase activity of different GmGα in the presence of varying concentrations of GmRGS1. B, rate of Pi release from different GmGα in the presence of varying concentrations of GmRGS2. Experiments were repeated three times, and data were averaged. Error bars represent the mean ± S.E. Data were fit using GraphPad Prism version 5.0.
TABLE 2.
Kinetics of phosphate (Pi) release from GmGα1–4 in the presence of GmRGS1 and GmRGS2
All values are expressed as a mean ± S.E. (n = 3).
| Proteins | GmRGS1 |
GmRGS2 |
||
|---|---|---|---|---|
| Vmax | EC50 | Vmax | EC50 | |
| nmol min−1mg−1 | μm | nmol min−1mg−1 | μm | |
| GmGα1 | 2.1 ± 0.2 | 0.4 ± 0.1 | 9.5 ± 0.6 | 0.4 ± 0.1 |
| GmGα2 | 11.6 ± 1.4 | 1.2 ± 0.3 | 21.7 ± 1.3 | 0.5 ± 0.1 |
| GmGα3 | 7.2 ± 0.8 | 1.8 ± 0.3 | 27.7 ± 5.7 | 1.8 ± 0.7 |
| GmGα4 | 3.4 ± 1. 7 | 2.3 ± 1.7 | 11.9 ± 1.1 | 0.7 ± 0.2 |
A glutamate at position 320 of AtRGS1 is crucial for GAP activity and its interaction with AtGPA1 (28). This residue is conserved in both GmRGS1 and GmRGS2 proteins (Glu319; Fig. 2B). To test the role of this residue in GmRGS, the E319K, E319Q, and E319A variants of GmRGS2 were generated. Using GmGα1 and GmGα2 as representatives of the group I and group II enzymes, the effect of GmRGS2 mutants on Pi release was examined (Fig. 7 and Table 3). This analysis showed that all three mutations decreased the GAP activity of GmRGS2 for both GmGα1 and GmGα2. In general, the Vmax values decreased and EC50 values increased for each protein combination compared with wild-type GmRGS2 (Fig. 7 and Table 3). The E319A mutant displayed the largest effect and almost completely abolished the GAP activity of GmRGS2 (Table 3).
FIGURE 7.
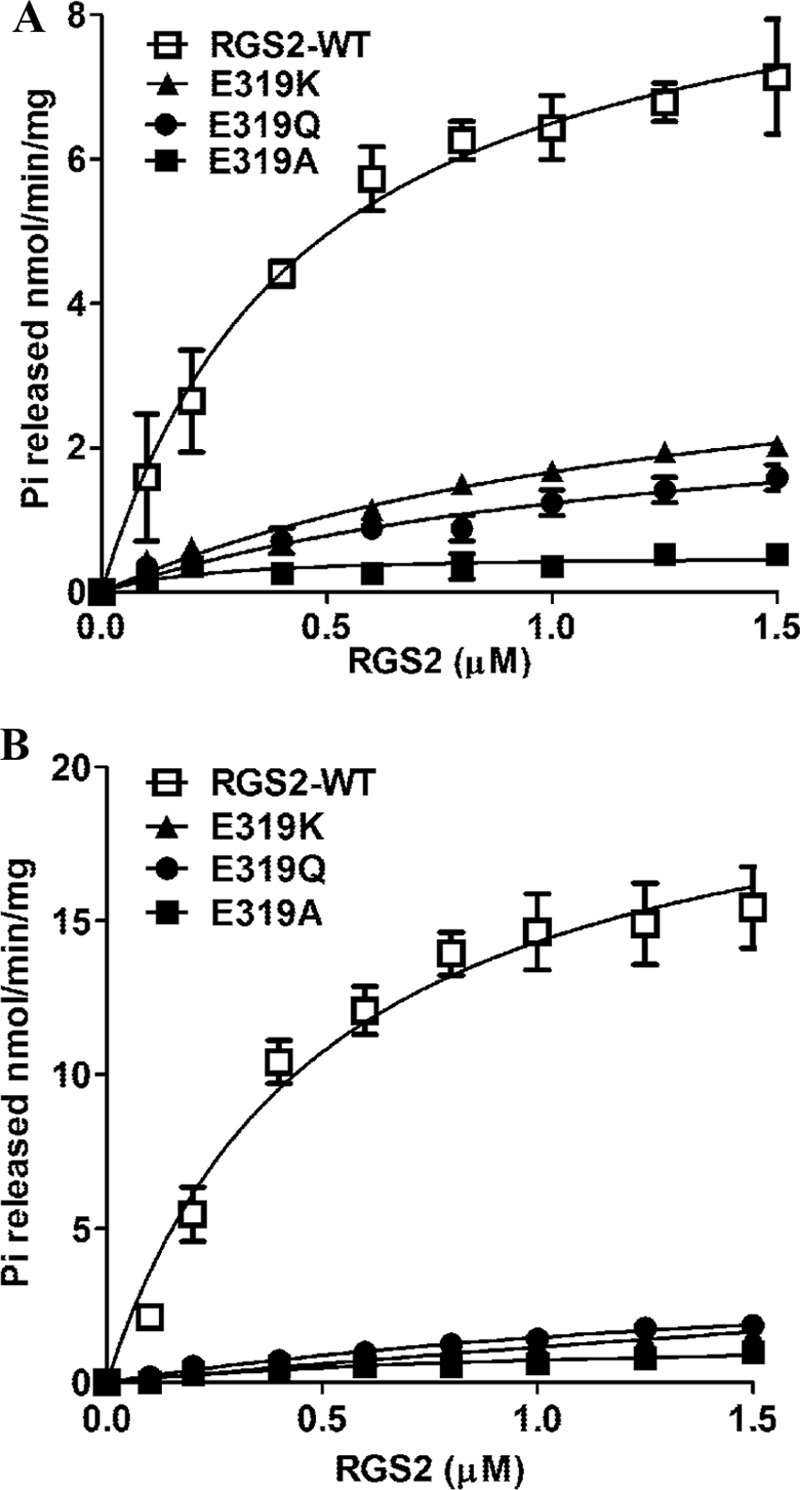
Glu-319 is crucial for RGS protein activity. A, rate of Pi release from GmGα1 in the presence of different concentrations of wild-type and mutant GmRGS2. B, rate of Pi release from GmGα2 in the presence of different concentrations of wild-type and mutant GmRGS2. Experiments were repeated three times, and data were averaged. Error bars represent the mean ± S.E. Data were fit using GraphPad Prism version 5.0.
TABLE 3.
Effect of Glu-319 mutation in GmRGS2 on the rate of phosphate (Pi) release from GmGα1 and GmGα2
All values are expressed as a mean ± S.E. (n = 3).
| Proteins | GmGα1 |
GmGα2 |
||
|---|---|---|---|---|
| Vmax | EC50 | Vmax | EC50 | |
| nmol min−1mg−1 | μm | nmol min−1mg−1 | μm | |
| RGS2-WT | 9.5 ± 0.7 | 0.5 ± 0.1 | 21.5 ± 1.8 | 0.5 ± 0.1 |
| RGS2-E319K | 4.0 ± 0.6 | 1.4 ± 0.4 | 12.5 ± 0.4 | 10.0 ± 0.4 |
| RGS2-E319Q | 2.9 ± 0.7 | 1.3 ± 0.5 | 4.4 ± 0.5 | 2.0 ± 0.5 |
| RGS2-E319A | 0.5 ± 0.1 | 0.2 ± 0.1 | 1.5 ± 0.4 | 1.1 ± 0.4 |
Amino Acid 357 Modulates GAP Activity in GmRGS
Sequence comparisons of GmRGS1 and GmRGS2 identified variations that may alter GAP activity. Of the six amino acid differences between the RGS domains of GmRGS1 and GmRGS2 (Fig. 2B), four are similar substitutions but two (positions 306 and 357) differ. Leu-306 in GmRGS1 is not conserved among different species; however, most plant and some animal RGS proteins, including AtRGS1 and GmRGS2, have a conserved alanine at position 357 (Fig. 2B). This residue is replaced with a valine in GmRGS1.
To test the potential role of this residue in controlling GAP activity, mutations in both GmRGS1 (V357A) and in GmRGS2 (A357V) were generated, and the mutant proteins were tested for their effect on GTPase activity of GmGα proteins. For these experiments, GmGα1 and GmGα2 were used as representatives of slower and faster GTPases, respectively. As shown in Fig. 8 and summarized in Table 4, mutation of residue 357 in each GmRGS switches GAP activity. The GmRGS1 V357A mutant enhances GTPase activity of GmGα compared with wild-type GmRGS1. Conversely, GmRGS2 A357V impairs the GTPase activity of GmGα compared with wild-type protein. Additionally, GmRGS1 V357A reduces the EC50 difference seen in the wild-type GmRGS1 interactions with GmGα1 and GmGα2. GmRGS2 A357V has the opposite effect, leading to differences in the EC50.
FIGURE 8.
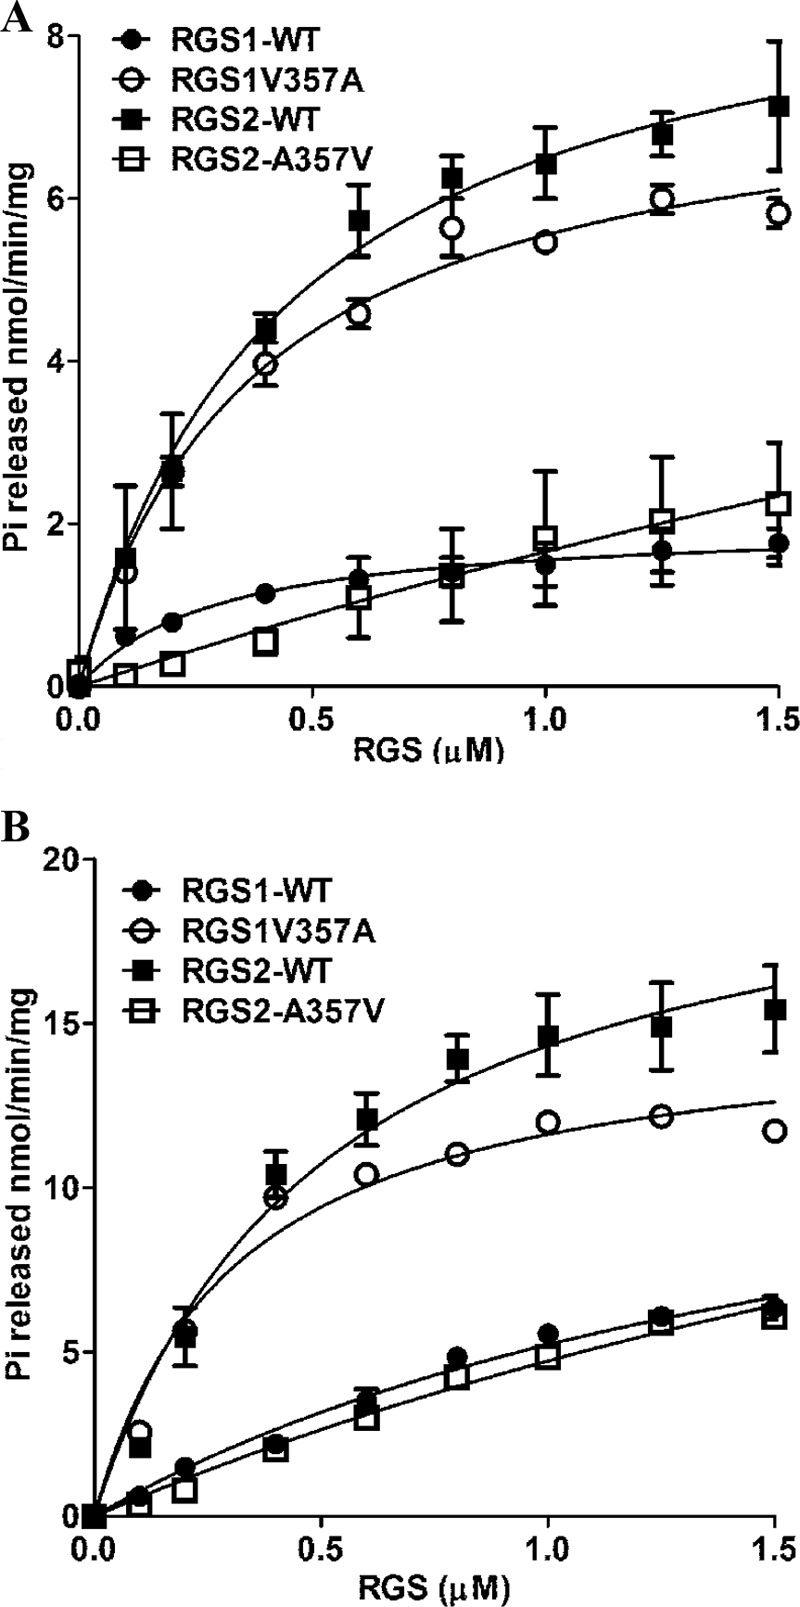
Amino acid 357 determines differential GAP activities of GmRGS. A, rate of Pi release from GmGα1 in the presence of different concentrations of wild-type and mutant GmRGS1 and GmRGS2. B, rate of Pi release from GmGα2 in the presence of wild-type and mutant GmRGS1 and GmRGS2. Experiments were repeated three times and data were averaged. Error bars represent the mean ± S.E. Data were fit using GraphPad Prism version 5.0.
TABLE 4.
Effect of the V357A mutation in GmRGS1 and the A357V mutation in GmRGS2 on the rate of phosphate (Pi) release from GmGα1 and GmGα2
All values are expressed as a mean ± S.E. (n = 3).
| Proteins | GmGα1 |
GmGα2 |
||
|---|---|---|---|---|
| Vmax | EC50 | Vmax | EC50 | |
| nmol min−1mg−1 | μm | nmol min−1mg−1 | μm | |
| RGS1-WT | 2.0 ± 0.2 | 0.4 ± 0.1 | 15.0 ± 2.4 | 1.9 ± 0.5 |
| RGS1-V357A | 7.6 ± 0.3 | 0.3 ± 0.1 | 15.2 ± 0.8 | 0.3 ± 0.0 |
| RGS2-WT | 9.5 ± 0.8 | 0.5 ± 0.1 | 21.5 ± 0.2 | 0.5 ± 0.1 |
| RGS2-A357V | 13.4 ± 0.2 | 7.1 ± 0.2 | 22.8 ± 1.5 | 3.8 ± 1.2 |
DISCUSSION
Since the discovery of the Arabidopsis Gα protein AtGPA1 and its regulatory RGS protein AtRGS1 (11), almost all research related to the kinetics and regulation of plant G-protein signaling has remained focused on these two proteins. The presence of a single copy of each of these genes in the Arabidopsis genome and the availability of complete genetic knock-out mutants have allowed for the evaluation of the role of both these proteins on overall growth and development of Arabidopsis, a situation not feasible with most multicellular organisms (12). These studies have also provided important clues to alternative G-protein signaling mechanisms beyond the canonical mammalian models. However, the simple G-protein system of Arabidopsis limits our view of the variability and complexity of plant G-protein networks and does not allow for a comparative assessment of their biochemical properties. The presence of multiple copies of all the G-protein signaling proteins in soybean provides an opportunity to extend the knowledge to more complex and agriculturally relevant plants, as more than 70% of plants are polyploid and likely have multiple copies of G-proteins, unlike Arabidopsis or rice.
Biochemical Properties of Gα and RGS Proteins of Soybean
Biochemical characterization of the four soybean Gα proteins reveals rates of GTP binding 100–1000-fold faster than mammalian systems, along with higher rates of GDP release and lower rates of GTP hydrolysis (Fig. 1). On the whole, these data are similar to AtGPA1, which has an observed rate of GTP binding 2 orders of magnitude faster and a steady-state rate of GTP hydrolysis an order of magnitude slower than the mammalian Gαo (28), implying that GTP hydrolysis is likely to be the rate-limiting step in plant G-protein signaling. Nevertheless, important differences were observed in the kinetics of the four GmGα proteins (Fig. 1 and Table 1). GmGα4 has a rate of GTP binding 4-fold higher than GmGα2 and GmGα3, whereas the rate of GDP dissociation from GmGα3 is nearly 5-fold slower than that of GmGα1 and GmGα4. These differences suggest variations in the timing of the G-protein cycle in soybean.
The rate-limiting step of the G-protein cycle in Arabidopsis is regulated by AtRGS1, which causes a 35-fold increase in the steady-state rate of GTP hydrolysis by AtGPA1 (31). Similar to AtRGS1, both GmRGS1 and GmRGS2 act as GAPs. Direct biochemical analyses confirmed a significant increase in the rate of GTP hydrolysis for each of the GmGα proteins in the presence of GmRGS proteins (Figs. 5 and 6). Interestingly, despite 96% sequence identity between the two GmRGS proteins, the GAP activity of GmRGS2 is up to 5-fold greater than that of GmRGS1, depending on the Gα protein assayed (Fig. 6). This suggests that the G-protein cycle mediated by each of the four GmGα could have different kinetics subject to its regulation by either GmRGS1 or GmRGS2, in addition to RGS-independent regulation.
How these moderately different biochemical properties and their regulation affect G-protein cycling in a cell with respect to sharing the available pool of GTP and respond to a particular signal remains an open question at this juncture. Moreover, because the interaction of Gα proteins with Gβγ dimers and/or other effector proteins of G-protein signaling complex depends on GDP-bound versus GTP-bound conformation of Gα proteins (44), it is conceivable that the inherent biochemical differences and their distinct regulation will also affect the downstream signaling pathways initiated by each Gα protein. These differences provide a first glimpse of the possible complexity of G-protein cycle in plants, especially if more than one protein is active in any given cell type.
In some cases, a high degree of tissue- or developmental stage-dependent expression of specific genes as well as a high degree of overlap between specific GmRGS and GmGα gene expression exists. For example, during seed development, the expression of GmRGS1 follows a similar trend as the group II GmGα, whereas the expression of GmRGS2 overlaps with the group I GmGα (Fig. 3C) (23). Conversely, during seed germination, an opposite trend occurs as both GmRGS genes are down-regulated following imbibition (Fig. 3D), but the GmGα genes are up-regulated (23). It is possible that different modes of G-protein signaling are active during specific physiological responses. An RGS-independent signaling pathway may operate during seed germination versus an active RGS-dependent signaling pathway during seed development. Further studies focused toward identifying the signal-dependent in vivo changes in individual G-protein activation and cycling, elucidation of signal-dependent protein complexes, and in depth cell-specific and signal-dependent expression profiling of individual GmGα will help answer some of these questions.
Interaction between GmGα and GmRGS Proteins
According to the mammalian paradigm, the GAP activity of RGS proteins depends on their physical interaction with cognate Gα proteins (3, 4, 7). Both GmRGS proteins interacted with all four GmGα in the yeast-split ubiquitin assays and bimolecular fluorescence complementation assays in planta (Fig. 4). We did not observe any significant difference in interaction strengths between specific Gα and RGS protein pairs in these assays, despite noticeable differences in the GAP activity of each GmRGS protein. However, it is interesting to note that the EC50 values, which approximate the equilibrium-binding constants, indicate preferences of each GmRGS for certain GmGα. To fully understand this, more quantitative methods such as isothermal titration calorimetry will need to be used to directly measure the strength of these interactions.
In AtRGS1, a glutamate in a putative α-helical region is important for both GAP activity and interaction with AtGPA1 based on homology modeling using the human RGS4-Giα1 interaction (45). This residue is conserved in the GmRGS, and our mutant analysis showed that changing either its polarity and/or charge has a significant effect on the GAP activity of both proteins (Fig. 7 and Table 3). Although these data suggested that the overall interaction interface of plant and mammalian RGS-Gα interaction may be conserved, the presence of two different RGS proteins also offered an opportunity to identify key amino acids responsible for their differential GAP activities. Interestingly, the amino acid at position 357 (i.e. valine or alanine), identified in this study as a molecular switch that controls the slow versus fast GAP activities of GmRGS1 and GmRGS2 (Fig. 8 and Table 4), was not previously predicted to be directly involved in RGS-Gα interaction (45). It would therefore be premature to draw conclusions about the plant Gα-RGS interaction interface at this point. Structural information on the interaction of a plant Gα and its cognate RGS protein would help define the protein-protein interface in the plant system, especially in light of the recent crystal structure of AtGPA1 that has shown unique, plant-specific features (29).
RGS Proteins in the Context of Plant Evolution
Based on two genome duplication events during soybean evolution (38), four RGS proteins were expected; however, our analysis identified only two GmRGS (Fig. 2). This suggests a likely loss of the other two genes during evolution. Most dicot plants have one or more homologs of RGS proteins, although Setaria is the sole representative monocot with an RGS protein homolog. The absence of a 7TM domain in the RGS protein from Setaria suggests the possibility that the 7TM domain was lost first during evolution, followed by a subsequent loss of RGS proteins in the monocot lineage.
The absence of an RGS protein homolog from almost the entire monocot plant lineage warrants a detailed evolutionary analysis of the regulation of G-protein cycle in monocot versus dicot plants (supplemental Fig. S1). It has been shown for Arabidopsis and in this report that RGS protein-regulated acceleration of GTPase activity is a crucial step in the plant G-protein cycle. If the role of the RGS proteins is only to accelerate the extremely slow GTPase activity of the dicot Gα proteins so that they continue cycling between the GDP-bound and GTP-bound forms, then the Gα proteins in monocots might have different kinetic properties and may not require the GTPase acceleration by an RGS protein. Interestingly, there is one report indicating that the rates of GTP binding and GDP release of the rice Gα protein RGA1 are comparable with those of the mammalian Gα proteins and significantly different from AtGPA1 (46); however, these data remain contested (31, 47). In this context, it is also interesting to note that the overall phenotypes of the Atgpa1 mutants are significantly different from the Osrga1 mutants (8, 12). The extent to which the presence of an RGS protein in the plant genome correlates with the presence of a slow versus fast GTPase will only become clear after detailed biochemical characterization of the Gα proteins from evolutionarily different plant lineages. Furthermore, the presence of a 7TM GPCR-like domain in plant RGS proteins is intriguing. Data available from AtRGS1 suggests that this domain does not have a guanine nucleotide exchange factor activity on AtGPA1, at least with sugar as a ligand (28, 31). Whether other compounds may act as a ligand for the 7TM domain of plant RGS proteins remains to be seen. Because this domain does not interact with the Gα protein, it may act as a targeting or scaffolding protein. It could also act in pathways not related to G-protein signaling similar to many mammalian RGS domain-containing proteins (48). Continued sequence analysis of additional plant genomes at important evolutionary junctions will help solve this enigma and shed light on the evolution of plant-specific G-protein signaling pathways.
Biological Significance of Different Kinetic Properties of GmGα and GmRGS Proteins
Studies outside of the rigorously studied mammalian models are beginning to reveal that the basic biochemistry of Gα proteins, i.e. specific binding of guanine nucleotides, inherent GTPase activity with bound GTP, and regulation by RGS proteins, is conserved across phyla. Similarly, the core interactions between different components of the G-protein complex are also fully conserved in each of the organisms studied to date, e.g. the interaction between Gα-GDP and Gβγ, the nondissociable interaction of Gβ and Gγ, and the interaction of Gα and RGS domains.
Nonetheless, it is becoming increasingly clear that the same basic set of biochemical reactions and core protein interactions have evolved to act via significantly different mechanisms that fine-tune individual steps in this timing cycle. Studies in Arabidopsis revealed a perplexing picture of plant G-protein signaling, as a limited number of G-protein complex components seem to regulate a multitude of signaling pathways, although plants lacking one or more of these proteins display relatively subtle phenotypes (12). It has been suggested that G-protein signaling in plants evolved to suit their stationary life style by regulating overall growth and development under any given environmental condition rather than exerting absolute control of any particular pathway (17, 49). The presence of multiple proteins with moderately different kinetics and regulation in soybean (and in other polyploid plant species) presents a scenario in which such principles can be applied even more effectively. It can be envisioned that not only the multiplicity of the components and their specific expression patterns but also their biochemical properties will contribute to generate networks of functionally dissimilar protein complexes to effectively tune the response of a plant to a variety of signals. It is possible that these modest kinetic differences observed in vitro may result in significantly greater changes in vivo in terms of signal output depending on the interaction network of specific G-protein complexes. Future research focused toward elucidating the signal-dependent G-protein complexes, their regulation of specific physiological responses, and modeling of different interactions in the context of their effect on amplifying or dampening the signal output will significantly improve our understanding of G-protein signaling pathways in plants.
Supplementary Material
Acknowledgments
We thank Dr. Jan A. Miernyk (University of Missouri, Columbia) for providing different developmental stages of soybean seeds; Dr. Petra Levin (Washington University, St. Louis) for allowing the use of the Olis DM45 spectrofluorimeter; Christine E. Barnickol for editing of the manuscript, and two anonymous reviewers for their excellent suggestions for improving the manuscript.
This work was supported in part by United States Department of Agriculture/Agriculture and Food Research Initiative Grant 2010-65116-20454 (to S. P.).

This article contains supplemental Figs. S1–S3 and Tables S1 and S2.
- GPCR
- G-protein-coupled receptor
- BODIPY
- 4,4-difluoro-4-bora-3α,4α-diazaindacene
- GAP
- GTPase-activity accelerating protein
- MANT
- 2′-/3′-O-N′-methylanthraniloyl
- RGS
- regulator of G-protein signaling
- CUb
- C-terminal half of ubiquitin
- NUb
- N-terminal half of ubiquitin
- EYFP
- enhanced YFP
- 7-TM
- 7-transmembrane.
REFERENCES
- 1. Offermanns S. (2003) G-proteins as transducers in transmembrane signaling. Prog. Biophys. Mol. Biol. 83, 101–130 [DOI] [PubMed] [Google Scholar]
- 2. Cabrera-Vera T. M., Vanhauwe J., Thomas T. O., Medkova M., Preininger A., Mazzoni M. R., Hamm H. E. (2003) Insights into G protein structure, function, and regulation. Endocr. Rev. 24, 765–781 [DOI] [PubMed] [Google Scholar]
- 3. Wettschureck N., Offermanns S. (2005) Mammalian G proteins and their cell type-specific functions. Physiol. Rev. 85, 1159–1204 [DOI] [PubMed] [Google Scholar]
- 4. Siderovski D. P., Willard F. S. (2005) The GAPs, GEFs, and GDIs of heterotrimeric G-protein α subunits. Int. J. Biol. Sci. 1, 51–66 [DOI] [PMC free article] [PubMed] [Google Scholar]
- 5. Johnston C. A., Siderovski D. P. (2007) Receptor-mediated activation of heterotrimeric G-proteins. Current structural insights. Mol. Pharmacol. 72, 219–230 [DOI] [PubMed] [Google Scholar]
- 6. Oldham W. M., Hamm H. E. (2008) Heterotrimeric G protein activation by G-protein-coupled receptors. Nat. Rev. Mol. Cell Biol. 9, 60–71 [DOI] [PubMed] [Google Scholar]
- 7. Lambert N. A., Johnston C. A., Cappell S. D., Kuravi S., Kimple A. J., Willard F. S., Siderovski D. P. (2010) Regulators of G-protein signaling accelerate GPCR signaling kinetics and govern sensitivity solely by accelerating GTPase activity. Proc. Natl. Acad. Sci. U.S.A. 107, 7066–7071 [DOI] [PMC free article] [PubMed] [Google Scholar]
- 8. Temple B. R., Jones A. M. (2007) The plant heterotrimeric G-protein complex. Annu. Rev. Plant. Biol. 58, 249–266 [DOI] [PubMed] [Google Scholar]
- 9. Jones A. M., Assmann S. M. (2004) Plants. The latest model system for G-protein research. EMBO. Rep. 5, 572–578 [DOI] [PMC free article] [PubMed] [Google Scholar]
- 10. Pandey S. (2011) More (G-proteins) please! Identification of an elaborate network of G-proteins in soybean. Plant. Signal. Behav. 6, 780–782 [DOI] [PMC free article] [PubMed] [Google Scholar]
- 11. Chen J. G., Willard F. S., Huang J., Liang J., Chasse S. A., Jones A. M., Siderovski D. P. (2003) A seven-transmembrane RGS protein that modulates plant cell proliferation. Science 301, 1728–1731 [DOI] [PubMed] [Google Scholar]
- 12. Perfus-Barbeoch L., Jones A. M., Assmann S. M. (2004) Plant heterotrimeric G protein function. Insights from Arabidopsis and rice mutants. Curr. Opin. Plant Biol. 7, 719–731 [DOI] [PubMed] [Google Scholar]
- 13. Wang X. Q., Ullah H., Jones A. M., Assmann S. M. (2001) G protein regulation of ion channels and abscisic acid signaling in Arabidopsis guard cells. Science 292, 2070–2072 [DOI] [PubMed] [Google Scholar]
- 14. Ullah H., Chen J. G., Young J. C., Im K. H., Sussman M. R., Jones A. M. (2001) Modulation of cell proliferation by heterotrimeric G protein in Arabidopsis. Science 292, 2066–2069 [DOI] [PubMed] [Google Scholar]
- 15. Ullah H., Chen J. G., Temple B., Boyes D. C., Alonso J. M., Davis K. R., Ecker J. R., Jones A. M. (2003) The β-subunit of the Arabidopsis G protein negatively regulates auxin-induced cell division and affects multiple developmental processes. Plant Cell 15, 393–409 [DOI] [PMC free article] [PubMed] [Google Scholar]
- 16. Trusov Y., Rookes J. E., Tilbrook K., Chakravorty D., Mason M. G., Anderson D., Chen J. G., Jones A. M., Botella J. R. (2007) Heterotrimeric G protein γ subunits provide functional selectivity in Gβγ dimer signaling in Arabidopsis. Plant Cell 19, 1235–1250 [DOI] [PMC free article] [PubMed] [Google Scholar]
- 17. Nilson S. E., Assmann S. M. (2010) Heterotrimeric G proteins regulate reproductive trait plasticity in response to water availability. New Phytol. 185, 734–746 [DOI] [PubMed] [Google Scholar]
- 18. Warpeha K. M., Gibbons J., Carol A., Slusser J., Tree R., Durham W., Kaufman L. S. (2008) Adequate phenylalanine synthesis mediated by G protein is critical for protection from UV radiation damage in young etiolated Arabidopsis thaliana seedlings. Plant Cell Environ. 31, 1756–1770 [DOI] [PubMed] [Google Scholar]
- 19. Pandey S., Monshausen G. B., Ding L., Assmann S. M. (2008) Regulation of root-wave response by extra large and conventional G proteins in Arabidopsis thaliana. Plant J. 55, 311–322 [DOI] [PubMed] [Google Scholar]
- 20. Suharsono U., Fujisawa Y., Kawasaki T., Iwasaki Y., Satoh H., Shimamoto K. (2002) The heterotrimeric G protein α subunit acts upstream of the small GTPase Rac in disease resistance of rice. Proc. Natl. Acad. Sci. U.S.A. 99, 13307–13312 [DOI] [PMC free article] [PubMed] [Google Scholar]
- 21. Ueguchi-Tanaka M., Fujisawa Y., Kobayashi M., Ashikari M., Iwasaki Y., Kitano H., Matsuoka M. (2000) Rice dwarf mutant d1, which is defective in the α subunit of the heterotrimeric G protein, affects gibberellin signal transduction. Proc. Natl. Acad. Sci. U.S.A. 97, 11638–11643 [DOI] [PMC free article] [PubMed] [Google Scholar]
- 22. Choudhury S. R., Bisht N. C., Thompson R., Todorov O., Pandey S. (2011) Conventional and novel Gγ protein families constitute the heterotrimeric G-protein signaling network in soybean. PLoS One 6, e23361. [DOI] [PMC free article] [PubMed] [Google Scholar]
- 23. Bisht N. C., Jez J. M., Pandey S. (2011) An elaborate heterotrimeric G-protein family from soybean expands the diversity of plant G-protein networks. New Phytol. 190, 35–48 [DOI] [PubMed] [Google Scholar]
- 24. Pronin A. N., Gautam N. (1992) Interaction between G-protein β and γ subunit types is selective. Proc. Natl. Acad. Sci. U.S.A. 89, 6220–6224 [DOI] [PMC free article] [PubMed] [Google Scholar]
- 25. Li Y., Sternweis P. M., Charnecki S., Smith T. F., Gilman A. G., Neer E. J., Kozasa T. (1998) Sites for Gα binding on the G protein β subunit overlap with sites for regulation of phospholipase Cβ and adenylyl cyclase. J. Biol. Chem. 273, 16265–16272 [DOI] [PubMed] [Google Scholar]
- 26. Thomas T. C., Schmidt C. J., Neer E. J. (1993) G-protein α o subunit. mutation of conserved cysteines identifies a subunit contact surface and alters GDP affinity. Proc. Natl. Acad. Sci. U.S.A. 90, 10295–10299 [DOI] [PMC free article] [PubMed] [Google Scholar]
- 27. Schmidt C. J., Thomas T. C., Levine M. A., Neer E. J. (1992) Specificity of G protein β and γ subunit interactions. J. Biol. Chem. 267, 13807–13810 [PubMed] [Google Scholar]
- 28. Johnston C. A., Taylor J. P., Gao Y., Kimple A. J., Grigston J. C., Chen J. G., Siderovski D. P., Jones A. M., Willard F. S. (2007) GTPase acceleration as the rate-limiting step in Arabidopsis G protein-coupled sugar signaling. Proc. Natl. Acad. Sci. U.S.A. 104, 17317–17322 [DOI] [PMC free article] [PubMed] [Google Scholar]
- 29. Jones J. C., Duffy J. W., Machius M., Temple B. R., Dohlman H. G., Jones A. M. (2011) The crystal structure of a self-activating G protein α subunit reveals its distinct mechanism of signal initiation. Sci. Signal. 4, ra8. [DOI] [PMC free article] [PubMed] [Google Scholar]
- 30. Jones J. C., Temple B. R., Jones A. M., Dohlman H. G. (2011) Functional reconstitution of an atypical G protein heterotrimer and regulator of G protein signaling protein (RGS1) from Arabidopsis thaliana. J. Biol. Chem. 286, 13143–13150 [DOI] [PMC free article] [PubMed] [Google Scholar]
- 31. Johnston C. A., Willard M. D., Kimple A. J., Siderovski D. P., Willard F. S. (2008) A sweet cycle for Arabidopsis G-protein. Recent discoveries and controversies in plant G-protein signal transduction. Plant Signal. Behav. 3, 1067–1076 [DOI] [PMC free article] [PubMed] [Google Scholar]
- 32. Jez J. M., Cahoon R. E. (2004) Kinetic mechanism of glutathione synthetase from Arabidopsis thaliana. J. Biol. Chem. 279, 42726–42731 [DOI] [PubMed] [Google Scholar]
- 33. Pandey S., Assmann S. M. (2004) The Arabidopsis putative G protein-coupled receptor GCR1 interacts with the G protein α subunit GPA1 and regulates abscisic acid signaling. Plant Cell 16, 1616–1632 [DOI] [PMC free article] [PubMed] [Google Scholar]
- 34. Citovsky V., Lee L. Y., Vyas S., Glick E., Chen M. H., Vainstein A., Gafni Y., Gelvin S. B., Tzfira T. (2006) Subcellular localization of interacting proteins by bimolecular fluorescence complementation in planta. J. Mol. Biol. 362, 1120–1131 [DOI] [PubMed] [Google Scholar]
- 35. Johnson K. A. (2009) Fitting enzyme kinetic data with KinTek Global Kinetic Explorer. Methods Enzymol. 467, 601–626 [DOI] [PubMed] [Google Scholar]
- 36. Pandey S., Nelson D. C., Assmann S. M. (2009) Two novel GPCR-type G proteins are abscisic acid receptors in Arabidopsis. Cell 136, 136–148 [DOI] [PubMed] [Google Scholar]
- 37. Anantharaman V., Abhiman S., de Souza R. F., Aravind L. (2011) Comparative genomics uncovers novel structural and functional features of the heterotrimeric GTPase signaling system. Gene 475, 63–78 [DOI] [PMC free article] [PubMed] [Google Scholar]
- 38. Schmutz J., Cannon S. B., Schlueter J., Ma J., Mitros T., Nelson W., Hyten D. L., Song Q., Thelen J. J., Cheng J., Xu D., Hellsten U., May G. D., Yu Y., Sakurai T., Umezawa T., Bhattacharyya M. K., Sandhu D., Valliyodan B., Lindquist E., Peto M., Grant D., Shu S., Goodstein D., Barry K., Futrell-Griggs M., Abernathy B., Du J., Tian Z., Zhu L., Gill N., Joshi T., Libault M., Sethuraman A., Zhang X. C., Shinozaki K., Nguyen H. T., Wing R. A., Cregan P., Specht J., Grimwood J., Rokhsar D., Stacey G., Shoemaker R. C., Jackson S. A. (2010) Genome sequence of the palaeopolyploid soybean. Nature 463, 178–183 [DOI] [PubMed] [Google Scholar]
- 39. Roy A., Kucukural A., Zhang Y. (2010) I-TASSER. A unified platform for automated protein structure and function prediction. Nat. Protoc. 5, 725–738 [DOI] [PMC free article] [PubMed] [Google Scholar]
- 40. Sun J., Miwa H., Downie J. A., Oldroyd G. E. (2007) Mastoparan activates calcium spiking analogous to Nod factor-induced responses in Medicago truncatula root hair cells. Plant Physiol. 144, 695–702 [DOI] [PMC free article] [PubMed] [Google Scholar]
- 41. Hajduch M., Hearne L. B., Miernyk J. A., Casteel J. E., Joshi T., Agrawal G. K., Song Z., Zhou M., Xu D., Thelen J. J. (2010) Systems analysis of seed filling in Arabidopsis. Using general linear modeling to assess concordance of transcript and protein expression. Plant Physiol. 152, 2078–2087 [DOI] [PMC free article] [PubMed] [Google Scholar]
- 42. Soundararajan M., Willard F. S., Kimple A. J., Turnbull A. P., Ball L. J., Schoch G. A., Gileadi C., Fedorov O. Y., Dowler E. F., Higman V. A., Hutsell S. Q., Sundström M., Doyle D. A., Siderovski D. P. (2008) Structural diversity in the RGS domain and its interaction with heterotrimeric G protein α-subunits. Proc. Natl. Acad. Sci. U.S.A. 105, 6457–6462 [DOI] [PMC free article] [PubMed] [Google Scholar]
- 43. Kosloff M., Travis A. M., Bosch D. E., Siderovski D. P., Arshavsky V. Y. (2011) Integrating energy calculations with functional assays to decipher the specificity of G protein-RGS protein interactions. Nat. Struct. Mol. Biol. 18, 846–853 [DOI] [PMC free article] [PubMed] [Google Scholar]
- 44. Klopffleisch K., Phan N., Augustin K., Bayne R. S., Booker K. S., Botella J. R., Carpita N. C., Carr T., Chen J. G., Cooke T. R., Frick-Cheng A., Friedman E. J., Fulk B., Hahn M. G., Jiang K., Jorda L., Kruppe L., Liu C., Lorek J., McCann M. C., Molina A., Moriyama E. N., Mukhtar M. S., Mudgil Y., Pattathil S., Schwarz J., Seta S., Tan M., Temp U., Trusov Y., Urano D., Welter B., Yang J., Panstruga R., Uhrig J. F., Jones A. M. (2011) Arabidopsis G-protein interactome reveals connections to cell wall carbohydrates and morphogenesis. Mol. Syst. Biol. 7, 532. [DOI] [PMC free article] [PubMed] [Google Scholar]
- 45. Tesmer J. J., Berman D. M., Gilman A. G., Sprang S. R. (1997) Structure of RGS4 bound to AlF4−-activated Giα1. Stabilization of the transition state for GTP hydrolysis. Cell 89, 251–261 [DOI] [PubMed] [Google Scholar]
- 46. Seo H. S., Jeong J. Y., Nahm M. Y., Kim S. W., Lee S. Y., Bahk J. D. (2003) The effect of pH and various cations on the GTP hydrolysis of rice heterotrimeric G-protein α subunit expressed in Escherichia coli. J. Biochem. Mol. Biol. 36, 196–200 [DOI] [PubMed] [Google Scholar]
- 47. Iwasaki Y., Kato T., Kaidoh T., Ishikawa A., Asahi T. (1997) Characterization of the putative α subunit of a heterotrimeric G protein in rice. Plant Mol. Biol. 34, 563–572 [DOI] [PubMed] [Google Scholar]
- 48. Bansal G., Druey K. M., Xie Z. (2007) R4 RGS proteins: regulation of G-protein signaling and beyond. Pharmacol. Ther. 116, 473–495 [DOI] [PMC free article] [PubMed] [Google Scholar]
- 49. Assmann S. M. (2004) Plant G proteins, phytohormones, and plasticity. Three questions and a speculation. Sci. STKE 2004, re20. [DOI] [PubMed] [Google Scholar]
Associated Data
This section collects any data citations, data availability statements, or supplementary materials included in this article.