

Abstract
Objectives/Hypothesis
Digital kymography (DKG) can provide objective, quantitative data about vocal fold vibration which may help distinguish normal from pathological vocal folds as well as nodules from polyps.
Study Design
Case-control study.
Methods
87 subjects were separated into three groups: control, nodules, and unilateral polyps, and examined using a high-speed camera attached to an endoscope. Videos were analyzed using a custom MATLAB program, and three DKG line-scan positions (25%, 50% and 75% of vocal fold length) were used in statistical analyses to compare vocal fold vibrational frequency, amplitude symmetry index (ASI), amplitude order, and vertical and lateral phase difference (VPD and LPD, respectively).
Results
Significant differences among groups were found in all vibrational parameters except frequency. Polyps and nodules groups exhibited greater ASI values (less amplitude symmetry) than the control group. While the control group consistently showed its largest amplitudes at the midline, the polyps group showed larger amplitudes toward the posterior end of the vocal folds. A significant anterior-posterior pattern in amplitude was not found in the nodules group. LPD values were usually largest (most symmetrical) in the control group, followed by nodules and polyps. LPD at the 25% position allowed for differentiation between polyp and nodule groups. The largest VPD (more pronounced mucosal wave) values were usually found in the control group.
Conclusion
Vibratory characteristics of normal and pathological vocal folds were quantitatively examined and compared using multi-line DKG. These findings may allow for better characterization of pathologies and eventually assist in improving the clinical utility of DKG.
Keywords: Multi-line digital kymography, vocal fold nodules, vocal fold polyps, high speed video
INTRODUCTION
Vibration of the vocal folds determines voice quality to a large extent. Laryngeal disorders can affect vocal fold vibration; thus, a reliable methodology to visualize vibration is necessary, as it is imperative to accurately detect and diagnose vocal pathologies in order to assure the correct course of treatment. Various laryngeal imaging methods have been developed to visualize vocal fold vibration, including stroboscopy, digital kymography (DKG), and high-speed imaging. Stroboscopy is commonly used in the clinic1 due to its speed and simplicity of use, but a major limitation of this technique is that it only detects periodic vibrations, which excludes many laryngeal disorders from detection by this method2. To overcome this issue, digital kymography (DKG) and high-speed imaging have come into use. High-speed imaging, first described in 1940 by Farnsworth,3 provides a full view of the glottis but is expensive and the huge amount of data collected limits its clinical applicability.4,5 DKG involves the extraction of information from laryngeal high-speed images, allowing for the analysis of left-right symmetry and several vocal fold vibratory parameters, such as amplitude, frequency, and phase difference, at a user-selected single pixel line across the glottis.6–8 This permits the use of much higher frame rates and requires less computer power than conventional high-speed imaging.9 A similar method, multi-line DKG, builds on the capabilities of single-line DKG by allowing for the measurement of anterior-posterior symmetry via the selection of several pixel lines along the length of the vocal folds. Wittenberg et al.,10 Eysholdt et al.,11 and Krausert et al.12 have used similar techniques with varying numbers of line-scan positions to observe vocal fold vibration. As multi-line DKG allows for the extraction of more video information than single-line kymography and stroboscopy while operating at a more clinically feasible rate than full frame high speed image analysis, we used this technique in our study to best characterize parameters of pathological vocal fold vibrations.
Nodules (more common in children and females) and polyps (more common in males), have not been previously studied with DKG; this technique will likely evidence new information to better diagnose and assign proper treatment to these disorders. Colton et al.13 used stroboscopy to qualitatively study benign vocal fold lesions, finding that ratings of periodicity, amplitude of vibration, and mucosal wave are not important in assessing vocal fold dysfunction. However, as stated above, a limitation of stroboscopy is that aperiodicity in vibration frequency is not detected. VKG and DKG are capable of imaging aperiodic vibrations and also show that amplitude of vibration and mucosal wave are in fact quite relevant in discussions of vocal fold health and pathology. A landmark VKG study by Svec et al.6 distinguishes several normal and pathological voices by observing vibratory features such as amplitude and mucosal wave but does not quantify these features. We will improve on their results by quantifying vibratory parameters to describe normal and pathological voices. The division between nodules and polyps is a historically difficult task that has clinical implications, as treatments for vocal fold nodules and polyps are quite different. Chau et al.14 found high interobserver variability in diagnosing the two conditions using videostroboscopy. Altman15 notes that it can be difficult to visually differentiate nodules from polyps that have a reactive lesion on the opposite vocal fold. Reactive lesions may develop as a result of the increased shearing force experienced during collision with the polyp. Varying definitions of these disorders among clinicians calls attention to the need for further clarification on this issue. Addressing this issue with multi-line DKG allows for the examination of anterior-posterior asymmetry and other parameters which may improve diagnostic accuracy by clinicians. The purpose of this study was to assess vocal fold vibratory parameters to better define and characterize quantitative differences between vocal fold polyps and nodules to establish a basis for further research and to improve the clinical utility of multiline DKG.
MATERIALS AND METHODS
Data collection
High-speed videos of subjects were obtained under the approval of the Institutional Review Board of the University of Wisconsin-Madison and the Ethics Committee of Fudan University Eye, Ear, Nose, and Throat Hospital in Shanghai, China. High-speed videos were obtained from 87 subjects, consisting of 36 normal speakers (19 male/17 female), 34 with vocal polyps (20 male/14 female), and 17 females with vocal fold nodules. Subjects were asked to phonate an open vowel /a/ for a time length of 4 seconds. A high-speed camera (KayPENTAX Fastcam MC2, Lincoln Park, NJ) was used to collect high-speed images at a frame rate of 4000 frames per second and a resolution of 512 × 256 pixels. Images were obtained with a rigid 70° endoscope (Kay Elemetrics Model 9106) with a 300-W cold light source. The rigid laryngoscope was coupled to the high-speed digital camera head and endoscopy was performed as in conventional videostroboscopy. Endoscopic images of representative examples of normal, nodules, and polyps subjects are displayed in Figure 1.
Figure 1.
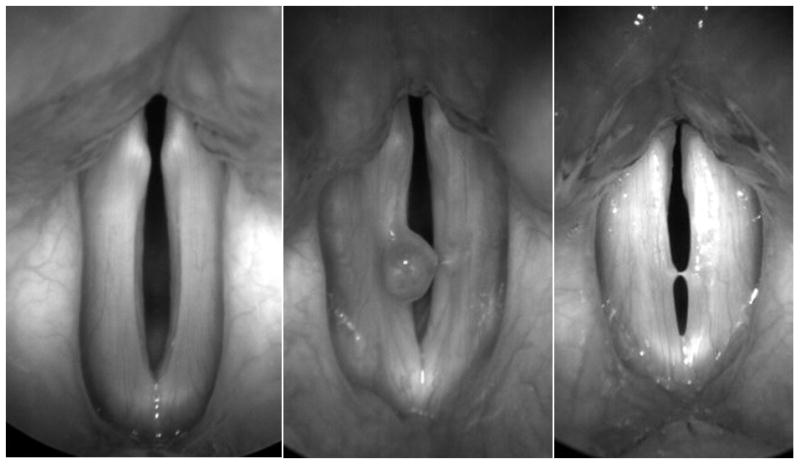
Left, representative high-speed image of normal vocal folds. Middle, high-speed image of vocal folds with a polyp on the right fold. Right, high-speed image of vocal folds with bilateral nodules.
Data analysis
Multi-line DKG and curve fitting were performed with a custom MATLAB (version 7.2.0.232 (R2006a), The Mathworks, Inc., Natick, MA) image edge detection program. Three pixel lines perpendicular to the axis of the glottis were chosen for kymographic analysis. The line scan position was measured as a percentage of the vocal fold length using a function of the custom MATLAB program. This novel function allows the user to place points at the anterior and posterior commissures and to then choose the desired line placement by entering a percentage of the distance between these points. This eliminates user bias in estimating percentages of vocal fold lengths, although there is still a manual component in the placement of the points at the commissures. Lines selected were located at 25% (midway between the posterior commissure and midpoint), 50% (at the midpoint), and 75% (midway between the midpoint and anterior commissure) of the vocal fold length. The choice of more than one line-scan position allows the kymograms to be compared for anterior-posterior symmetry to observe potential differences in vibration along the length of the vocal folds.
To curve-fit vibration patterns in the kymogram, glottal edges must be extracted. This is typically done using the threshold segmentation method in order to separate pixel intensities from the glottis and surrounding vocal fold tissue.16–18 However, the MATLAB program used in this study lends the ability to manually plot points along the glottal edge in cases of poor resolution in addition to performing the original threshold technique, allowing for more precise segmentation. The left-upper (LU), left-lower (LL), right-upper (RU), and right-lower (RL) lips of the vocal folds were segmented and one sine curve was fitted to each, allowing for comparison of amplitude, frequency, and phase difference. As shown by Krausert et al.,12 with the curve fitting method, mucosal wave motion is modeled with a sine wave where Yα(t) is the position of vocal fold lip α at time t. α = 1,2,3,4 correspond to the left-upper, left-lower, right-upper, and right-lower vocal fold lips, respectively.
where n can range from 1 to 8 and represents the order number of the vibration. A0 represents the initial offset amplitude, A1 represents the wave amplitude, f represents the wave frequency, t represents time, and ϕ represents the wave phase number. Assuming that frequency is constant, the phase numbers of two waves can be subtracted to find the phase difference at a certain point in time, as shown in Figure 2. This was useful for comparison between vocal fold lips. Finding the phase difference between upper and lower lips of either the right or the left vocal fold provides information about the natural time delay involved with mucosal wave propagation. The phase difference between either the upper or the lower lips of the right and left vocal folds provides information about the lateral symmetry of vibration. Sulter et al.19 defined lateral phase difference and vertical phase difference as phase differences between the right and left vocal folds and between the caudal and cranial parts of the vocal folds, respectively. Therefore, we will define the phase difference RU – LU as upper lateral phase difference and RU – RL and LU – LL as right and left vertical phase difference, respectively.
Figure 2.
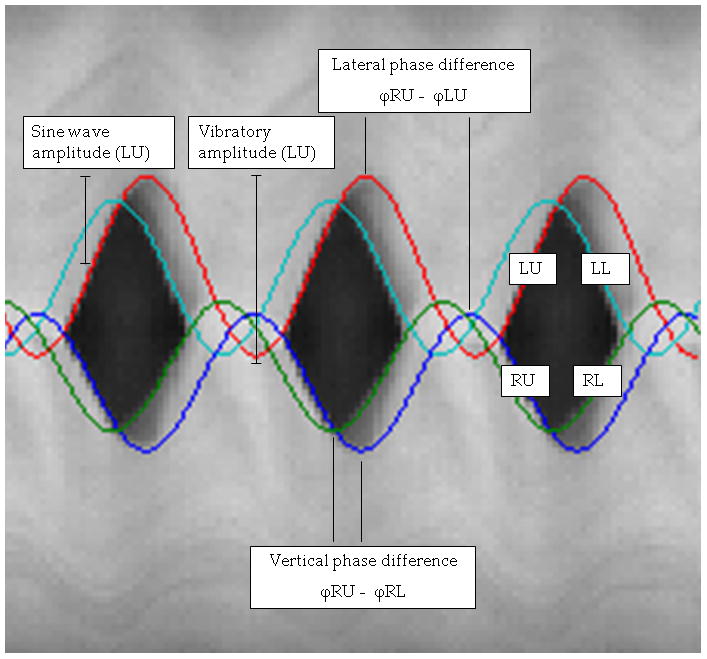
Kymogram showing curves fitted to vocal fold lips. Vertical and lateral phase differences as well as vibratory and sine wave amplitudes are displayed.
Because calibration of vocal fold lengths was not possible and heights of patients were not obtained at the time of examination, which would allow use of an equation by Filho et al.20 relating patient height and vocal fold length with good reliability, amplitudes were obtained in pixels instead of millimeters. This prevents direct comparison of amplitudes between subjects, conditions, and other studies, because the videos were not taken at a specified exact distance from the vibrating vocal folds. In order to facilitate comparisons between individuals and groups, amplitude symmetry index and amplitude ordering were used. The amplitude symmetry index (ASI) was introduced by Qiu et al.7 in 2003 and is defined as the difference in amplitude between the two vocal folds divided by the sum of their amplitudes, given by
where a1 and a2 are the amplitudes of the right and left vocal folds, respectively. The value of ASI ranges between −1 and 1, and when it approaches 0, the vibration of the vocal folds have perfect amplitude symmetry. The absolute value of ASI was used in statistical calculations. ASI was calculated for control, polyp, and nodule groups at all three line scan positions, and the groups were statistically compared at each position.
Amplitude ordering was used to compare differences in vibration among individual subjects. In each subject, the average amplitude of the two sine curves for each vocal fold (upper and lower) at each line-scan position was calculated. Then the positions were ordered such that the largest amplitude was assigned a value of 1.0 and the other two line-scan positions a percentage of that, based on the percentage of their amplitude in pixels compared to the largest amplitude.
For example, if the 50% line-scan position had an amplitude value in pixels that was exactly double that of the 25% and 75% line-scan positions in every single subject in the control group, the final amplitude order values for the control group would be 1.0 at the 50% position and 0.5 at both the 25% and 75% positions. This relative parameter allows for comparison among groups, whereas the raw pixel values could not be compared among subjects or groups due to lack of the ability to control the distance between the camera and the vocal folds. The normal order of amplitudes (from largest to smallest), as reported by Jiang et al.,16 is considered to be the vocal fold midpoint, followed by the anterior third and finally the posterior third. This order is most likely due to arytenoid damping of vocal fold vibration of the posterior third of the vocal fold. In the format of our reported results, this corresponds to an order of 50-75-25. Because the polyp group included subjects with either right or left vocal fold polyps, vocal folds for this group were separated into lesioned and non-lesioned sides for statistical analysis. Amplitude order values were compared among the three line scan positions within each group as well as among groups at each line scan position.
Vertical phase difference (VPD) was calculated in each group at all three line scan positions, and the groups were statistically compared at each position. Because control and nodule groups theoretically should have similar vibrational properties on both the right and left vocal folds, RU-RL and LU-LL phase differences were combined for these groups, leaving them with one VPD value at each line scan position. The polyps group, on the other hand, had two VPD values at each line scan position because, similar to amplitude ordering, vocal folds in this group were separated into lesioned and non-lesioned sides. This separation was performed because it cannot be assumed that both right and left vocal folds exhibit similar vibration in cases of unilateral polyps. Therefore, both the lesioned and non-lesioned VPD values for polyps were statistically compared with the single control and nodules values at each line scan position.
ASI and lateral phase difference (LPD) were calculated for upper vocal folds, because videos were taken from a superior view, affording a better view of the upper vocal folds while causing the lower folds to be occasionally obscured by the differently-vibrating upper folds. For both ASI and LPD, groups were statistically compared at each line scan position. Frequency results were separated by sex before analyses were performed.
Statistical analysis
Statistical analysis was performed using SigmaPlot 11.0 software (Systat Software, Inc., San Jose, CA). For polyp-nodule comparisons of lateral phase difference, t-tests (and Mann-Whitney rank-sum tests in cases of failure of the Shapiro-Wilk test for normality) were used. For vertical and lateral phase difference, frequency, amplitude order, and ASI group comparisons, one-way analysis of variance (and Friedman analysis of variance on ranks in cases of failure of the Shapiro-Wilk test for normality (p<0.050)) was used. One-way repeated measures analysis of variance was performed to compare amplitude order at the three line scan positions within each group. A significance level of 0.05 was used for all statistical tests.
Box plots were used to graphically display the data obtained from the analyses. The box edges represent the 25th and 75th percentiles, the error bars represent the 10th and 90th percentiles, the line through the box represents the median, and the outer dots represent outliers.
RESULTS
Table 1 shows the results of analysis for vocal fold vibration frequency. After comparing groups separated by sex (to account for the higher fundamental frequency of females versus males and the higher prevalence of nodules in females), no significant differences were found between groups (all p=0.261–0.958).
Table 1.
Frequency group comparisons at the 50% line scan position. Groups were separated by sex.
| Frequency Female | Control | Polyp | Nodule | P |
|---|---|---|---|---|
| 50% | ||||
| LU | 257.471 | 257.571 | 268.063 | 0.702 |
| LL | 256.471 | 257.643 | 270.000 | 0.583 |
| RU | 257.059 | 256.429 | 269.438 | 0.606 |
| RL | 257.706 | 259.071 | 269.938 | 0.660 |
| Frequency Male | ||||
| 50% | ||||
| LU | 170.158 | 190.444 | 0.316 | |
| LL | 170.211 | 192.056 | 0.261 | |
| RU | 170.368 | 191.778 | 0.274 | |
| RL | 170.421 | 192.889 | 0.248 | |
Significant P value
LU, left upper vocal fold lip; LL, left lower; RU, right upper; RL, right lower.
In regards to lateral phase difference, the results of analysis are shown in Figure 3. Polyps showed significantly lower (less symmetrical) values than the control and nodule groups at 25% and 75% (p=0.013 and 0.002, respectively) but not at 50% (p=0.169). Pair wise comparisons between polyps and nodules revealed polyp LPD was significantly lower than nodule LPD at 25% (p=0.022). Controls showed the largest values of LPD at all positions. Mean LPD values for the three groups at the three line scan positions are displayed in Table 2.
Figure 3.

Comparison of upper lateral phase difference of the three groups at each line scan position (C, control; P, polyps; N, nodules).
Table 2.
Lateral phase difference group comparisons by line scan position.
| Lateral Phase Difference | Control | Polyp | Nodule | P |
|---|---|---|---|---|
| 25% RU-LU | 2.635 | 2.181 | 2.700 | *0.013 |
| 50% RU-LU | 2.644 | 2.386 | 2.581 | 0.169 |
| 75% RU-LU | 2.667 | 2.095 | 2.343 | *0.002 |
| Average | 2.648 | 2.227 | 2.546 | *<0.001 |
Significant P value
RU, right upper vocal fold lip; LU, left upper vocal fold lip.
As for vertical phase difference, significant differences were found between controls, nodules, and polyps (when polyps were separated by lesioned and non-lesioned vocal folds) at 50% (with lesioned, p=0.004; with non-lesioned, p=0.003) and 75% (with lesioned, p<0.001; with non-lesioned, p=0.002), but not at 25% (with lesioned, p=0.140; with non-lesioned, p=0.304). No significant differences were found between lesioned and non-lesioned vocal fold VPD with paired t-tests (25%: p=0.882, 50%: p=0.274, 75%: p=0.466). At all positions and on both vocal folds, controls generally showed the largest values of VPD except for the non-lesioned vocal fold at 50%. Mean VPD values for the groups at the three line scan positions are displayed in Table 3.
Table 3.
Vertical phase difference group comparisons by line scan position. Polyps were separated by lesioned and non-lesioned vocal fold.
| Vertical Phase Difference | Control | Polyp | Nodule | P |
|---|---|---|---|---|
| 25% | ||||
| Lesioned VF for polyps | 0.966 | 0.892 | 0.658 | 0.140 |
| Non-lesioned VF for polyps | 0.966 | 0.871 | 0.658 | 0.304 |
| 50% | ||||
| Lesioned VF for polyps | 1.071 | 0.952 | 0.724 | *0.004 |
| Non-lesioned VF for polyps | 1.071 | 1.147 | 0.724 | *0.003 |
| 75% | ||||
| Lesioned VF for polyps | 1.351 | 0.727 | 1.029 | *<0.001 |
| Non-lesioned VF for polyps | 1.351 | 0.814 | 1.029 | *0.002 |
Significant P value
VF, vocal fold.
In assessing ASI through group comparisons, the control group showed significantly smaller (more symmetrical) values at 25% and 50% than polyp and nodule (p<0.001 for both), and differences were nearly significant at 75% (p=0.058). Overall polyp values of ASI, especially at 50%, were larger than those exhibited by nodules and controls, and nodule values were also always greater than control values (Table 4). Results are shown in Figure 4.
Table 4.
Amplitude symmetry index group comparisons by line scan position.
| Amplitude Symmetry Index | Control | Polyp | Nodule | P |
|---|---|---|---|---|
| 25% | 0.0946 | 0.194 | 0.210 | *<0.001 |
| 50% | 0.0942 | 0.273 | 0.152 | *<0.001 |
| 75% | 0.118 | 0.172 | 0.142 | 0.058 |
| Average | 0.102 | 0.215 | 0.168 | *<0.001 |
Significant P value
Figure 4.

Comparison of amplitude symmetry index of the three groups at each line scan position (C, control; P, polyps; N, nodules).
As for amplitude ordering, in control vocal folds, the midpoint usually had the largest amplitude (0.989) with 25% (0.716) and then 75% (0.671) significantly reduced in size (p<0.001). Polyps, separated into lesioned and non-lesioned vocal folds, showed a significant decrease in amplitude along line-scan positions (p<0.001), with 25% usually the largest (lesioned 0.908, non-lesioned 0.931) followed by 50% (lesioned 0.840, non-lesioned 0.893) and then 75% (lesioned 0.726, non-lesioned 0.739). No significant differences were found between lesioned and non-lesioned vocal fold amplitudes with paired t-tests (25%: p=0.917, 50%: p=0.350, 75%: p=0.613). Nodules showed stability between positions, with no significant differences (p=0.735) between 25% (0.886), 50% (0.951) and 75% (0.891). In comparing groups, polyp amplitudes showed the highest percentage of the maximum at 25%, while at 50% and 75%, control and nodules showed the highest percentages, respectively (all p ≤ 0.002) (Table 5).
Table 5.
Amplitude order group comparisons by line scan position. Polyps were separated based on lesioned and non-lesioned vocal fold.
| Amplitude Order | Control | Polyp | Nodule | P |
|---|---|---|---|---|
| 25% | ||||
| Lesioned VF for polyps | 0.716 | 0.908 | 0.886 | *<0.001 |
| Non-lesioned VF for polyps | 0.716 | 0.931 | 0.886 | *<0.001 |
| 50% | ||||
| Lesioned VF for polyps | 0.989 | 0.840 | 0.951 | *<0.001 |
| Non-lesioned VF for polyps | 0.989 | 0.893 | 0.951 | *<0.001 |
| 75% | ||||
| Lesioned VF for polyps | 0.671 | 0.726 | 0.891 | *0.001 |
| Non-lesioned VF for polyps | 0.671 | 0.739 | 0.891 | *0.002 |
| P | *<0.001 | *<0.001 | 0.735 | |
Significant P value
VF, vocal fold.
DISCUSSION
This study assessed 87 subjects in an attempt to delineate differences between normal and pathological groups, in particular vocal fold polyps and nodules, using multi-line DKG. It can be difficult to differentiate between nodules and polyps, although polyps tend to be unilateral whereas nodules are often bilateral. Polyps are considered by some to be on the end of a normal-nodule-polyp continuum;14 Wallis et al.21 propose differentiation on the basis of size, where a biopsy larger than 0.3 cm could be a polyp and a biopsy less than 0.3 cm a nodule. In this study, differentiation between nodules and polyps using multi-line DKG was achieved, as evidenced by amplitude symmetry index, amplitude ordering, and both vertical and lateral phase difference results. Although previous studies have attempted to differentiate polyps and nodules via acoustic methods or clinical visualization techniques,21,22 they have not provided the level of detail which is obtained by differentiating the two disorders using vocal fold vibratory parameters. This result has important ramifications in the clinic, as treatment for nodules versus polyps varies. Sulica et al.23 state that nodules are much more likely to be treated initially with voice therapy than polyps, and that clinicians are more likely to turn to surgery (and potentially voice therapy in conjunction) as a treatment method for polyps. Obtaining a more accurate diagnosis will allow for the selection of proper and necessary treatment and reduce unnecessary interventions.
ASI averages are valid for control, polyp and nodules as control averages were close to zero (0.102), nodules showed a greater average (0.168) and polyps were the largest (0.215). This is physiologically accurate, as polyps are typically unilateral and larger than nodules.16,21 The larger mass of a polyp may immobilize the tissue to a greater degree, leading to lower amplitude on the affected fold and consequently less amplitude symmetry. The clearly larger value of ASI in pathological groups could be useful to differentiate between normal and pathological vibration.
In amplitude ordering, amplitude is usually greatest at the midpoint of the vocal folds, followed by the anterior and finally the posterior third; the posterior third is normally most reduced in amplitude, possibly due to arytenoid damping of vocal fold vibration. While control shows an order of 50-25-75, polyp is ordered 25-50-75 and nodules are relatively stable between line-scan positions. This may be due to the fact that nodules, which can be considered “calluses” of the vocal folds resulting from maximal shearing and collision forces during phonation, induce a greater degree of stiffness along the entire fold than polyps. In vocal folds with nodules, increased stiffness could be attributable to a tissue response that includes denser and more organized collagen deposition at the basement membrane zone than in polyps.15 The polyp results may relate to the reasoning given above for ASI results, namely that the polyp may disrupt the amplitude of the affected fold but to a smaller extent at the 25% line-scan position, which is anchored by the arytenoid cartilages and thus may not be affected by the mass as much as the 50% and 75% positions. The control results differ from the results of Jiang et al.,16 which suggest an order of 50-75-25. However, in that study canine larynges were used, which although considered a good model for human vocal fold vibration, may not be exactly similar to humans in regard to this particular parameter. It is also possible that, in some cases, the most posterior part of the vocal folds was obscured by the arytenoid cartilages during the recording of high speed videos in this study. This could have led to an anterior skew of the 25% position due to a perception that the posterior commissure was anterior to its true position. The anterior skew of the 25% position could have led to artificially large amplitude values at this location. Further work must be done to validate these amplitude order conclusions.
Differentiation between groups was also possible in terms of lateral phase difference, as the control group always showed the largest LPD, indicating that symmetrical vibration was occurring. At all positions, nodules showed similar or lower phase differences than the control group, and polyps had the most reduced LPD, and thus, the least symmetrical vibration out of the groups. This may be due to interference of the polyp with normal symmetry of vibration, which would be expected to be less evident in smaller and typically bilateral nodules. In agreement with our results, Colton et al.13 and Wallis et al.21 found lateral phase asymmetry in vocal folds with polyps.
Vertical phase difference, which can evidence mucosal wave travel as it reflects the time delay in vibration between the lower lip and the upper lip, demonstrated some significant differences. The control group generally showed the largest values of VPD and thus the largest mucosal wave. It is interesting that the polyp group showed larger values than nodules but similar values to controls at 50% and that the nodule group showed larger VPD than polyps but smaller than controls at 75%. This may be due to the stiffness of the vocal fold(s) with the lesion. The generally smaller VPD values of nodules as compared to polyps and controls is consistent with the hypothesis that nodules are stiff benign lesions formed due to long-term maximal impact forces on the vocal folds and polyps are formed more often due to breakage of a capillary in Reinke’s space with ensuing blood extravasation and localized edema, often attributable to intense intermittent voice abuse or other vocal trauma such as endotracheal intubation;15 the polyp does not affect mucosal wave to the extent that nodules do.
Vocal fold vibration frequency did not show any significant differences between groups. In general, within sexes at all vocal fold lips, frequencies were quite similar. It is unlikely that polyps and nodules affect pitch as much as other intrinsic properties of the larynx such as vocal fold length and laryngeal muscle actions. Even if polyps and nodules do affect pitch, it would be difficult to prove in this study because it was not possible to control these other intrinsic properties whose natural variation and the ensuing effects on vibration overshadow more minor changes in vibration due to the vocal fold lesion.
The use of three line-scan positions shows significant differences between vibratory characteristics of the vocal folds, as it was possible to assess not just right-left symmetry but also anterior-posterior symmetry. This is important because asymmetry is often an indicator of laryngeal abnormalities. Overall, it appears that the 25% line-scan position often evidenced significant differences between vocal folds with nodules and polyps in several parameters, especially lateral phase difference. Our results show that vocal folds with nodules increase in lateral phase symmetry in an anterior to posterior direction. Vocal folds with polyps did not exhibit this increase, as the 25% line-scan position showed a low degree of lateral phase symmetry. This difference may be caused by the unilateral and bilateral nature of polyps and nodules, respectively. At sites far from the location of the polyp, asymmetry of vibration is still observed because only one side is affected. However, with nodules, the lesions cause similar effects on the right and left sides, leading to a higher degree of symmetry across the length of the vocal folds. The increase in phase symmetry towards the posterior end of the vocal folds in nodules may be explained by the presence of an “hourglass” vocal fold closure pattern24 and the effect of mucus on vibration. It has been reported that patients with nodules commonly accumulate mucus at the site of the nodules, inducing irregular vibration.25 This local effect may cause lateral phase asymmetry that affects the nearby line scan locations of 50% and 75%. It is unlikely to have the same impact on the 25% position because it is further away and because the vocal folds rarely close completely at this location, making it easier to avoid the adhesive effect of mucus accumulation on the vocal folds and the subsequent irregular vibration.
Vibratory parameters defined in many studies are typically qualitative, and because different studies use different rating scales and judges, measurements cannot be easily compared between studies. Many previous studies call for the establishment of norms for parameters to provide a basis on which to characterize pathologies and prevent unnecessary diagnoses and treatments due to false alarms from high-speed imaging data. Thus, quantitative measures must be established to provide information on the type and extent of disorder and which treatment should be used accordingly. We improve on previous observations and provide quantitative data on variations between normal and pathological voices.
A limitation of our study was the inability to compare exact vocal fold vibration amplitudes between groups due to the lack of vocal fold length data. Instead, we used relative comparisons such as ASI and amplitude ordering, which still give useful information but not exact values in centimeters or millimeters. Previous studies have used a fairly reliable equation relating height to vocal fold length;20 however, this is by no means a direct measurement and further studies must be done to develop a better method to obtain vocal fold lengths directly. For some time, the use of lasers has been proposed by using a calibrated distance to establish length.26,27 This would allow amplitude data to be objectively collected, allowing for the comparison of amplitudes between patients rather than simply studying relative comparisons such as amplitude symmetry. As vocal fold nodules are a disorder that primarily affects females,15 the lack of data from males with nodules prevented certain comparisons in this study, especially of frequency; in the future, more data on this will be obtained to better assess possible gender differences in males and females with nodules.
In some instances, the 75% position was not visible in the high speed video due to difficulty in endoscopy. Additionally, this position showed period doubling and tripling in some videos, indicating irregular vibrations. In these cases, the data could not be compared with normal periodic vibration and were omitted.
The addition of an objective line-scan position selection feature to the custom MATLAB program reduces possible user bias in the program and increases the precision and accuracy of the program, allowing for better results and broader application of these results. Future studies will assess more useful applications of this program.
Finally, future studies should explore this technique in the clinic for use in determining a treatment plan for the patient. With better definition of what is normal versus abnormal, treatment plans can be selected more effectively and the success or failure of a treatment can be evaluated by comparing outcomes with normal values. This quantitative method of measuring vibratory parameters of vocal folds should be extended to additional human subjects and other pathologies, including vocal fold paralyses, scarring, and edema. Furthermore, kymography should be done with the use of a laser on the endoscope to estimate vocal fold length. Having the ability to perform quantitative kymographic analysis in the clinic could lead to an objective way to detect and distinguish normal and pathological vocal folds, along with differentiating between specific pathologies. Since treatments for pathologies such as vocal fold polyps and nodules differ, differentiation between them is important. The additional parameter information reported in this study may help clinicians recognize vibratory dynamics of vocal fold pathology more directly and effectively, increasing the value of digital kymography in the clinic.
CONCLUSION
The vibratory characteristics of normal and pathological vocal folds were quantitatively examined and compared using multi-line DKG. Significant differences were noted between control, healthy vocal folds and those with either nodules or polyps under the vibratory parameters of amplitude symmetry index, amplitude ordering, and vertical and lateral phase difference. The 25% line-scan position, which is located midway between the midpoint of the vocal fold and the posterior commissure, allowed for differentiation between polyp and nodule groups. Frequency did not evidence significant differences between groups. These findings may allow for better characterization of pathologies using digital kymography and, with time and improving technology, will assist in improving its clinical utility.
Acknowledgments
This research was supported by NIH grant number R01 DC008850 from the National Institute on Deafness and Other Communication Disorders.
Footnotes
The authors have no other funding, financial relationships, or conflicts of interest to disclose.
References
- 1.Haben CM, Kost K, Papagiannis G. Mucosal wave asymmetries in the clinical voice laboratory. J Otolaryngol. 2002;31:275–80. doi: 10.2310/7070.2002.43298. [DOI] [PubMed] [Google Scholar]
- 2.Patel R, Dailey S, Bless D. Comparison of high-speed digital imaging with stroboscopy for laryngeal imaging of glottal disorders. Ann Otol Rhinol Laryngol. 2008;117:413–424. doi: 10.1177/000348940811700603. [DOI] [PubMed] [Google Scholar]
- 3.Farnsworth DW. High speed motion pictures of the human vocal cords. Bell Laboratories Records. 1940;18:203–208. [Google Scholar]
- 4.Larsson H, Hertegard S, Lindestad PA, Hammarberg B. Vocal fold vibrations: high-speed imaging, kymography, and acoustic analysis: a preliminary report. Laryngoscope. 2000;110:2117–2122. doi: 10.1097/00005537-200012000-00028. [DOI] [PubMed] [Google Scholar]
- 5.Jiang JJ, Chang CI, Raviv JR, Gupta S, Banzali FM, Hanson DG. Quantitative study of mucosal wave via videokymography in canine larynges. Laryngoscope. 2000;110:1567–1573. doi: 10.1097/00005537-200009000-00032. [DOI] [PubMed] [Google Scholar]
- 6.Svec JG, Sram F, Schutte HK. Videokymography in voice disorders: what to look for? Ann Otol Rhinol Laryngol. 2007;116:172–180. doi: 10.1177/000348940711600303. [DOI] [PubMed] [Google Scholar]
- 7.Qiu Q, Schutte HK, Gu L, Yu Q. An automatic method to quantify the vibration properties of human vocal folds via videokymography. Folia Phoniatr Logop. 2003;55:128–136. doi: 10.1159/000070724. [DOI] [PubMed] [Google Scholar]
- 8.Qiu Q, Schutte H. Real-time kymographic imaging for visualizing human vocal-fold vibratory function. Rev Sci Instrum. 2007;78:024302. doi: 10.1063/1.2430622. [DOI] [PubMed] [Google Scholar]
- 9.Krausert CR, Olszewski AE, Taylor LN, McMurray JS, Dailey SH, Jiang JJ. Mucosal wave measurement and visualization techniques. J Voice. 2010 May 14; doi: 10.1016/j.jvoice.2010.02.001. [Epub ahead of print] [DOI] [PMC free article] [PubMed] [Google Scholar]
- 10.Wittenberg T, Tigges M, Mergell P, Eysholdt U. Functional imaging of vocal fold vibration: digital multislice high-speed kymography. J Voice. 2000;14:422–442. doi: 10.1016/s0892-1997(00)80087-9. [DOI] [PubMed] [Google Scholar]
- 11.Eysholdt U, Rosanowski F, Hoppe U. Vocal fold vibration irregularities caused by different types of laryngeal asymmetry. Eur Arch Otorhinolaryngol. 2003;260:412–417. doi: 10.1007/s00405-003-0606-y. [DOI] [PubMed] [Google Scholar]
- 12.Krausert CR, Ying D, Zhang Y, Jiang JJ. Quantitative Study of Vibrational Symmetry of Injured Vocal Folds Via Digital Kymography in Excised Canine Larynges. J Speech Lang Hear Res. 2010 Dec 20; doi: 10.1044/1092-4388(2010/10-0105). [Epub ahead of print] [DOI] [PMC free article] [PubMed] [Google Scholar]
- 13.Colton RH, Woo P, Brewer DW, Griffin B, Casper J. Stroboscopic signs associated with benign lesions of the vocal folds. J Voice. 1995;9:312–325. doi: 10.1016/s0892-1997(05)80240-1. [DOI] [PubMed] [Google Scholar]
- 14.Chau HN, Desai K, Georgalas C, Harries M. Variability in nomenclature of benign laryngeal pathology based on video laryngoscopy with and without stroboscopy. Clin Otolaryngol. 2005;30:424–427. doi: 10.1111/j.1365-2273.2005.01074.x. [DOI] [PubMed] [Google Scholar]
- 15.Altman KW. Vocal fold masses. Otolaryngol Clin N Am. 2007;40:1091–1108. doi: 10.1016/j.otc.2007.05.011. [DOI] [PubMed] [Google Scholar]
- 16.Jiang JJ, Zhang Y, Kelly MP, Bieging ET, Hoffman MR. An Automatic Method to quantify mucosal waves via videokymography. Laryngoscope. 2008;118:1504–1510. doi: 10.1097/MLG.0b013e318177096f. [DOI] [PMC free article] [PubMed] [Google Scholar]
- 17.Zhang Y, Jiang JJ, Tao C, Bieging E, MacCallum JK. Quantifying the complexity of excised larynx vibrations from high-speed imaging using spatiotemporal and nonlinear dynamic analyses. Chaos. 2007;17:043114. doi: 10.1063/1.2784384. [DOI] [PubMed] [Google Scholar]
- 18.Zhang Y, Bieging E, Tsui H, Jiang JJ. Efficient and effective extraction of vocal fold vibratory patterns from high-speed digital imaging. J Voice. 2010;24:21–29. doi: 10.1016/j.jvoice.2008.03.003. [DOI] [PMC free article] [PubMed] [Google Scholar]
- 19.Sulter AM, Schutte HK, Miller DG. Standardized laryngeal videostroboscopic rating: differences between untrained and trained male and female subjects, and effects of varying sound intensity, fundamental frequency, and age. J Voice. 1996;10:175–189. doi: 10.1016/s0892-1997(96)80045-2. [DOI] [PubMed] [Google Scholar]
- 20.Filho JA, de Melo EC, Tsuji DH, de Giacomo Carniero C, Sennes LU. Length of the human vocal folds: proposal of mathematical equations as a function of gender and body height. Ann Otol Rhinol Laryngol. 2005;114:390–392. doi: 10.1177/000348940511400510. [DOI] [PubMed] [Google Scholar]
- 21.Wallis L, Jackson-Menaldi C, Holland W, Giraldo A. Vocal fold nodule vs. vocal fold polyp: answer from surgical pathologist and voice pathologist point of view. J Voice. 2004;18:125–129. doi: 10.1016/j.jvoice.2003.07.003. [DOI] [PubMed] [Google Scholar]
- 22.Behroozmand R, Almasganj F, Hassan Moradi M. Pathological assessment of vocal fold nodules and polyp using acoustic perturbation and phase space features. International conference on acoustics, speech, and signal processing; May 2006; p. II. [Google Scholar]
- 23.Sulica L, Behrman A. Management of benign vocal fold lesions: a survey of current opinion and practice. Ann Otol Rhinol Laryngol. 2003;112:827–833. doi: 10.1177/000348940311201001. [DOI] [PubMed] [Google Scholar]
- 24.Dejonckere PH, Kob M. Pathogenesis of vocal fold nodules: new insights from a modeling approach. Folia Phoniatr Logop. 2009;61:171–179. doi: 10.1159/000219952. [DOI] [PubMed] [Google Scholar]
- 25.Hsiung MW. Videolaryngostroboscopic observation of mucus layer during vocal cord vibration in patients with vocal nodules before and after surgery. Acta Otolaryngol. 2004;124:186–191. doi: 10.1080/00016480310014859. [DOI] [PubMed] [Google Scholar]
- 26.Schade G, Leuwer R, Kraas M, Rassow B, Hess MM. Laryngeal morphometry with a new laser ‘clip on’ device. Lasers Surg Med. 2004;34:363–367. doi: 10.1002/lsm.20065. [DOI] [PubMed] [Google Scholar]
- 27.Wurzbacher T, Voigt I, Schwarz R, Döllinger M, Hoppe U, Penne J, Eysholdt U, Lohscheller J. Calibration of laryngeal endoscopic high-speed image sequences by an automated detection of parallel laser line projections. Med Image Anal. 2008;12:300–317. doi: 10.1016/j.media.2007.12.007. [DOI] [PubMed] [Google Scholar]