

Abstract
Arterial spin labelling (ASL) is increasingly available for noninvasive cerebral blood flow (CBF) measurement in stroke research. Here, a pseudo-continuous ASL technique (pCASL) was evaluated against 99mTc-D, L-hexamethylpropyleneamine oxime (99mTc-HMPAO) autoradiography in a rat stroke model. The 99mTc-HMPAO was injected (intravenously, 225 MBq) during pCASL acquisition. The pCASL and 99mTc-HMPAO autoradiography CBF measures, relative to the contralateral hemisphere, were in good agreement across the spectrum of flow values in normal and ischemic tissues. The pCASL-derived quantitative regional CBF values (contralateral: 157 to 177 mL/100 g per minute; ipsilateral: 9 to 104 mL/100 g per minute) were consistent with the literature values. The data show the potential utility of pCASL for CBF assessment in a rat stroke model.
Keywords: ASL, CBF, stroke
Introduction
Arterial spin labelling (ASL) techniques are increasingly used for noninvasive cerebral blood flow (CBF) measurement in preclinical stroke research due to increased availability of small animal magnetic resonance imaging (MRI) scanners. One major advantage ASL has over other MRI CBF techniques is that circulating blood acts as an endogenous contrast agent enabling repeat noninvasive serial scanning of CBF within subjects and inclusion of CBF as part of a multimodal MRI assessment. Despite the application of ASL techniques in preclinical stroke research (Zaharchuk et al, 2000), few studies have attempted to compare and evaluate these techniques with established (nonMRI) blood flow techniques.
Continuous ASL CBF measurements have previously been compared with radiolabelled microsphere and quantitative 14C-iodoantipyrine autoradiography techniques. Continuous ASL underestimated CBF at high flow rates when compared against radiolabelled microspheres (Walsh et al, 1994) while a 30% overestimation of CBF was showed when compared against autoradiographic measurement of CBF (Ewing et al, 2003). A similar CBF overestimation was reported in mice when comparing pulsed ASL with 14C-iodoantipyrine autoradiography (Leithner et al, 2008). Pseudo-continuous ASL (pCASL) could have greater utility than other ASL techniques but, to our knowledge, has not been evaluated against nonMRI methods. Using a single coil excitation system, we have implemented a modified version of pCASL originally proposed by Moffat et al (2005), using an echo planar imaging (EPI) module that matches the diffusion-weighted imaging (DWI) sequence. This allows more rapid acquisition and produces images readily coaligned with DWI images and apparent diffusion coefficient (ADC) maps, without requiring any additional hardware. To confirm feasibility of pCASL imaging in rodent stroke studies, we examined the validity of pCASL CBF measurements by direct comparison with simultaneous assessment of CBF using 99mTc-D, L-hexamethylpropyleneamine oxime (99mTc-HMPAO) autoradiography.
Materials and methods
Animals
All experiments were performed in male Sprague-Dawley rats (n=8, 300 to 350 g; Harlan, Belton, Leicestershire, UK) under license from the UK Home Office and were subject to the Animals (Scientific Procedures) Act, 1986.
Middle Cerebral Artery Occlusion
Animals were intubated, artificially ventilated and permanent middle cerebral artery occlusion (MCAO) was performed under isoflurane anesthesia (5% induction, 2% to 2.5% maintenance, in 70% N2O/30% O2) using a modified version of the intraluminal filament model (Longa et al, 1989). Femoral arteries and veins were cannulated for measurement of blood pressure, arterial blood gas measurement, and intravenous administration of 99mTc-HMPAO. Blood pressure and heart rate were continuously recorded using a data acquisition and analysis system (AcqKnowledge, Biopac Systems, Goleta, CA, USA).
Cerebral Blood Flow Measurement with Pseudo-Continuous Arterial Spin Labelling-Magnetic Resonance Imaging
Magnetic resonance imaging was performed on a Bruker Biospec (Bruker Biospin, Ettlingen, Germany) 7-T/30-cm system with a gradient insert (121 mm internal diameter, 400 mT/m) and a 72-mm birdcage resonator. An actively decoupled linear receive only surface coil (2 cm diameter) was used for brain imaging. Immediately after MCAO surgery, animals were secured in a rat cradle with the surface coil placed above the head, and transferred to the MRI scanner.
Quantitative determination of the ADC was performed ∼75 minutes after MCAO using a 4-shot spin-echo EPI DWI sequence (echo time 22.5 ms; repetition time 4000.3 ms; 4 averages; matrix 96 × 96; field of view 25 × 25 mm; 3 directions x, y, z; b values 0 and 1,000 s/mm2; 8 contiguous slices; 1 mm thickness, scan time 2 minutes 8 seconds) to track the evolution of ischemic damage. The CBF measurements on four coronal slices (matching the middle four DWI slices) were performed ∼80 minutes after MCAO using a pCASL sequence based on a train of adiabatic inversion pulses (Moffat et al, 2005). The sequence uses a spin-echo EPI imaging module (echo time 20 ms, repetition time 7,000 ms, matrix 96 × 96, field of view 25 × 25 mm, slice thickness 1.5 mm, 16 averages, 4 shots) preceded by 50 hyperbolic secant inversion pulses in a 3-second train (scan time 8 minutes 32 seconds). Inversion pulse frequency offset and gradient strength were set to provide 10 mm wide label/control bands centered at ±30 mm from the center of the imaging slice. T1 parameter maps were also acquired, using an EPI inversion recovery sequence (imaging parameters as above, repetition time 10,000 ms, using 16 inversion times from 200 to 7,700 ms, scan time 10 minutes 40 seconds). Quantitative CBF maps (units: mL/100 g per minute) were calculated using the formula for continuous labelling (Williams et al, 1992)
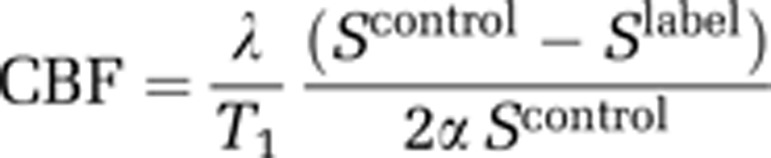 |
where α is the inversion pulse efficiency (0.79, taken from Moffat et al, 2005), λ is the blood tissue partition function (assumed to be 0.9). Scontrol and Slabel are the signal intensity from the control and labelled images, acquired with inversion pulses applied above the head and in the neck, respectively.
Acquisition of ASL maps under no-flow conditions (postmortem scans, n=7) revealed an offset of ASL-derived CBF measurements (43, 48, 39, and 46 mL/100 g per minute for slices 1 to 4, respectively). Subsequent improvements to the ASL sequence have improved cancellation of magnetization transfer effects and removed the need for such offsets. Negative perfusion values were generated in some pixels with low or zero flow (3/8 rats) as a consequence of subtracting the magnitude images (Scontrol and SLabel), where the signal difference was comparable to image noise (Karlsen et al, 1999). Negative ASL CBF values were assumed to be zero.
Coaligned images from DWI and perfusion-weighted imaging (PWI) were used to generate diffusion/perfusion (DWI/PWI) mismatch maps on which regions of interest (ROIs) for DWI/PWI mismatch and ischemic caudate nucleus (IC) (within DWI lesion) were determined (Figure 1A). The mismatch was defined using previously published ADC (0.53 × 10⁻³ mm2/s) and CBF (30 mL/100 g per minute) thresholds (Shen et al, 2003) using ImageJ software (US National Institutes of Health, Bethesda, MD, USA; http://rsb.info.nih.gov/ij/).
Figure 1.

(A) Representative rat coronal slices spanning MCA territory (rostrocaudally) showing, RARE T2, 99mTc HMPAO autoradiography, ASL, ADC (from DWI), and DWI/PWI mismatch (MM) images. Using neuroanatomical landmarks, RARE T2 images (rostrocaudal distance ∼2 mm anterior to 4.0 mm posterior to bregma) were used to select autoradiography sections that spatially matched ASL images. ADC maps generated from DWI show the ischemic lesion (in black). The ADC lesion is superimposed on top of the perfusion deficit identified from the ASL scan to reveal the DWI/PWI MM (white) and ischemic caudate nucleus (IC) (black) ROIs on MRI images. (B) Illustration from the rat stereotaxic atlas (Paxinos and Watson, 2007) at the level of slice 1 (2 mm anterior to bregma) showing six ROIs where cerebral blood flow (CBF) was measured by MRI and autoradiography: contralateral motor cortex (MCtx); sensorimotor cortex (SSCtx); caudate putamen (CPu); ipsilateral motor cortex (ipsi MCtx); DWI/PWI MM; and IC. ADC, apparent diffusion coefficient; ASL, arterial spin labelling; AR, autoradiography; DWI, diffusion-weighted imaging; MCA, middle cerebral artery; MRI, magnetic resonance imaging; PWI, perfusion-weighted imaging; RARE, Rapid Acquisition with Relaxation Enhancement; ROIs, regions of interest.
Cerebral Blood Flow Measurement with 99mTc-D, L-Hexamethylpropyleneamine Oxime Autoradiography
The 99mTc-HMPAO autoradiography was conducted as previously described (Gartshore et al, 1997). The 99mTc-HMPAO (225 MBq) was injected intravenously in 0.8 mL isotonic saline halfway through the ASL scanning protocol. After MRI scanning, rats were killed by decapitation, brains removed and 30 μm cryostat sections cut at −20°C. Sections were exposed to Kodak Biomax MR film alongside precalibrated 14C standards (21,330 to 174,290 nCi/g 99mTc tissue equivalents) for 1 hour. The 99mTc-HMPAO tissue concentrations were analyzed on an image analysis system (MCID; Imaging Research, Linton, Cambridge, UK) and a linearization correction applied as previously described (Lassen et al, 1988).
Analysis of Magnetic Resonance Imaging and Autoradiography Cerebral Blood Flow Data
Four coronal (1.5 mm) ASL slices spanning MCA territory were selected for analysis (Figure 1A). For each of the four MRI slices, data from five consecutive autoradiographic sections (30 μm) were selected using neuroanatomical landmarks from the Rapid Acquisition with Relaxation Enhancement T2 images, analyzed, and averaged. Cerebral blood flow was assessed in the following ROIs (∼1.5 mm2): (1) ipsilateral motor cortex (ipsi MCtx); (2) DWI/PWI mismatch (MM); (3) ischemic caudate nucleus (IC, ADC lesion); (4) contralateral motor cortex (MCtx); (5) sensorimotor cortex (SSCtx); and (6) caudate putamen (CPu) (Figure 1B). The CBF measurements within each ROI were expressed as a % of mean contralateral hemisphere CBF. Since ROI CBF values were similar across the slices examined for both MRI and autoradiography, measurements for each ROI were averaged over the slices for each CBF method.
Statistical Analysis
Statistical analysis was performed using GraphPad Prism (La Jolla, CA, USA). Data are presented as mean±s.d. Differences in relative CBF values between ASL-MRI and 99mTc-HMPAO autoradiography were assessed using a two-tailed paired Student's t-test. A Bland Altman plot was used to evaluate agreement between ASL-MRI and 99mTc-HMPAO autoradiography relative CBF values. P<0.05 was considered statistically significant.
Results
Physiological variables remained within normal levels during stroke surgery and MRI scanning. Mean time to inject 99mTc-HMPAO was 105±15 minutes after MCAO, during pCASL scanning. The pCASL blood flow maps showed good spatial resolution with clear differences in CBF distinguishable between gray and white matter and ischemic versus contralateral hemispheres (Figure 1A). The pCASL and 99mTc-HMPAO images showed a similar pattern of reduced blood flow within the ischemic hemisphere.
The mean relative CBF values obtained from pCASL CBF and 99mTc-HMPAO autoradiography were similar across all ROIs analyzed except the CPu, where a small but statistically significant difference was observed (P=0.014; Figure 2A). In regions of mild, moderate, and severe hypoperfusion, pCASL showed similar reductions in CBF to that observed with 99mTc-HMPAO autoradiography (ipsi MCtx; 65±18% versus 67±17%, MM; 26±13% versus 18±9%, IC; 6±4% versus 5±6% of equivalent contralateral hemisphere for 99mTc-HMPAO autoradiography and pCASL CBF, respectively). The Bland Altman plot reveals a broad agreement between ASL and 99mTc-HMPAO autoradiography. The majority of points lie below zero, indicating that ASL values tend to be slightly lower than autoradiography values (Figure 2B). In addition, pCASL can generate CBF maps in absolute units of mL/100 g per minute. The CBF values in ROIs were 170±21, 177±28, and 157±20 mL/100 g per minute in contralateral MCtx, SSCtx, and CPu, respectively, and 104±24, 28±12, and 9±9 mL/100 g per minute in ipsi MCtx, MM, and IC, respectively.
Figure 2.

(A) CBF values for 99mTc-HMPAO autoradiography and pCASL in the six ROIs (average over four slices (three slices for IC and CPu), mean±s.d.). Blood flow measurements were not significantly different between AR and ASL in ROIs apart from CPu. Two-tailed paired Student's t-test: contralateral motor cortex (MCtx), P=0.83; sensorimotor cortex (SSCtx), P=0.93; CPu, *P=0.014; ipsilateral motor cortex (ipsi MCtx), P=0.83; DWI/PWI mismatch (MM), P=0.17; IC, P=0.35. (B) There is broad agreement between AR and ASL measurements on the Bland Altman plot (data averaged across slices), although ASL values tend to be slightly lower than AR values. AR, autoradiography; ASL, arterial spin labelling; CBF, cerebral blood flow; CPu, caudate putamen; DWI, diffusion-weighted imaging; IC, ischemic caudate nucleus; PWI, perfusion-weighted imaging; pCASL, pseudo-continuous ASL; ROIs, regions of interest; 99mTc-HMPAO, 99mTc-D, L-hexamethylpropyleneamine oxime.
Discussion
To date evaluation of ASL techniques in animal models of cerebral pathology have been limited (Ewing et al, 2003; Leithner et al, 2008); yet, these techniques are increasingly used in preclinical studies of cerebrovascular disease including stroke where CBF is used in the DWI/PWI mismatch technique to define the ischemic penumbra. Here, we modified a pCASL sequence which, unlike the original proposed by Moffat et al (2005), uses an EPI imaging module, to match that of the DWI sequence, producing faster CBF images which coregister with DWI/ADC maps.
The 99mTc-HMPAO autoradiography is also used to measure CBF in rodent stroke studies (Bullock et al, 1991; Gartshore et al, 1997; Lythgoe et al, 1999). Although terminal and semiquantitative, this technique has a number of advantages when assessing cerebral ischemia and for comparison with MRI CBF measurement: (1) it produces CBF autoradiograms with sharp definition of ischemic tissue due to the rapid trapping of the radioisotope within tissues; (2) autoradiograms can be generated to match the same coronal levels as MRI slices; and (3) 99mTc-HMPAO can be injected during the pCASL scanning protocol allowing direct comparison of CBF measurements at the same time point within the same animal.
The two techniques were compared using a rat focal ischemia model to generate CBF values ranging from little or no flow in IC to normal flow in the contralateral hemisphere. Using thresholded DWI/PWI mismatch maps, we delineated three tissue compartments in the ischemic hemisphere: (1) mild hypoperfusion in ipsi MCtx, adjacent to DWI/PWI mismatch; (2) DWI/PWI mismatch (SSCtx) within DWI/PWI mismatch region; and (3) ischemic caudate nucleus (IC) within the ADC-defined lesion.
The MRI data mirrored relative CBF measured in the same ROI on 99mTc-HMPAO autoradiograms showing a broad agreement between the techniques across a range of CBF values. However, we detected a small discrepancy in CBF values between the two techniques in the most ventral ROI in CPu. The lower flow values recorded with ASL may reflect the lower signal-to-noise ratio due to distance from head coil, highlighting a limitation of the hardware rather than the technique.
Additionally, semi quantitative (% mean contralateral hemisphere) and quantitative CBF measurements in mL/100 g per minute generated from pCASL corresponded well with published values (Moffat et al, 2005; Bullock et al, 1991; Ewing et al, 2003; Tamura et al, 1981). For example, CBF values of 166 mL/100 g per minute in a single slice across the whole hemisphere (Moffat et al, 2005) and the following values from 14C-iodoantipyrine autoradiography in rodent focal cerebral ischemia models: cingulate cortex: 198 mL/100 g per minute; parietal cortex: 151 mL/100 g per minute; and CPu: 163 mL/100 g per minute; ipsilateral cingulate cortex: 94 mL/100 g per minute; ipsilateral SSCtx: 22 to 37 mL/100 g per minute; IC: 6 to 20 mL/100 g per minute (Bullock et al, 1991; Ewing et al, 2003; Leithner et al, 2008).
In conclusion, ASL is increasingly available for noninvasive CBF measurement in stroke research. Here, semiquantitative assessment of CBF by pCASL and 99mTc-HMPAO autoradiography revealed a good agreement between the two techniques. Although HMPAO has higher sensitivity and spatial resolution, pCASL has the advantage of being noninvasive, suitable for repeat measurement and is potentially quantitative. The fact that pCASL can be implemented without additional MRI hardware means it has potential preclinical utility in assessing blood flow in animal models of acute stroke.
Acknowledgments
The authors thank Mr Jim Mullin and Mrs Linda Carberry for technical assistance involving MRI scanning and tissue sectioning.
The authors declare no conflict of interest.
Footnotes
This work was supported by an award (Ref: NS-GU-122) from the Translational Medicine Research Collaboration—a consortium of the Universities of Aberdeen, Dundee, Edinburgh and Glasgow, Grampian, Tayside, Lothian and Greater Glasgow and Clyde NHS Health Boards, Scottish Enterprise, and Wyeth Pharmaceuticals. Christopher Weir was supported in part by the Edinburgh MRC Hub for Trials Methodology Research.
References
- Bullock R, Patterson J, Park C. Evaluation of Tc-99M-hexametylpropyleneamine oxime cerebral blood-flow mapping after acute focal ischemia in rats. Stroke. 1991;22:1284–1290. doi: 10.1161/01.str.22.10.1284. [DOI] [PubMed] [Google Scholar]
- Ewing JR, Wei L, Knight RA, Pawa S, Nagaraja TN, Brusca T, Divine GW, Fenstermacher JD. Direct comparison of local cerebral blood flow rates measured by MRI arterial spin-tagging and quantitative autoradiography in a rat model of experimental cerebral ischemia. J Cereb Blood Flow Metab. 2003;23:198–209. doi: 10.1097/01.WCB.0000046147.31247.E8. [DOI] [PubMed] [Google Scholar]
- Gartshore G, Patterson J, Macrae IM. Influence of ischemia and reperfusion on the course of brain tissue swelling and blood-brain barrier permeability in a rodent model of transient focal cerebral ischemia. Exp Neurol. 1997;147:353–360. doi: 10.1006/exnr.1997.6635. [DOI] [PubMed] [Google Scholar]
- Karlsen OT, Verhagen R, Bovee WMMJ. Parameter estimation from Rician-distributed data using a maximum likelihood estimator: application to T-1 and perfusion measurements. Magn Reson Med. 1999;41:614–623. doi: 10.1002/(sici)1522-2594(199903)41:3<614::aid-mrm26>3.0.co;2-1. [DOI] [PubMed] [Google Scholar]
- Lassen NA, Andersen AR, Friberg L, Paulson OB. The retention of [99mTc]-d,l-HM-PAO in the human brain after intracarotid bolus injection: a kinetic analysis. J Cereb Blood Flow Metab. 1988;8:S13–S22. doi: 10.1038/jcbfm.1988.28. [DOI] [PubMed] [Google Scholar]
- Leithner C, Gertz K, Schroeck H, Priller J, Prass K, Steinbrink J, Villringer A, Endres M, Lindauer U, Dirnagl U, Royl G. A flow sensitive alternating inversion recovery (FAIR)-MRI protocol to measure hemispheric cerebral blood flow in a mouse stroke model. Exp Neurol. 2008;210:118–127. doi: 10.1016/j.expneurol.2007.10.003. [DOI] [PubMed] [Google Scholar]
- Longa EZ, Weinstein PR, Carlson S, Cummins R. Reversible middle cerebral-artery occlusion without craniectomy in rats. Stroke. 1989;20:84–91. doi: 10.1161/01.str.20.1.84. [DOI] [PubMed] [Google Scholar]
- Lythgoe MF, Williams SR, Busza AL, Wiebe L, Mcewan AJB, Gadian DG, Gordon I. The relationship between magnetic resonance diffusion imaging and autoradiographic markers of cerebral blood flow and hypoxia in an animal stroke model. Magn Reson Med. 1999;41:706–714. doi: 10.1002/(sici)1522-2594(199904)41:4<706::aid-mrm8>3.0.co;2-8. [DOI] [PubMed] [Google Scholar]
- Moffat BA, Chenevert TL, Hall DE, Rehemtulla A, Ross BD. Continuous arterial spin labeling using a train of adiabatic inversion pulses. J Magn Reson Imaging. 2005;21:290–229. doi: 10.1002/jmri.20268. [DOI] [PubMed] [Google Scholar]
- Paxinos G, Watson CRR. The Rat Brain in Stereotaxic Coordinates. Amsterdam: Elsevier; 2007. [Google Scholar]
- Shen Q, Meng TJ, Sotak CH, Duong TQ. Pixel-by-pixel spatiotemporal progression of focal ischemia derived using quantitative perfusion and diffusion imaging. J Cereb Blood Flow Metab. 2003;23:1479–1488. doi: 10.1097/01.WCB.0000100064.36077.03. [DOI] [PMC free article] [PubMed] [Google Scholar]
- Tamura A, Graham DI, Mcculloch J, Teasdale GM. Focal cerebral-ischemia in the rat: 2. Regional cerebral blood-flow determined by [14C]iodoantipyrine autoradiography following middle cerebral-artery occlusion. J Cereb Blood Flow Metab. 1981;1:61–69. doi: 10.1038/jcbfm.1981.7. [DOI] [PubMed] [Google Scholar]
- Walsh EG, Minematsu K, Leppo J, Moore SC. Radioactive microsphere validation of a volume localized continuous saturation perfusion measurement. Magn Reson Med. 1994;31:147–153. doi: 10.1002/mrm.1910310208. [DOI] [PubMed] [Google Scholar]
- Williams DS, Detre JA, Leigh JS, Koretsky AP. Magnetic-resonance-imaging of perfusion using spin inversion of arterial water. Proc Natl Acad Sci USA. 1992;89:212–216. doi: 10.1073/pnas.89.1.212. [DOI] [PMC free article] [PubMed] [Google Scholar]
- Zaharchuk G, Yamada M, Sasamata M, Jenkins BG, Moskowitz MA, Rosen BR. Is all perfusion-weighted magnetic resonance imaging for stroke equal? The temporal evolution of multiple hemodynamic parameters after focal ischemia in rats correlated with evidence of infarction. J Cereb Blood Flow Metab. 2000;20:1341–1351. doi: 10.1097/00004647-200009000-00009. [DOI] [PubMed] [Google Scholar]