Abstract
Optical imaging of changes in total hemoglobin concentration (HbT), cerebral blood volume (CBV), and hemoglobin oxygen saturation (SO2) provides a means to investigate brain hemodynamic regulation. However, high-resolution transcranial imaging remains challenging. In this study, we applied a novel functional photoacoustic microscopy technique to probe the responses of single cortical vessels to left forepaw electrical stimulation in mice with intact skulls. Functional changes in HbT, CBV, and SO2 in the superior sagittal sinus and different-sized arterioles from the anterior cerebral artery system were bilaterally imaged with unambiguous 36 × 65-μm2 spatial resolution. In addition, an early decrease of SO2 in single blood vessels during activation (i.e., ‘the initial dip') was observed. Our results indicate that the initial dip occurred specifically in small arterioles of activated regions but not in large veins. This technique complements other existing imaging approaches for the investigation of the hemodynamic responses in single cerebral blood vessels.
Keywords: cerebral blood volume, forepaw electrical stimulation, hemodynamic response, hemoglobin oxygen saturation, total hemoglobin concentration, transcranial photoacoustic microscopy
Introduction
Optical imaging techniques, such as diffusion optical imaging (DOI) (Siegel et al, 2003) and laser speckle imaging (LSI) (Li et al, 2009), have been increasingly used to study brain functions in vivo (Hillman, 2007). These techniques provide outstanding sensitivity to hemodynamic changes either via intrinsic contrast in absorption and scattering or extrinsic contrast (Malonek and Grinvald, 1996). The DOI technique is capable of noninvasively assessing changes in cerebral blood volume (CBV), HbO2 (oxy-hemoglobin), and Hb (deoxy-hemoglobin) in mice in response to peripheral stimuli through intact skulls (Culver et al, 2005). However, the reconstructed images suffer from poor spatial resolution due to the diffusive nature of light in biological tissue (Dehghani et al, 2009). In contrast, LSI can probe the vasomotion and blood flow responses with high spatial resolution (∼6.7 × 6.7 μm2) (Li et al, 2009), but the limited penetration depth of LSI necessitates skull thinning or skull removal in mice (Li et al, 2009). Although Li et al (2006) have demonstrated LSI's capability of imaging cerebral blood flow through the intact rat skull via laser speckle temporal contrast analysis, only planar mapping of vasculature was obtained in their work due to a lack of axial resolution. Recently, Yang et al (2010) proposed a novel experimental protocol for imaging cortical structures through a thinned-skull cranial window in live mice using two-photon laser scanning microscopy. Imaging techniques that allow longitudinal imaging of the intact brain are highly important for the study of changes in cerebral tissues under normal intracranial pressure and pathological conditions in the living brain. Regardless, a novel optical imaging technique with the high spatiotemporal resolution of LSI and the penetration depth of DOI to avoid skull-thinning surgery would be a significant advance toward longitudinally investigating functional cerebrovascular responses.
Functional magnetic resonance imaging (fMRI) is now widely used by neuroscientists to longitudinally investigate functional cerebrovascular responses. Blood oxygen level-dependent fMRI measures the local magnetic field perturbations produced by absolute changes in Hb within each measured voxel. Functional magnetic resonance imaging offers multiparametric and noninvasive measurements of blood flow, and relative changes in blood oxygenation, blood volume, and oxygen metabolism (Davis et al, 1998; Mandeville et al, 1998) without depth limitations. However, it is still challenging to isolate pure hemoglobin oxygen saturation (SO2) changes without administration of exogenous contrast agents, especially when measuring a transient functional hemodynamic response in single cerebral vessels (Langham et al, 2009).
Photoacoustic (PA) imaging is an emerging biophotonic imaging technique that overcomes the resolution drawbacks of pure optical imaging and possesses the merits of both optics and ultrasound, that is, high optical absorption contrast and submillimeter ultrasound resolution up to an imaging depth of centimeters (Zhang et al, 2006). In this technique, PA signals are induced by a pulsed laser energy that results in a transient thermo-elastic expansion of biological tissue upon absorption. These signals are then detected by acoustic transducers and reconstructed to form images representative of the optical absorption distribution. Photoacoustic imaging has been applied to vasculature imaging, breast tumor detection, and oxygenation monitoring in single blood vessels (Zhang et al, 2006). Recently, Maslov et al (2005) developed a reflection-mode confocal PA microscopy (PAM) technique using dark field illumination and a high-frequency (>20 MHz) ultrasound transducer. This technique allows for a high spatial resolution of ∼15 μm with a penetration depth of up to 3 mm (2005). Our recent study utilized PAM's capability to acquire functional hemodynamic responses to forepaw electrical stimulation in exposed rodent brains for the first time (Liao et al, 2010). Based on a block design paradigm and multiwavelength PAM, we proposed a functional analysis method to image qualitative changes in total hemoglobin concentration (HbT) and SO2. Imaging hemodynamic changes using PAM from specific cortical region of the brain, not in specific blood vessels was reported.
In the present study, we further employed the functional photoacoustic microscopy (fPAM) technique to investigate peripheral stimulus-evoked changes in total HbT, CBV, SO2, and the transient hemodynamic response in single cortical vessels of mice with intact skulls. Electrical stimulation was induced at the mouse forepaw to repeatedly evoke neuronal activation in the primary somatosensory cortex. Our technique complements other existing neuroimaging approaches for the longitudinal investigation of the hemodynamic response in single cerebral vessels.
Materials and methods
Dark Field Confocal Functional Photoacoustic Microscopy System
Figure 1 illustrates the experimental setup of the 50-MHz dark field confocal fPAM system used to image functional changes in cortical vessels in this study. An optical parametric oscillator (Surlite OPO Plus, Continuum, Santa Clara, CA, USA) pumped by a frequency-tripled Nd:YAG Q-switched laser (Surlite II-10, Continuum) was employed to provide ∼4-nanosecond laser pulses at a pulse repetition rate of 10 Hz. Because blood displays strong optical absorption of the visible spectrum and therefore generates strong PA signals, laser pulses at two visible wavelengths, 560 and 570 nm (λ560 and λ570), were used for PA wave excitation. The two wavelengths were optimized to provide a high signal-to-noise ratio (SNR) and sensitivity to probe functional changes in CBV, SO2, and HbT in blood vessels (Liao et al, 2010). In regards to transcranial imaging capability, a large NA (numerical-aperture), wideband 50-MHz ultrasonic transducer was employed to allow for the efficient collection of transcranial PA signals from cortical vessels (Stein et al, 2009). The used 50 MHz transducer was custom-made by the Resource Center for Medical Ultrasonic Transducer Technology at University of Southern California (http://bme.usc.edu/UTRC/). Its NA was 0.33.
Figure 1.
Experimental setup of the functional photoacoustic microscopy (fPAM). A window at the bottom of the water container was sealed with an optically and ultrasonically transparent, disposable polyethylene film. After a commercially available ultrasound gel was applied to the brain for acoustic coupling, the brain was placed between the water container and the custom-made stereotaxic apparatus for imaging. The laser was pulsed with a pulse repetition rate of 10 Hz and coupled by a lens to an optical fiber to illuminate the mouse's brain. Photoacoustic (PA) waves were detected with a 50-MHz transducer and then through the A/D card to the PC for further data analysis.
Laser energy was delivered by a 1-mm multimode fiber. The fiber tip was coaxially aligned with a convex lens, an axicon, and a plexiglass mirror with the ultrasonic transducer on an optical bench to form a dark field illumination confocal with the focal point of the ultrasonic transducer. The incident energy density on the sample surface was well within the American National Standards Institute safety limit of 20 mJ/cm2. The transducer was immersed in an acrylic water tank during the imaging process with a hole at the bottom sealed with a 15-μm thick polyethylene film. The mouse head was coated with a thin layer of ultrasonic gel and attached to the thin film to ensure good coupling of transcranial PA waves to the tank. The PA signals received by the ultrasonic transducer were preamplified by a low-noise amplifier (AU-3A-0110, Miteq, Hauppauge, NY, USA), cascaded to an ultrasonic receiver (5073 PR, Olympus, Center Valley, PA, USA), and then digitized and sampled by a computer-based 14-bit analog to digital (A/D) card (CompuScope 14,200, GaGe, Lockport, IL, USA) at a 200-MHz sampling rate for data storage. Fluctuations of the laser energy were monitored by a photodiode (DET36A/M, Thorlabs, Newton, NJ, USA). The recorded photodiode signals were applied to compensate for PA signal variations caused by laser energy instability before any further signal processing. Please note that the PA images in this study were acquired without any signal averaging to facilitate the imaging of fast hemodynamic responses, and the amplitudes of the envelope-detected PA signals were used in the following functional imaging analysis. Currently, the fPAM system is capable of providing A-line (i.e., one-dimensional images in which the axis represents the imaging depth), B-scan (i.e., two-dimensional images in which one axis is the lateral scanning distance and the other is the imaging depth), and C-scan (i.e., three-dimensional images obtained via two-dimensional scanning) images of the region of interest. It is important to note that the field of view of the C-scan image in the axial direction was limited by the depth of focus of the ultrasonic transducer. Nonetheless, a three-dimensional C-scan image was used to provide the maximum-amplitude projected C-scan image, in which the maximum of each A-line signal along the depth direction was plotted against the two-dimensional transducer scanning position. The penetration depth in our study was at least 3 mm, and the SNR at this depth was ∼18 dB. The SNR was defined as the ratio of the signal peak value to the root-mean-square value of the noise. The maximum achievable axial and lateral resolutions were 36 and 65 μm, respectively. The data acquisition rate in the A-line imaging mode was 10 Hz, and was limited by the laser repetition rate. In addition, the minimum detectable change in vessel size of the current fPAM system was 1 μm in the axial direction and 5 μm in the lateral direction, both of which were limited by the precision of the used motorized stage (see Supplementary Information).
Experimental Animals
The experimental protocol used for animals was evaluated and approved by the Institutional Animal Care and Use Committee of National Chiao Tung University and National Tsing Hua University, Taiwan. Care of the animals and surgical procedures were performed according to the standards of National Chiao Tung University and National Tsing Hua University Protocol on Laboratory Animals.
Six male BALB/cByJNarl mice (National Laboratory Animal Center, Taiwan) weighing 25 to 28 g were used. The animals were housed at a constant temperature and humidity with free access to food and water. Before imaging experiments, the mice fasted for 24 hours but were given water ad libitum. Mice (n=6) were initially anesthetized by an intraperitoneal injection of ketamine (91 mg/kg) and xylazine (9.1 mg/kg). Supplemental α-chloralose (25 mg/kg/h) anesthesia was administered intraperitoneally as needed. Prior studies have indicated that cerebral autoregulation is not affected by these anesthetic conditions (Van Hemelrijck et al, 1993). The animal body temperature was measured by an infrared ray thermometer (JDIT-500, JETEC Electronics, Taichung City, Taiwan) and maintained at 37°C±1 °C by 150-watt bulb heating during the surgery and PAM imaging. Meanwhile, the levels of anesthesia were monitored via the vital signs of the heart rates and respiration rates. The heart rates were measured at 286±4, 289±9, and 287±5 b.p.m. before, during, and after the stimulations, respectively. No significant variations in the heart rate were observed in the experimental procedures. The respiration rates were simultaneously recorded in the experiment. The respiration rates were 41±9 and 40±10 b.p.m. before and after electrical stimulations, respectively. No significant changes in respiration rates were found. Each anesthetized animal was mounted on the custom-made acrylic stereotaxic head holder, and each scalp was surgically removed from the skull to expose the bregma landmark. The exposed skull was cleaned with a 0.9% NaCl irrigation solution before imaging. The ultrasonic gel was applied for ultrasound coupling and to maintain skull hydration. The anteroposterior distance between the bregma and the interaural line was directly surveyed (Paxinos and Franklin, 2001) with the bregma 3.8±0.12 mm (mean±s.d., n=6) anterior to the interaural line. The animal's head was positioned in a stereotaxic frame and placed on a bed pallet. The pallet was moved until the crosshair of the laser alignment system pointed to the bregma, and the fPAM system was positioned using the interaural and bregma references as landmarks. There was no additional surgery in the following experiments.
Photoacoustic Imaging of Cortical Vasculature with a Skull Intact
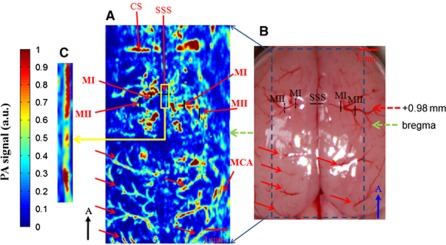
After bregma positioning, a PA C-scan (i.e., two-dimensional scanning) was performed to acquire reference images of the cortical vasculature. It was also used to ensure that the mouse's cortex was well located at the focal zone of the 50-MHz transducer. Figure 2A is a maximum-amplitude projected C-scan image of the cerebral cortex vessels in a 5 × 10-mm2 range that was acquired at λ570 with an intact skull. The PA-projected C-scan image included 85 B-scan images, with each scan separated by 60 μm. Figure 2B is an anatomical photograph of the skull-removed mouse brain taken after the imaging procedure. The cortical blood vessels, indicated with solid red arrows in Figure 2B, were imaged and are shown in Figure 2A. In addition, arteriolar branches from the anterior cerebral artery vessel system could be seen in the projected C-scan image (Chugh et al, 2009; Paxinos and Franklin, 2003; Paxinos, 2004; Stein et al, 2009). These were bilaterally identified as MI and MII and are labeled in both Figures 2A and 2B along with the superior sagittal sinus (SSS). The SSS is the largest vein in the rodent brain cortex (Paxinos, 2004). The MI and MII arterioles are two different-sized arterioles branching from the anterior cerebral artery vessel system growing from the bottom center of the brain to the cortical surface (Chugh et al, 2009; Paxinos and Franklin, 2003; Paxinos, 2004; Stein et al, 2009). The bilateral MI arterioles cross through the anatomical borders of the primary motor cortex and secondary motor cortex (Paxinos, 2004). The bilateral MII arterioles are located in the anatomical borders of the primary somatosensory cortex that innervates the forepaw (S1FL) (Paxinos, 2004; Weber et al, 2008). Functional changes of HbT, CBV, and SO2 and early SO2 changes in the SSS and the bilateral MI and MII arterioles were imaged by fPAM scanning along the black solid and dashed lines in the bilateral regions of Figure 2B during stimulation.
Figure 2.
Comparison of the photograph of the mouse brain with the skull removed with the projected photoacoustic (PA) C-scan image acquired at λ570. (A) In vivo PA-projected C-scan image of the blood vessels in the superficial layer of the cortex with skull intact, acquired at λ570. The green dashed arrow indicates the position of the bregma. The superior sagittal sinus (SSS) and a number of the cortical surface blood vessels can be identified. (B) Photograph of the brain surface with the skull removed, taken after the imaging procedure, showing an unobstructed view of the cortex vessels. Some branches of the vessels indicated with the red solid arrows are imaged in Figure 3A. The red dashed arrow indicates the activated section of bregma +0.98 mm during left forelimb stimulation. Functional B-scan images of the SSS and bilateral MI and MII arterioles were acquired by scanning along the black solid and dashed lines in the bilateral region. (C) Zoom-in image of the yellow box in panel A with an adjusted display dynamic range. It is shown that the SSS can be made more visible with a proper display dynamic range. The black arrow points in the rostral direction. The color reproduction of this figure is available on the Journal of Cerebral Blood Flow and Metabolism journal online.
Forepaw Electrical Stimulation
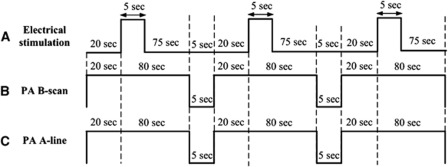
Forepaw stimulation was achieved by the insertion of thin stainless needle electrodes under the skin of the left forepaw. Electrical stimulation was induced with a stimulator (Model 2100, A-M Systems, Sequim, WA, USA) and consisted of a monophasic constant current of 2-mA pulses with a 0.2-millisecond pulse width at a frequency of 3 Hz. A block design paradigm was employed in this study for functional signal acquisition. Each trial consisted of three blocks, and each block began with a 20-second baseline that was followed by a 5-second Stimulation-ON and a 75-second Stimulation-OFF period, as shown in Figure 3A. There was a 5-second lapse between each block, and PA B-scan images (Figure 3B) or A-line signals (Figure 3C) at λ560 or λ570 were acquired in each block to assess stimulation-induced functional changes in the SSS and the bilateral MI and MII arterioles. In the current fPAM system, the data acquisition times for each PA B-scan image of the SSS and bilateral MI and MII arterioles were 2.11, 1.96, and 1.83 seconds, respectively. Photoacoustic images acquired in each block were used to assess stimulation-induced hemodynamic changes in specific single cortical vessels. A-line imaging was also performed to facilitate the monitoring of transient functional SO2 changes in the SSS and bilateral MI and MII arterioles. The A-line acquisition rate was 10 Hz. Note that via the block design experimental protocol, 100-milliseconds time interval between two successive functional data point can be achieved in the A-line imaging mode even though each data point requires multiwavelength data or multiple measurements.
Figure 3.
Schematic diagram of the experimental protocol including the stimulus and functional photoacoustic microscopy (fPAM) B-scan and A-line imaging timing. (A) Block design utilized for the electrical forepaw stimulation task. The task began at the baseline ‘Stimulation-OFF' state; the active ‘Stimulation-ON' state consisted of a constant 0.2-millisecond electrical pulse width, 3-Hz pulse train and a 2-mA pulse amplitude. There was a 5-second lapse between the photoacoustic (PA) scan and the block design paradigm to the next block. (B) There were multiple PA B-scan images of specific single cortical vessels acquired in each active block. Each PA B-scan of the superior sagittal sinus (SSS) and bilateral MI and MII arterioles took 2.11, 1.96, and 1.83 seconds, respectively. There were 47, 51, and 54 B-scan images for the SSS and bilateral MI and MII arterioles, respectively, in each block. (C) PA A-line data acquisition was also performed in three active blocks, and each A-line scan took 100 milliseconds.
Data Analysis of the Functional Changes in Cerebral Blood Volume, Total Hemoglobin Concentration, and Hemoglobin Oxygen Saturation
Previous work (Liao et al, 2010) indicates that the two wavelengths (i.e., λ560 and λ570) are optimal for sensing functional changes in CBV, SO2, and HbT with a high SNR and high sensitivity. Given a single cerebral blood vessel, CBV is proportional to the crosssection of a single vessel and can be imaged via a PA B-scan (Roston, 1967). Accordingly, a PA crosssectional B-scan image of each specific single vessel at λ570 (i.e., IR(570)) was used. Because of the high optical absorption contrast between single blood vessels and background tissue and high SNR, a threshold of PA signals was set to segment the blood vessels; a pixel that displayed a PA signal that was three times greater than the background signal was considered a vessel pixel (Li et al, 2007). The total vessel pixel count was treated as the crosssectional area (i.e., CBV) of a single vessel. Relative functional CBV changes (RCBV) in a single vessel could then be monitored by assessing the crosssection of the vessel during each block against a normalized baseline image acquired immediately before the electrical stimulation onset (i.e., ∼20 seconds in each block). RCBV(t) was constructed according to the following equation:
 |
where t is the time in each block, A(IR(570)(t)) represents the crosssectional area of a single vessel at a given time in each block, and A(IR(570),baseline) is the crosssection baseline estimated from the baseline image acquired immediately before electrical stimulation onset in each block. Note that due to fPAM's finite point spread function (i.e., finite spatial resolution), increases in HbT also increase total vessel pixel count even if vessel diameters remain the same during stimulation. However, compared with those caused by true vessel crosssectional changes during electrical stimulation, changes in total vessel pixel count resulting from an increase in HbT were negligible in this study.
At λ570, an isosbestic point of the molar extinction spectra of HbO2 and Hb, the optical absorption is insensitive to SO2 levels. Photoacoustic signal changes at λ570 largely result from changes in HbT=[HbO2]+[Hb], which is the total amount of hemoglobin within the PA resolution cell. Therefore, in this study, PA images including B-scan and A-line images at λ570 (IR(570)) were used to probe the changes in HbT. Because the PA signal at a given pixel in IR(570) is proportional to the HbT within the PA resolution cell centered at that pixel, the relative mean functional HbT changes (RHbT(t)) in a single vessel during the stimulation period could be assessed as follows:
 |
where (x, z) is the pixel position, and IR(570),baseline is the baseline image at λ570 acquired immediately before electrical stimulation onset in each block.
In addition, PA signal changes at λ560 were sensitive to SO2 changes because the largest absorption changes in the visible spectrum occurred at approximately λ560 when the SO2 levels changed. To observe only the SO2 level changes and exclude the effects of changes in HbT on PA signals, PA images acquired at λ560 (I(560)) were normalized to IR(570) on a pixel-by-pixel basis. Functional images of relative SO2 changes (ΔIF(560)(t)) at a given time point, t, in each block were then formed according to the following equation:
 |
where I(560),baseline is the baseline image at λ560 acquired immediately before electrical stimulation onset in each block. Note that an independent probing of the changes in HbT and SO2 could be achieved using the fPAM system where IR(570) was used as a marker for HbT, and IF(560) was used as a marker for SO2. Negative values in ΔIF(560) (i.e., a positive −ΔIF(560)) indicated increases in SO2 levels and vice versa (Liao et al, 2010). The mean functional SO2 changes ( ) in a single vessel during the stimulation period were probed as follows:
 |
In the A-line imaging mode, the relative SO2 changes (  ) of a single vessel were estimated using equation (5):
 |
where I denotes the PA A-line signal from the observed single vessel, and max(I) represents the peak value of the A-line signal. Negative values of equation (5) indicate increases in SO2 level and vice versa.
Statistical Analyses
The experiment was designed to quantitatively measure PA signal (IR(570)) changes, as well as changes in the SSS and bilateral MI and MII arterioles, following electrical stimulation. Statistical significance was assessed using a paired t-test with significance defined as a probability (P) value of <0.05. Side-to-side differences in PA signals (IR(570) and ΔIF(560)) of the studied areas and changes in crosssectional areas (i.e., CBV changes) were both examined using a paired t-tests (P<0.05, n=6). The significance of changes observed in fPAM signals (ΔIF(560)) of the studied areas in response to electrical stimulation was compared using the Wilcoxon matched-pairs signed-rank test (two-tailed, P<0.05, n=6) (Liao et al, 2010). All statistical analyses were performed using SPSS (version 10.0, SPSS, Chicago, IL, USA).
Results
Transcranial Imaging of Mouse Cerebral Vasculature
The cerebral cortex vasculature with the intact skull was imaged in vivo using an fPAM C-scan at λ570 (Figure 2A). The SSS and bilateral MI and MII arterioles were reliably identified in the projected C-scan image with estimated vessel diameters of 250, 100, and 55 μm, respectively. These areas were also monitored for HbT, CBV, SO2, and fast SO2 changes. In addition, the SNR is about 15.48, 18.82, 18.47 dB for the specific SSS and contrlateral MI and MII vessels, respectively. A photograph of a mouse brain that was taken after the functional imaging experiment is shown in Figure 2B. The vasculature from the projected C-scan image corresponded with the photograph. The SSS and other large cortical surface blood vessels were visualized, as indicated with the solid red arrows in Figures 2A and 2B. The imaging quality of the SSS was not satisfactory with the display dynamic range we used, which was concordant with previous studies (Stein et al, 2009). The geometric focus and the finite detection bandwidth of the ultrasound transducer used may account for the weakness of the detected PA signals from the SSS. Note that the SSS, however, can be made more visible with a proper display dynamic range, as shown in Figure 2C.
Cerebral Blood Volume and Total Hemoglobin Concentration Changes in the Superior Sagittal Sinus and Bilateral MI and MII Arterioles
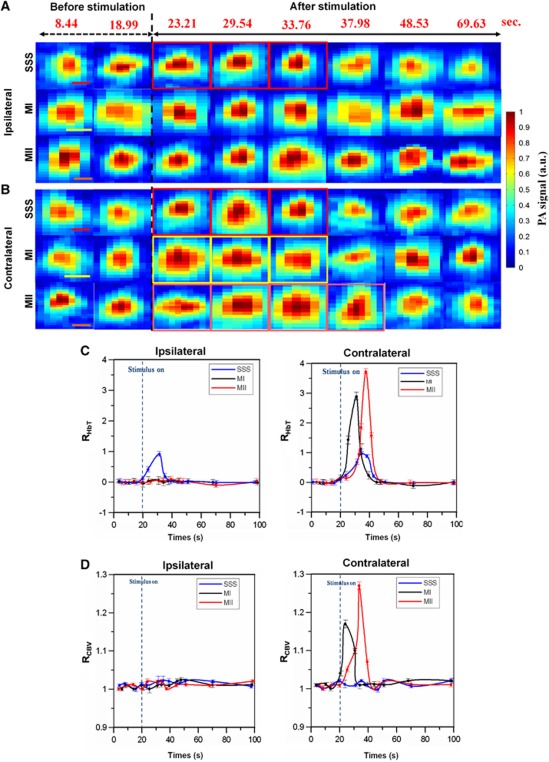
The IR(570) images that assessed HbT changes in one stimulation block are shown in Figures 4A and 4B. Significant HbT changes were observed in the SSS and MI and MII arterioles contralateral to forepaw electrical stimulation. On the contrary, no significant HbT changes were found in ipsilateral MI and MII arterioles. Figure 4C shows the RHbT(t) of the SSS and bilateral MI and MII arterioles in one stimulation block. The times to the peak RHbT of the SSS and the contralateral MI and MII arterioles were 13.76, 9.54, and 17.98 seconds (respectively) after the stimulation onset. The peak RHbT values were 0.97±0.001 (mean±s.d.) (P<0.001) in the SSS, 2.890±0.002 seconds (mean±s.d.) (P<0.001) in contralateral MI arterioles and 3.720±0.005 (mean±s.d.) (P<0.001) in the MII arterioles during stimulation (Wilcoxon matched-pairs signed-rank test, n=6). No significant RHbT was observed in ipsilateral MI and MII arterioles from Stimulation-ON to Stimulation-OFF (P>0.05). The response times of RHbT from the stimulation onset to the times when RHbT returned to the baseline were 28.42, 24.65, and 25.29 seconds for the SSS and the contralateral MI and MII arterioles, respectively.
Figure 4.
(A, B) In vivo photoacoustic (PA) crosssectional B-scan images IR(570) of the superior sagittal sinus (SSS) and bilateral MI and MII arterioles in one stimulation block. Significant hemoglobin concentration (HbT) changes are marked with the red (for SSS), yellow (for MI), and orange (for MII) squares. Red, yellow, and orange scale bars in the SSS, MI, and MII images denote 100, 60, and 30 μm, respectively. Note that the numbers in red at the top of each column indicate the time of image acquisition. (C) Mean functional HbT changes (i.e., RHbT) in the SSS and bilateral MI and MII arterioles as a function of time. (D) Functional cerebral blood volume (CBV) changes (i.e., RCBV) in the SSS and bilateral MI and MII arterioles as a function of time. The error bars indicate the standard deviations of the measured data from six mice. Note that the ipsilateral SSS is the SSS during the ipsilateral-side measurement and the contralateral SSS is the same SSS during the contralateral-side measurement. The color reproduction of this figure is available on the Journal of Cerebral Blood Flow and Metabolism journal online.
Figure 4D shows RCBV(t) from one stimulation block. The time-to-peak RCBV was 7.92 seconds in contralateral MI arterioles and 18.3 seconds in contralateral MII arterioles after the stimulation onset. The peak RCBV values in the contralateral MI and MII arterioles were 1.160±0.005 (mean±s.d.) (P<0.0001) and 1.270±0.004 (mean±s.d.) (P<0.001), respectively (paired t-test, n=6). In contrast, in the hemispheres ipsilateral to forepaw electrical stimulation, both MI and MII arterioles displayed no significant CBV changes (P>0.05). Additionally, no significant RCBV was found in the SSS during stimulation (P>0.05). The response time of the RCBV from the stimulation onset to the time when RCBV returned to baseline was 13.32 seconds in contralateral MI arterioles and 21.43 seconds in contralateral MII arterioles. Note that the peak times and values were determined from the curve after the curve fitting with the spline smoothing function provided by the Grapher software (Golden Software, Golden, CO, USA) in this study.
Hemoglobin Oxygen Saturation Changes in the Superior Sagittal Sinus and Bilateral MI and MII Arterioles
Figure 5A shows the −ΔIF(560) images of peak SO2 changes from one stimulation block. The peak SO2 changes occurred at 29.54, 23.52, and 34.77 seconds for the SSS and bilateral MI and MII arterioles, respectively. Negative ΔIF(560) values indicate an increase in SO2 levels and vice versa. As seen in Figure 5A, there were more significant changes in SO2 in the contralateral MI and MII arterioles than in the ipsilateral arterioles. The SO2 change in the SSS was also significant compared with the baseline.
Figure 5.
(A) −ΔIF(560) images of the superior sagittal sinus (SSS) and bilateral MI and MII arterioles at the moment when peak hemoglobin oxygen saturation (SO2) changes occurred. The peak SO2 changes occurred at 29.54, 23.52, and 34.77 seconds for the SSS and bilateral MI and MII arterioles, respectively. Red, yellow, and orange scale bars in the SSS, MI, and MII images denote 100, 60, and 30 μm, respectively. (B) Mean functional SO2 changes (i.e.,  ) in the SSS and bilateral MI and MII arterioles as a function of time. (C) Quantitative analyses of the IF(560) signal changes to forepaw stimulation in the SSS and bilateral MI and MII arterioles. IF(560) was used to probe SO2 changes. IF(560) signals at 29.54 (for the SSS), 23.52 (for the MI), and 34.77 seconds (for the MII) were used for statistical analyses. The error bars indicate the standard deviations of the measured data from six mice; *P<0.05 (Wilcoxon matched-pairs signed-rank test t, n=6). Note that the ipsilateral SSS is the SSS during the ipsilateral-side measurement and the contralateral SSS is the same SSS during the contralateral-side measurement.
Figure 5B illustrates the time course measurements of  After the stimulation onset, the times to peak
  were 11.54, 9.54, and 17.77 seconds for the SSS and contralateral MI and MII arterioles, respectively. The peak
  values were 2.510±0.001 (mean±s.d.) (P<0.001) and 3.480±0.008 (mean±s.d.) (P<0.001) in the contralateral MI and MII arterioles (respectively) during stimulation (Wilcoxon matched-pairs signed-rank test, n=6). The peak
  in the SSS was 1.170±0.005 (mean±s.d.) (P<0.001) during stimulation (Wilcoxon matched-pairs signed-rank test, n=6). No significant changes were observed in the ipsilateral MI and MII arterioles from Stimulation-ON to Stimulation-OFF (P>0.05). The response times of
  from the stimulation onset to the time when
  returned to baseline were 27.76, 21.52, and 23.79 seconds for the SSS and contralateral MI and MII arterioles, respectively.
Quantitative analyses of the IF(560) signal changes to forepaw stimulation are shown in Figure 5C. No significant side-to-side differences in PA SO2 signal changes were observed in the SSS or the MI and MII arterioles during the Stimulation-OFF period (Wilcoxon matched-pairs signed-rank test, P=0.740, n=6). However, significant SO2 differences were observed in the bilateral MI and MII arterioles during stimulation (Wilcoxon matched-pairs signed-rank test, P<0.001, respectively, n=6).
Transient Functional Hemoglobin Oxygen Saturation Changes in the Superior Sagittal Sinus and the Contralateral MI and MII Arterioles
Figure 6 shows  as a function of time. These values were acquired by A-line imaging and were used to monitor transient SO2 changes during stimulation. The
  signals depict two phases of SO2 changes within single vessels: (1) the hypoxic phase (initial dip) and (2) the hyperoxic phase (positive overshoot). In the hypoxic phase, the times to negative peak
  values after the stimulation onset were 0.8 and 1 second for the contralateral MI and MII arterioles, respectively. The negative peak values of the
  signals were −0.13±0.002 (mean±s.d.) (P<0.01) and −0.38±0.003 (mean±s.d.) (P<0.001) in contralateral MI and MII arterioles, respectively (Wilcoxon matched-pairs signed-rank test, P<0.001, n=6). The response times of the
  signals in the hypoxic phase (i.e., from the stimulation onset and to the time when
 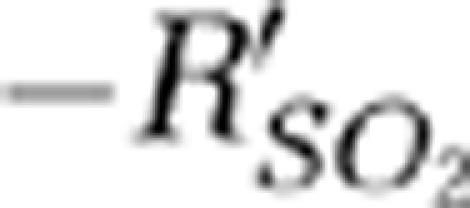 returned to the baseline) were 1.2 and 1.4 seconds for the contralateral MI and MII arterioles, respectively.
Figure 6.
Hemoglobin oxygen saturation (SO2) changes (i.e.,  ) of the superior sagittal sinus (SSS) and contralateral MI and MII arterioles as a function of time estimated in the A-line imaging mode and used to monitor fast SO2 changes. Inset shows the enlarged signal of
  from the 20th to 22nd second. There were two phases of SO2 changes within single vessels: (1) the hypoxic phase (initial dip) and (2) the hyperoxic phase (positive overshoot). In the hypoxic phase, both of the contralateral MI and MII arterioles had significant negative peak values with respect to the baseline response, indicating an increase of deoxy-hemoglobin. The initial dip phenomenon was not significant in the SSS in the hypoxic phase. The
  signal of the SSS increased 0.6 seconds after Stimulation-ON.
Moreover, the times to positive peak 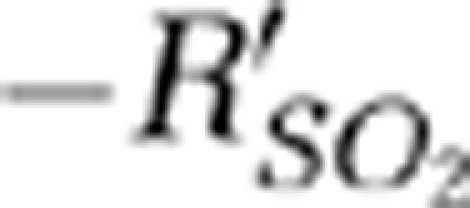 were 12, 9, and 16 seconds for the SSS and contralateral MI and MII arterioles, respectively. The peak values of the
  signals were 2.49±0.005 (mean±s.d.) (P<0.01) and 3.48±0.004 (mean±s.d.) (P<0.001) in the contralateral MI and MII arterioles (Wilcoxon matched-pairs signed-rank test with respect to the baseline response, n=6). In addition, those peak values (
  ) were significant in the contralateral MI and MII arterioles with respect to the ipsilateral response. The response times of
 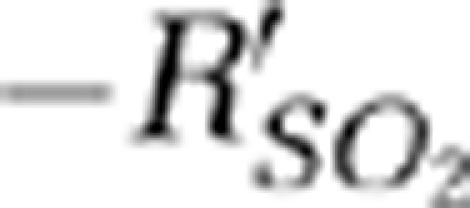 signals from the stimulation onset to the time when
 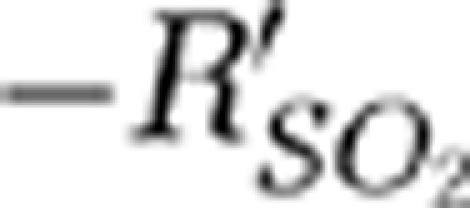 returned to the baseline were 27, 22, and 24 seconds for the SSS and the contralateral MI and MII arterioles, respectively. The
 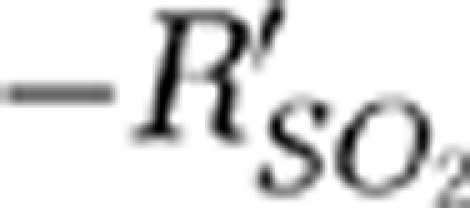 signal in the SSS showed no significant changes in the hypoxic phase.
Discussion
Functional Photoacoustic Microscopy System
Noninvasive PA imaging of the cortical vasculature in rodents with intact skulls and scalps is challenging due to insufficient laser energy delivery, low acoustic signal collection, and an interference of reverberated PA scalp signals caused by the skull. Figure 7 illustrates the pathways of the detected PA signals and the corresponding B-scan images of intact scalps and skulls (Figure 7A) and of intact skulls only (Figure 7C). When assessing intact scalps and skulls, the ultrasound transducer receives three different types of PA signals: those from vessels inside the scalp (e.g., S1 in Figure 7A), reverberated PA signals of scalp vessels by the skull (e.g., S2 in Figure 7A) and PA signals from cortical vessels (e.g., S3 in Figure 7A). Because the time of flight of the reverberated PA signals by the skull is too close to the PA signals of cortical vessels, the reverberated PA signals of scalp vessels shadowed the desired PA signals from cortical vessels, and therefore, the cortical vessels could not be clearly identified in both the projected C-scan and B-scan images (see Figure 7B). In this study, the scalp was surgically removed to avoid this problem, as illustrated in Figures 7C and 7D. In addition, to improve the collection efficiency of transcranial PA signals from cortical blood vessels and to enable transcranial imaging capability, an ultrasound transducer with a large NA (i.e., with a 6-mm active element and a focal length of 9 mm) was used in our fPAM system (Stein et al, 2009). However, the limited depth of focus of such a transducer limited the field of view of the three-dimensional C-scan image in the axial direction. The virtual detector-based synthetic aperture focusing technique could be employed to extend the depth of focus (Li et al, 2006; Zhang et al, 2006). In addition, even larger depth of field in the axial direction could be obtained by dynamic receive focusing if a high frequency array transducer was used for PA signal detection (Bitton et al, 2009).
Figure 7.
Illustrations of the pathways of the detected photoacoustic (PA) signals and the corresponding B-scan images under the conditions with the scalp and skull intact and with the skull intact only. (A) Condition with the scalp and skull intact. Three different types of PA signals were received by the transducer: PA signals from vessels inside the scalp (S1), reverberated PA signals of the scalp vessels by the skull (S2), and PA signals from cortical vessels (S3). Left panel shows the time-resolved PA signals that indicate that the time of flight of S2 was too close to that of S3, and therefore, the S2 shadowed the desired S3. (B) B-scan image of the mouse brain with the scalp and skull intact. (C) Condition with the skull intact only: the transducer only receives PA signals from cortex vessels (S3). The time-of-flight PA signal is shown in the left panel. (D) B-scan image of the mouse brain with the skull intact only.
In addition, it is found that the SSS was not satisfactorily visualized in the projected C-scan image. Although the SSS could be seen in the PA B-scan images as shown in Figures 4A and 4B, the detected PA signals from the SSS were weaker than those from other cortical vessels. Similar findings have also been reported in the literatures (Liao et al, 2010; Stein et al, 2009). This weaker SSS signals may result from spherical geometric focusing and the finite detection bandwidth of the used 50-MHz ultrasound transducer in our current fPAM setup. The frequency of the PA signals generated by the SSS may be out of the detection bandwidth of the transducer. Moreover, sensing with spherical geometric focusing inherently prefers point-like PA sources, which is not the case of for the large-sized SSS, thus weakening the detection of PA signals from the SSS (Stein et al, 2009).
The advantages of the fPAM technique are high ultrasonic spatial resolution, high intrinsic optical contrast, and the capability to assess multiple physiological parameters in a single setting while keeping the skull intact. Transcranial imaging capability is useful in maintaining cranial perfusion pressure and can be utilized in longitudinal studies (Yang et al, 2010). The 10-Hz data acquisition rate in the A-line imaging mode of the fPAM system facilitates the functional imaging of transient hemodynamic changes in single vessels during stimulation (Li et al, 2010). In addition, to probing the changes in CBV and SO2, Yao and Wang (2010) demonstrated that fPAM can also be used to measure changes in cerebral blood flow and, potentially, the cerebral metabolic rate of oxygen consumption (Hu and Wang, 2010) in single blood vessels of mice.
Functional Changes of Total Hemoglobin Concentration, Cerebral Blood Volume, and Hemoglobin Oxygen Saturation by Functional Photoacoustic Microscopy in Single Vessels
Our findings from electrical stimulation of left mouse forepaws demonstrated significant increases in HbT (i.e., increases in IR(570)), CBV (i.e., increases in vascular crosssectional area in IR(570)), and SO2 (i.e., negative ΔIF(560) or decreases in IF(560)) in contralateral MI and MII arterioles. Significant increases of the HbT and SO2 were observed in the SSS during the stimulation period, but no significant increase of the CBV was imaged. In addition, HbT and SO2 both demonstrated significant changes in arterioles and veins. The onset overshoot of HbT and SO2 may be due to increased blood flow near the activation site, which leads to a fresher blood supply and higher HbT and SO2 levels in the surrounding arterioles (Bouchard et al, 2009). The oxygenated blood that subsequently flows into the veins may lead to increases in the HbT and SO2 (Petrova et al, 2009; Seiyama et al, 2003). The current fPAM system found shorter time-to-peak HbT and SO2 changes in MI arterioles than in veins. It is possible that the oxygenated blood flows into the larger MI arterioles first, resulting in the shorter time-to-peak HbT and SO2 changes in MI arterioles than in veins (Bouchard et al, 2009; Vovenko, 1999) and with studies showing a clear lateralization of unilateral forepaw electrical stimulation (Bouchard et al, 2009; Shih et al, 2009).
The changes in HbT, CBV, and SO2 were all faster in contralateral MI arterioles than in contralateral MII arterioles because autoregulation leads to HbT, CBV, and SO2 increases in large vessels (such as the contralateral MI arterioles) first and then in smaller vessels (such as the contralateral MII arterioles) (Raichle and Stone, 1971). Conversely, the peak values in HbT, CBV, and SO2 were larger in the contralateral MII arterioles than in the contralateral MI arterioles. One explanation is that the contralateral MII arterioles were closer to the activated brain regions than the contralateral MI arterioles (Harshbarger and Song, 2006; Seiyama et al, 2003). Because the contralateral MII arterioles transfer a significant quantity of oxygenated blood into the activated regions during the stimulation, the peak changes in HbT, CBV, and SO2 of the contralateral MII arterioles were larger than in the contralateral MI arterioles (Harshbarger and Song, 2006). Our data suggest that the changes in HbT, CBV, and SO2 were more prominently associated with smaller arterioles. This finding, which is concordant with fMRI data of previous studies (Harshbarger and Song, 2006), can be attributed to the immediate proximity of the neuronal activity to the smaller arterioles.
Our findings also indicated that the HbT, CBV, and SO2 responses remained elevated for about 10 to 20 seconds after the stimulation onset in contralateral MI and MII arterioles. In delivering blood flow and oxygenation to the locally activated tissues, the total response times of HbT, CBV, and SO2 were longer in smaller arteries than in the large arteries (Hillman et al, 2007; Seiyama et al, 2003), which is likely due to the localization of the smaller arteries. Although our findings did not demonstrate any significant CBV changes in the SSS, HbT changes in the SSS were significant. These findings appear contradictory because HbT and CBV should be relatively similar, even though they are calculated differently. One potential reason for the discrepancy is that the change in the crosssection of the SSS is not detectable by the current fPAM (the detection limit of the current fPAM; see Supplementary Information). Additionally, because the SSS is the largest vein in the mouse brain, small changes in CBV could cause large changes in HbT.
Early Functional Hemoglobin Oxygen Saturation Changes (  ) by Fast A-Line Acquisition of Functional Photoacoustic Microscopy in Single Vessels
To our knowledge, we have demonstrated the initial dip (i.e., early SO2 decrease) phenomenon in single vessels with intact mouse skulls using the optical imaging technique with visible wavelengths for the first time. Previous studies have assessed the initial dip phenomenon using optical imaging following electrical stimulation in an exposed-cortex imaging method (Chen-Bee et al, 2007; Malonek and Grinvald, 1996). Similarly, the initial dip has also been reported using the blood oxygen level-dependent fMRI (Duong et al, 2000; Kim et al, 2000; Yacoub et al, 2001). The initial dip has garnered significant interest because it may reflect a rapid increase of oxidative metabolism before increases in blood flow, and thus is thought to be better localized to the site of increased neuronal activities. Our findings are well supported in previous studies of initial dip phenomenon in both optical imaging and fMRI. With MRI it is challenging to image a single cerebral vessel. By contrast, the current fPAM can directly measure functional initial dips in single cerebral vessels, without the need for exogenous contrast agents. The dip phenomenon can be reliably observed from our group study (six mice). Using A-line acquisition in fPAM with intact mouse skulls, our findings uncovered the intricacies of the initial dip phenomenon with the local oxygen demand seen in arteries rather than in veins.
Our data demonstrated that the magnitude of the initial dip was stronger in contralateral MII arterioles than in MI arterioles. One explanation for this is that the smaller MII arterioles may be more localized to the active regions of the tissue (Seiyama et al, 2003), which allows for higher rates of oxygen demand (Harshbarger and Song, 2006). The oxygenation of blood in the MII arterioles was also comparatively higher, which resulted in a greater initial increase of Hb in MII arterioles. It is possible that the larger contralateral MI arterioles contained more overall oxygenated blood, and therefore, small amounts of oxygen changes could not be significantly detected. One weakness of techniques like DOI indicated by Lindauer et al (2001) is that they can detect an artifactual initial increase of Hb. The current transcranial fPAM system works under quite different mechanisms than DOI and therefore the same technical concerns and analysis problems; for example, low spatial resolution that are not suitable for imaging the hemodynamic changes in single cerebral vessels, do not exist. The current fPAM system can also directly probe the fast SO2 changes individually without any path-length analysis. In addition, the transcranial fPAM system has a data acquisition rate of 10 Hz in the A-line imaging mode, which is sufficient to monitor the sequence of very early level changes in HbO2 or Hb with the help of the block design experimental protocol. Our findings not only confirm the initial dip phenomenon observed and highlight its spatial-temporal localization in arteries over veins (Uludag, 2010) but also provide a more sophisticated method to purely image the fast oxygenation changes in single vessels with high spatial-temporal resolutions and intact skulls.
In summary, the present study demonstrated the unique features of a novel fPAM system by characterizing the hemodynamic responses of single vessels. Local HbT, CBV, SO2, and even fast hemodynamic changes in response to mouse forepaw electrical stimulation were simultaneously recorded in single vessels with 36 × 65-μm2 spatial resolution. Our main findings in this study were the following: (1) single vessel responses can be reliably investigated using transcranial fPAM; (2) an initial dip phenomenon was observed with intact mouse skulls for the first time and displayed more localized changes in the MII arterioles than in the MI arterioles, but no significant initial dip was observed in the SSS; (3) time to the peak rates of HbT, CBV, and SO2 were lower in the MI arterioles than in the MII arterioles; (4) the peak values of the HbT, CBV, and SO2 responses were higher in the MII arterioles than in the MI arterioles. The transcranial fPAM technique demonstrates promise for the understanding of the vascular responses in single cerebral vessels. Our future work will focus on improving the spatial resolution and transcranial imaging of the deeper hemodynamic responses in single blood vessels and subcortical brain functions in intact skulls (Shih et al, 2009).
Acknowledgments
The authors are also grateful to Professor Yung-Jen Chuang, Institute of Bioinformatics and Structural Biology and Department of Life Sciences, National Tsing Hua University, Taiwan for his assistance with the verification of the minimum detectable size change of our fPAM system.
The authors declare no conflict of interest.
Footnotes
Supplementary Information accompanies the paper on the Journal of Cerebral Blood Flow & Metabolism website (http://www.nature.com/jcbfm)
The authors acknowledge the National Science Council, ROC, for their support of this research (NSC Nos. 97-2221-E-007-084-MY3, 96-2220-E-009-029, 97-2220-E-009-029, 99-2221-E-009-154, NSC 99-2911-I-009-101, 100-2911-I-009-101, and 100-2321-B-009-001) and funding support from the National Tsing Hua University (Boost program 98N2531E1) and the Ministry of Education, Taiwan.
Supplementary Material
References
- Bitton R, Zemp R, Yen J, Wang LV, Shung KK. A 3-D high-frequency array based 16 channel photoacoustic microscopy system for in vivo micro-vascular imaging. IEEE Transactions on Medical Imaging. 2009;28:1190–1197. doi: 10.1109/TMI.2008.2011899. [DOI] [PMC free article] [PubMed] [Google Scholar]
- Bouchard MB, Chen BR, Burgess SA, Hillman EMC. Ultra-fast multispectral optical imaging of cortical oxygenation, blood flow, and intracellular calcium dynamics. Opt Express. 2009;17:15670–15678. doi: 10.1364/OE.17.015670. [DOI] [PMC free article] [PubMed] [Google Scholar]
- Chen-Bee CH, Agoncillo T, Xiong Y, Frostig RD. The triphasic intrinsic signal: implications for functional imaging. J Neurosci. 2007;27:4572–4586. doi: 10.1523/JNEUROSCI.0326-07.2007. [DOI] [PMC free article] [PubMed] [Google Scholar]
- Chugh BP, Lerch JP, Yu LX, Pienkowski M, Harrison RV, Henkelman RM, Sled JG. Measurement of cerebral blood volume in mouse brain regions using micro-computed tomography. NeuroImage. 2009;47:1312–1318. doi: 10.1016/j.neuroimage.2009.03.083. [DOI] [PubMed] [Google Scholar]
- Culver JP, Siegel AM, Franceschini MA, Mandeville JB, Boas DA. Evidence that cerebral blood volume can provide brain activation maps with better spatial resolution than deoxygenated hemoglobin. NeuroImage. 2005;27:947–959. doi: 10.1016/j.neuroimage.2005.05.052. [DOI] [PubMed] [Google Scholar]
- Davis TL, Kwong KK, Weisskoff RM, Rosen BR. Calibrated functional MRI: mapping the dynamics of oxidative metabolism. Proc Natl Acad Sci USA. 1998;95:1834–1839. doi: 10.1073/pnas.95.4.1834. [DOI] [PMC free article] [PubMed] [Google Scholar]
- Dehghani H, Srinivasan S, Pogue BW, Gibson A. Numerical modelling and image reconstruction in diffuse optical tomography. Phil Trans R Soc A. 2009;367:3073–3093. doi: 10.1098/rsta.2009.0090. [DOI] [PMC free article] [PubMed] [Google Scholar]
- Duong TQ, Kim DS, Ugurbil K, Kim SG. Spatiotemporal dynamics of the BOLD fMRI signals: toward mapping submillimeter cortical columns using the early negative response. Magn Reson Med. 2000;44:231–242. doi: 10.1002/1522-2594(200008)44:2<231::aid-mrm10>3.0.co;2-t. [DOI] [PubMed] [Google Scholar]
- Harshbarger TB, Song AW. Endogenous functional CBV contrast revealed by diffusion weighting. NMR Biomed. 2006;19:1020–1027. doi: 10.1002/nbm.1067. [DOI] [PubMed] [Google Scholar]
- Hillman EMC. Optical brain imaging in vivo: techniques and applications from animal to man. J Biomed Opt. 2007;12:051402–051428. doi: 10.1117/1.2789693. [DOI] [PMC free article] [PubMed] [Google Scholar]
- Hillman EMC, Devor A, Bouchard MB, Dunn AK, Krauss GW, Skoch J, Bacskai BJ, Dale AM, Boas DA. Depth-resolved optical imaging and microscopy of vascular compartment dynamics during somatosensory stimulation. NeuroImage. 2007;35:89–104. doi: 10.1016/j.neuroimage.2006.11.032. [DOI] [PMC free article] [PubMed] [Google Scholar]
- Hu S, Wang LV. Neurovascular photoacoustic tomography. Front Neuroenerg. 2010;2:12. doi: 10.3389/fnene.2010.00010. [DOI] [PMC free article] [PubMed] [Google Scholar]
- Kim DS, Duong TQ, Kim SG. High-resolution mapping of iso-orientation columns by fMRI. Nat Neurosci. 2000;3:164–169. doi: 10.1038/72109. [DOI] [PubMed] [Google Scholar]
- Langham MC, Magland JF, Epstein CL, Floyd TF, Wehrli FW. Accuracy and precision of MR blood oximetry based on the long paramagnetic cylinder approximation of large vessels. Magn Reson Med. 2009;62:333–340. doi: 10.1002/mrm.21981. [DOI] [PMC free article] [PubMed] [Google Scholar]
- Li C, Aguirre A, Gamelin J, Maurudis A, Zhu Q, Wang LV. Real-time photoacoustic tomography of cortical hemodynamics in small animals. J Biomed Opt. 2010;15:010509–010503. doi: 10.1117/1.3302807. [DOI] [PMC free article] [PubMed] [Google Scholar]
- Li L, Zemp RJ, Lungu G, Stoica G, Wang LV. Photoacoustic imaging of lacZ gene expression in vivo. J Biomed Opt. 2007;12:020504. doi: 10.1117/1.2717531. [DOI] [PubMed] [Google Scholar]
- Li N, Jia X, Murari K, Parlapalli R, Rege A, Thakor NV. High spatiotemporal resolution imaging of the neurovascular response to electrical stimulation of rat peripheral trigeminal nerve as revealed by in vivo temporal laser speckle contrast. J Neurosci Methods. 2009;176:230–236. doi: 10.1016/j.jneumeth.2008.07.013. [DOI] [PubMed] [Google Scholar]
- Li PC, Ni SL, Zhang L, Zeng SQ, Luo QM. Imaging cerebral blood flow through the intact rat skull with temporal laser speckle imaging. Opt Lett. 2006;31:1824–1826. doi: 10.1364/ol.31.001824. [DOI] [PubMed] [Google Scholar]
- Liao L-D, Li M-L, Lai H-Y, Shih Y-YI, Lo Y-C, Tsang S, Chao PC-P, Lin C-T, Jaw F-S, Chen Y-Y. Imaging brain hemodynamic changes during rat forepaw electrical stimulation using functional photoacoustic microscopy. NeuroImage. 2010;52:562–570. doi: 10.1016/j.neuroimage.2010.03.065. [DOI] [PubMed] [Google Scholar]
- Lindauer U, Royl G, Leithner C, Kühl M, Gold L, Gethmann J, Kohl-Bareis M, Villringer A, Dirnagl U. No evidence for early decrease in blood oxygenation in rat whisker cortex in response to functional activation. NeuroImage. 2001;13:988–1001. doi: 10.1006/nimg.2000.0709. [DOI] [PubMed] [Google Scholar]
- Malonek D, Grinvald A. Interactions between electrical activity and cortical microcirculation revealed by imaging spectroscopy: implications for functional brain mapping. Science. 1996;272:551–554. doi: 10.1126/science.272.5261.551. [DOI] [PubMed] [Google Scholar]
- Mandeville JB, Marota JJA, Kosofsky BE, Keltner JR, Weissleder R, Rosen BR, Weisskoff RM. Dynamic functional imaging of relative cerebral blood volume during rat forepaw stimulation. Magn Reson Med. 1998;39:615–624. doi: 10.1002/mrm.1910390415. [DOI] [PubMed] [Google Scholar]
- Maslov K, Stoica G, Wang LV. In vivo dark-field reflection-mode photoacoustic microscopy. Opt Lett. 2005;30:625–627. doi: 10.1364/ol.30.000625. [DOI] [PubMed] [Google Scholar]
- Paxinos G, Franklin KBJ.2001The Mouse Brain in Stereotaxic Coordinates2nd edn. San Diego: Academic Press [Google Scholar]
- Paxinos G, Franklin KBJ. The Mouse Brain in Stereotaxic Coordinates. San Diego: Academic Press; 2003. [Google Scholar]
- Paxinos G.2004The Rat Nervous System3rd edn. San Diego: Academic Press [Google Scholar]
- Petrova IY, Petrov YY, Esenaliev RO, Deyo DJ, Cicenaite I, Prough DS. Noninvasive monitoring of cerebral blood oxygenation in ovine superior sagittal sinus with novel multi-wavelength optoacoustic system. Opt Express. 2009;17:7285–7294. doi: 10.1364/oe.17.007285. [DOI] [PubMed] [Google Scholar]
- Raichle ME, Stone HL. Cerebral blood flow autoregulation and graded hypercapnia. Eur Neurol. 1971;6:1–5. doi: 10.1159/000114443. [DOI] [PubMed] [Google Scholar]
- Roston S. The blood flow of the brain. B Math Biol. 1967;29:541–548. doi: 10.1007/BF02476591. [DOI] [PubMed] [Google Scholar]
- Seiyama A, Seki J, Tanabe H, Ooi Y, Satomura Y, Fujisaki H, Yanagida T. Regulation of oxygen transport during brain activation: stimulus-induced hemodynamic responses in human and animal cortices. Dyn Med. 2003;2:6. doi: 10.1186/1476-5918-2-6. [DOI] [PMC free article] [PubMed] [Google Scholar]
- Shih Y-YI, Chen C-CV, Shyu B-C, Lin Z-J, Chiang Y-C, Jaw F-S, Chen Y-Y, Chang C. A new scenario for negative functional magnetic resonance imaging signals: endogenous neurotransmission. J Neurosci. 2009;29:3036–3044. doi: 10.1523/JNEUROSCI.3447-08.2009. [DOI] [PMC free article] [PubMed] [Google Scholar]
- Siegel AM, Culver JP, Mandeville JB, Boas DA. Temporal comparison of functional brain imaging with diffuse optical tomography and fMRI during rat forepaw stimulation. Phys Med Biol. 2003;48:1391–1403. doi: 10.1088/0031-9155/48/10/311. [DOI] [PubMed] [Google Scholar]
- Stein EW, Maslov K, Wang LV. Noninvasive, in vivo imaging of blood-oxygenation dynamics within the mouse brain using photoacoustic microscopy. J Biomed Opt. 2009;14:020502. doi: 10.1117/1.3095799. [DOI] [PMC free article] [PubMed] [Google Scholar]
- Uludag K. To dip or not to dip: reconciling optical imaging and fMRI data. Proc Natl Acad Sci USA. 2010;107:E23. doi: 10.1073/pnas.0914194107. [DOI] [PMC free article] [PubMed] [Google Scholar]
- Van Hemelrijck J, Verhaegen M, Van Aken H. Cerebral effects of inhalational anaesthetics. Clin Anaesth. 1993;7:1035–1055. [Google Scholar]
- Vovenko E. Distribution of oxygen tension on the surface of arterioles, capillaries and venules of brain cortex and in tissue in normoxia: an experimental study on rats. Pflügers Arch Eur J Physiol. 1999;437:617–623. doi: 10.1007/s004240050825. [DOI] [PubMed] [Google Scholar]
- Weber R, Ramos-Cabrer P, Justicia C, Wiedermann D, Strecker C, Sprenger C, Hoehn M. Early prediction of functional recovery after experimental stroke: functional magnetic resonance imaging, electrophysiology, and behavioral testing in rats. J Neurosci. 2008;28:1022–1029. doi: 10.1523/JNEUROSCI.4147-07.2008. [DOI] [PMC free article] [PubMed] [Google Scholar]
- Yacoub E, Shmuel A, Pfeuffer J, Van De Moortele PF, Adriany G, Ugurbil K, Hu X. Investigation of the initial dip in fMRI at 7 Tesla. NMR Biomed. 2001;14:408–412. doi: 10.1002/nbm.715. [DOI] [PubMed] [Google Scholar]
- Yang G, Pan F, Parkhurst CN, Grutzendler J, Gan W-B. Thinned-skull cranial window technique for long-term imaging of the cortex in live mice. Nat Protoc. 2010;5:201–208. doi: 10.1038/nprot.2009.222. [DOI] [PMC free article] [PubMed] [Google Scholar]
- Yao J, Wang LV. Transverse flow imaging based on photoacoustic Doppler bandwidth broadening. J Biomed Opt. 2010;15:021304–021305. doi: 10.1117/1.3339953. [DOI] [PMC free article] [PubMed] [Google Scholar]
- Zhang HF, Maslov K, Stoica G, Wang LV. Functional photoacoustic microscopy for high-resolution and noninvasive in vivo imaging. Nat Biotechnol. 2006;24:848–851. doi: 10.1038/nbt1220. [DOI] [PubMed] [Google Scholar]
Associated Data
This section collects any data citations, data availability statements, or supplementary materials included in this article.


