

To the Editor
Human exposure to bisphenol A (BPA) is widespread.1 In adults, urinary BPA concentrations are positively associated with cardiovascular disease and diabetes.2 Exposure occurs primarily through the diet.3 Bisphenol A has been quantified in many canned goods,4,5 where it is present as a by-product of interior epoxy coatings used to prevent corrosion. We hypothesized that canned soup consumption would increase urinary BPA concentrations relative to fresh soup consumption.
Methods
In 2010, we recruited Harvard School of Public Health (HSPH) student and staff volunteers (aged >18 years) via informational fliers and e-mail. The study was approved by the HSPH institutional review board. Written informed consent was obtained.
We used a randomized, single-blinded, 2X2 crossover design. For the first 5-day period (October 25–29, 2010), one group consumed a 12-ounce serving of fresh soup (prepared without canned ingredients) daily between 12:15 and 2 PM; the other group consumed a 12-ounce serving of canned soup (from 18.5-ounce Progresso brand) per the same schedule. After a 2-day washout, treatment assignments were reversed (November 1–5, 2010). We used 5 different varieties of vegetarian soup per treatment and repeated them in the same order the following week. Participants were not restricted in their consumption of other foods.
Donation of spot urine samples took place between 3 and 6 PM on the fourth and fifth days of each phase. Urine was collected in polyethylene containers and stored in polypropylene cryogenic vials. When urine was donated both days, combined urine samples were created to minimize within-person variation. The specific gravity (SG) of the urine was measured using a handheld refractometer; total (free plus conjugated species) urinary BPA concentration was measured at the Centers for Disease Control and Prevention using online solid-phase extraction coupled to isotope dilution high-performance liquid chromatography–tandem mass spectrometry.6
Urinary BPA concentrations were adjusted for dilution by multiplying values (in μg/L) by [(1.014- 1)/(SG-1)]. In the absence of a period effect, we used a paired t test to examine mean absolute change in SG-adjusted untransformed urinary BPA concentrations (BPAcanned-BPAfresh) because differences were normally distributed, and we calculated confidence intervals for the mean using SAS version 9.2. Statistical tests were 2-sided and performed at the. 05 level of significance.
Results
Of 84 volunteers, 75 (89%) completed the study. Median age was 27 years and 51 (68%) were female; median treatment adherence was 100% (Table). Bisphenol A was detected in 77% (n=58) of samples after fresh soup consumption and 100% (n=75) of samples after canned soup consumption. The SG-adjusted geometric mean concentration of BPA was 1.1 μg/L (95% CI, 0.9–1.4 μg/L) after fresh soup consumption (unadjusted: 0.9 μg/L; 95% CI, 0.7–1.2 μg/L) and 20.8 μg/L (95% CI, 17.9–24.1 μg/L) after canned soup consumption (unadjusted: 17.5 μg/L; 95% CI, 14.1–21.8 μg/L). Stratification by treatment sequence revealed similar values (Figure). Following canned soup consumption, SG-adjusted urinary BPA concentrations were, on average, 22.5 μg/L higher (95% CI, 19.6–25.5 μg/L) than those measured after a week of fresh soup consumption (P<.001), representing a 1221% increase.
Table.
Characteristics of 75 Participants in Crossover Study of Changes in Urinary Bisphenol A Concentrations Associated With Daily Consumption of Canned Soup
| Characteristic | No. (%) |
|---|---|
| Sex | |
| Male | 24 (32.0) |
| Female | 51 (68.0) |
| Race/ethnicitya | |
| White | 39 (52.0) |
| Asian | 21 (28.0) |
| Black | 8 (10.7) |
| Hispanic | 6 (8.0) |
| Other | 1(1.3) |
| Age, median (range), y | 27 (22–56) |
| Adherence, median (range), %b | 100(60–100) |
Self-reported race/ethnicity was categorized by the investigators and assessed for the purpose of informing generalizability to other populations.
Adherence was calculated as the percentage of days that a participant consumed assigned soup.
Figure. Geometric Mean Specific Gravity–Adjusted Urinary Bisphenol A Concentration After a Week of Soup Consumption by Treatment Sequence.
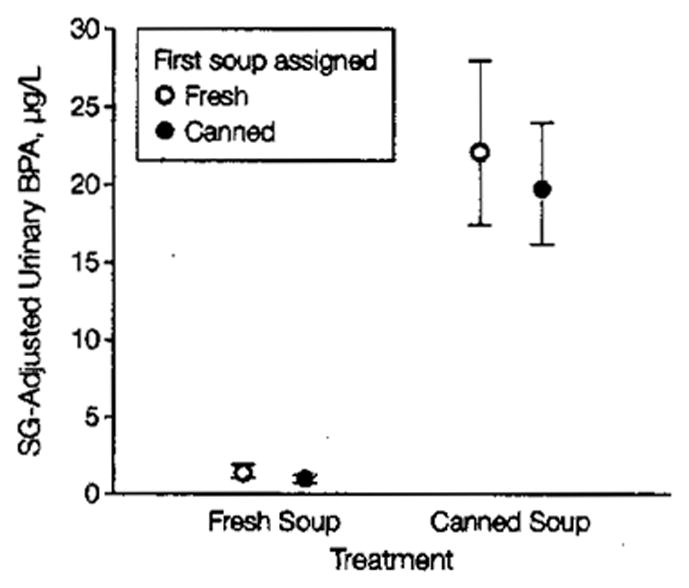
Geometric mean specific gravity (SG)–adjusted urinary bisphenol A (BPA) concentration following a week of daily consumption of fresh or canned soup. For reference, the unadjusted geometric mean for the 2007–2008 National Health and Examination Survey (NHANES) was 2.08 μg/L (95% CI, 1.92–2.26 μg/L), and the 95th percentile was 13.0 μg/L (95% CI, 10.0–15.4 μg/L). Error bars indicate 95% CIs.
Comment
Consumption of 1 serving of canned soup daily over 5 days was associated with a more than 1000% increase in urinary BPA. Generalizability is limited due to selection of participants from 1 school and testing of a single soup brand; however, generalizability to canned goods with similar BPA content is expected. The increase in urinary BPA concentrations following canned soup consumption is likely a transient peak of yet uncertain duration. The effect of such intermittent elevations in urinary BPA concentration is unknown. The absolute urinary BPA concentrations observed following canned soup consumption are among the most extreme reported in a nonoccupational setting. For comparison, the 95th percentile unadjusted urinary BPA in the 2007–2008 National Health and Examination Survey was 13.0 μg/L (95% CI, 10.0–15.4 μg/L).1 The observed increase in urinary BPA concentrations following canned soup consumption, even if not sustained, may be important, especially in light of available or proposed alternatives to epoxy resins linings for most canned goods.
Acknowledgments
Funding/Support: This project was supported by an Allen Foundation grant to Dr Michels. Ms Carwile was supported by a Training Grant in Environmental Epidemiology (T32 ES 007069) from the National institute of Environmental Health Sciences.
Role of the Sponsor: The sponsors had no role in the design and conduct of the study; in the collection, analysis, and interpretation of the data; or in the preparation, review, or approval of the manuscript.
Footnotes
Author Contributions: Ms Carwile had full access to all of the data in the study and takes responsibility for the integrity of the data and the accuracy of the data analysis.
Conflict of Interest Disclosures: All authors have completed and submitted the ICMJE Form for Disclosure of Potential Conflicts of Interest and none were reported.
Disclaimer: The findings and conclusions in this report are those of the authors and do not necessarily represent the views of the Centers for Disease Control and Prevention. The involvement of the Centers for Disease Control and Prevention (CDC) was limited and was determined not to constitute engagement in human subjects research.
Additional Contributions: We thank Lori Torf of the Harvard School of Public Health cafeteria for assistance with soup preparation and distribution; Martin Breslin of the Harvard Dining Services for providing the freshly prepared soups; Nikita Jambulingam (Harvard College) for assistance with data collection; and Lily Jia, MS, and Ryan Hennings (National Center for Environmental Health, Centers for Disease Control and Prevention) for technical assistance in measuring urinary BPA. None of the individuals acknowledged were compensated for the contributions.
Study concept and design: Carwile, Michels.
Acquisition of data: Carwile.
Analysis and interpretation of data: Carwile, Michels.
Drafting of the manuscript: Carwile.
Critical revision of the manuscript for important intellectual content: Carwile, Ye, Zhou, Calafat, Michels.
Statistical analysis: Carwile.
Obtained funding: Michels.
Administrative, technical, or material support: Carwile, Ye, Zhou, Calafat.
Study supervision: Michels.
References
- 1.Fourth National Report on Human Exposure to Environmental Chemicals. Centers for Disease Control and Prevention, National Center for Environmental Health; [Accessed October 31, 2011.]. http://www.cdc.gov/exposurereport/ [Google Scholar]
- 2.Lang IA, Galloway TS, Scarlett A, et al. Association of urinary bisphenol A concentration with medical disorders and laboratory abnormalities in adults. JAMA. 2008;300(11):1303–1310. doi: 10.1001/jama.300.11.1303. [DOI] [PubMed] [Google Scholar]
- 3.Wilson NK, Chuang JC, Morgan MK, Lordo RA, Sheldon LS. An observational study of the potential exposures of preschool children to pentachlorophenol, bisphenol-A, and nonylphenol at home and daycare. Environ Res. 2007;103 (1):9–20. doi: 10.1016/j.envres.2006.04.006. [DOI] [PubMed] [Google Scholar]
- 4.Noonan GO, Ackerman LK, Begley TH. Concentration of bisphenol A in highly consumed canned foods on the US market. J Agric Food Chem. 2011;59(13):7178–7185. doi: 10.1021/jf201076f. [DOI] [PubMed] [Google Scholar]
- 5.Concern over canned foods: our tests find wide range of bisphenol A in soups, juice, and more [December 2009] [Accessed August 24, 2011.];Consumer Reports site. http://www.consumerreports.org/cro/magazine-archive/december-2009/food/bpa/what-we-found/bisphenol-a-what-we-found.htm. [PubMed]
- 6.Ye X, Kuklenyik Z, Needham LL, Calafat AM. Automated on-line column-switching HPLC-MS/MS method with peak focusing for the determination of nine environmental phenols in urine. Anal Chem. 2005;77(16):5407–5413. doi: 10.1021/ac050390d. [DOI] [PubMed] [Google Scholar]