Abstract
Anterior ischemic optic neuropathy (AION) can be divided into nonarteritic (NAION) and arteritic (AAION) forms. NAION makes up ~85% of all cases of AION, and until recently was poorly understood. There is no treatment for NAION, and its initiating causes are poorly understood, in part because NAION is not lethal, making it difficult to obtain fresh, newly affected tissue for study. In-vivo electrophysiology and post-mortem studies reveal specific responses that are associated with NAION. New models of NAION have been developed which enable insights into the pathophysiological events surrounding this disease. These models include both rodent and primate species, and the power of a `vertically integrated' multi-species approach can help in understanding the common cellular mechanisms and physiological responses to clinical NAION, and to identify potential approaches to treatment. The models utilize laser light to activate intravascular photoactive dye to induce capillary vascular thrombosis, while sparing the larger vessels. The observable optic nerve changes associated with rodent models of AION (rAION) and primate NAION (pNAION) are indistinguishable from that seen in clinical disease, including sectoral axonal involvement, and in-vivo electrophysiological data from these models are consistent with clinical data. Early post-infarct events reveal an unexpected inflammatory response, and changes in intraretinal gene expression for both stress response, while sparing outer retinal function, which occurs in AAION models. Histologically, the NAION models reveal an isolated loss of retinal ganglion cells by apoptosis. There are changes detectable by immunohistochemistry suggesting that other retinal cells mount a brisk response to retinal ganglion cell distress without themselves dying. The optic nerve ultimately shows axonal loss and scarring. Inflammation is a prominent early histological feature. This suggests that clinically, specific modulation of inflammation may be a useful approach to NAION treatment early in the course of the disease.
Keywords: Nonarteritic anterior ischemic optic, neuropathy, Arteritic anterior ischemic optic neuropathy, Ischemic optic neuropathy, Optic nerve, Optic nerve gene expression, Inflammation, Optic nerve electrophysiology, Retinal ganglion cell, Axonal ischemia
1. Introduction
1.1. NAION and AAION: clinical presentation and pathophysiology
1.1.1. NAION: etiology and characteristics
Anterior ischemic optic neuropathy (AION) results from a sudden ischemic insult to the proximal portion of the optic nerve (ON). There are two main forms of AION: nonarteritic (NAION) and arteritic (AAION). The two forms are etiologically distinct. NAION comprises 85% of all cases of AION, with AAION the remainder. NAION is the most common cause of sudden optic nerve-related vision loss and typically affects individuals over 55 years of age (Miller, 1982a), whereas AAION is less common and usually affects persons over the age of 70.
Controversy still clouds the actual etiology of NAION. A well-recognized risk factor is a small optic nerve passage through the sclera, presumably causing crowding of axons within a tight dural sheath (the `crowded disk', or “disk at risk”) (IONDT study group, 1996); however a host of other factors, including age (IONDT study group, 1996), nocturnal or situational (e.g., perioperative) hypotension, diabetes mellitus, hypercholesterolemia, hypertension (Salomon et al.,1999), obstructive sleep apnea (Palombi et al., 2006), use of certain medications or drugs (Pomeranz and Bhavsar, 2005) and possibly a number of genetic sequence polymorphisms involving either mitochondria or genes associated with vascular function may contribute (Salomon et al., 2004; Bosley et al., 2004; Sakai et al., 2007). In addition, although it initially was believed that the optic nerve in pre-insult individuals was functionally normal, some individuals predisposed to NAION can have subtle vascular differences from control (non-NAION predisposed) eyes (Leiba et al., 2000; Collignon-Robe et al., 2004), suggesting that there are subclinical changes that may increase susceptibility. These include reduced optic nerve head blood flow as measured by laser Doppler flowmetry, in addition to the small optic nerve outlet (Leiba et al., 2000). The presence of electrophysiologic abnormalities in the clinically normal, fellow eye of patients with NAION supports this notion (Janaky et al., 2006). The combined factors of hypertension and age have led a number of investigators to suggest that NAION may be triggered by temporary loss of vascular homeostasis, with initially subtle tissue edema accumulating in a confined area, resulting in a tissue compartment syndrome (Levin and Danesh-Meyer, 2008). NAION damage is initially confined to the anterior ON, with retrograde pathology manifest both early and later. Levin and Danesh-Meyer suggested that transient venous insufficiency may initiate NAION (Levin and Danesh-Meyer, 2008). A minority of individuals with NAION also have arterial thrombosis or clots transmitted from the heart walls (Kerr et al., 2009) or carotid arteries. Regardless of the initiating event, the subsequent edema and further compression of ON capillaries in the restricted space of the optic nerve, with its closely confining, thick sheath, results in vascular compression and ischemia.
Fluorescein angiography performed in patients with early NAION occasionally reveals restriction of fluorescein flow through the retinal veins, possibly related to edema-associated vascular compression at or near the optic nerve head (Arnold et al., 1996). Choroidal fluorescein flow is normal in eyes with NAION, indicating no restriction in the choroidal blood supply. Fluorescein dye (a low molecular weight dye) leakage from the disk reveals breakdown of the blood-retinal barrier (BRB), with fluorescein diffusion into the vitreous, coupled with delayed early venous filling (Arnold et al., 1996). These vascular defects resolve over time. The loss of capillary integrity is similar to that seen in other central nervous system (CNS) infarcts, with breakdown of the blood–brain barrier (Cavaglia et al., 2001). The resolution of fluorescein dye leakage is an important indicator of BRB reconstitution. NAION-induced vision compromise may improve over time. Indeed, about 40% of patients with NAION experience spontaneous improvement in visual acuity of three lines or greater (although their visual field defects are much less likely to improve). Nevertheless, a significant percentage of individuals worsen (Arnold and Hepler, 1994).
1.1.2. AAION: etiology
In contrast to NAION, there is no congenitally abnormal optic disc structure that predisposes a patient to AAION. Rather, patients with AAION almost always have an underlying systemic autoimmune vasculitis. AAION results from inflammatory vascular occlusion of the short posterior ciliary arteries (SPCAs), leading to infarction within the optic nerve head (Arnold, 2003).
Despite etiologic differences, both NAION and AAION result in ON vascular compromise in the region at or near the junction of the eye and ON (anterior optic nerve). NAION and AAION both produce ON axonal ischemia, with localized infarction and loss of vision in the affected eye that may be severe, particularly in AAION. Thus, both AION forms result in ischemic axonopathy, with resultant stasis of axonal flow, disruption of electrical and growth factor-associated signaling, and disconnection of action potential-related communication between retinal and higher CNS structures. In this respect, both NAION and AAION are similar to other sudden axonopathic conditions, such as ON stretch, crush and axotomy (Schlamp et al., 2001; Nadal-Nicolas et al., 2009). Where NAION and AAION differ from each other is in the different physiologic responses to the stimulating event; the presence of an intact immune system in patients with NAION; the underlying factors predisposing to vascular dysfunction, edema and compression/compartmentation (i.e., vasculitis in patients with AAION versus non-inflammatory vasculopathies in patients with NAION); and the time-response of damage to long-axon retinal ganglion cell (RGC) neurons and their supporting glial cells within the CNS white-matter tract that is the optic nerve.
1.1.3. NAION: treatments
NAION is the single leading cause of sudden optic nerve-related vision loss around the world. While typically unilateral, 15–20% of individuals with unilateral NAION will experience NAION in the contralateral eye over the subsequent 5 years, and there is no consistently effective treatment to date, either to improve vision in an eye affected by NAION or to prevent visual loss from NAION in the fellow eye.
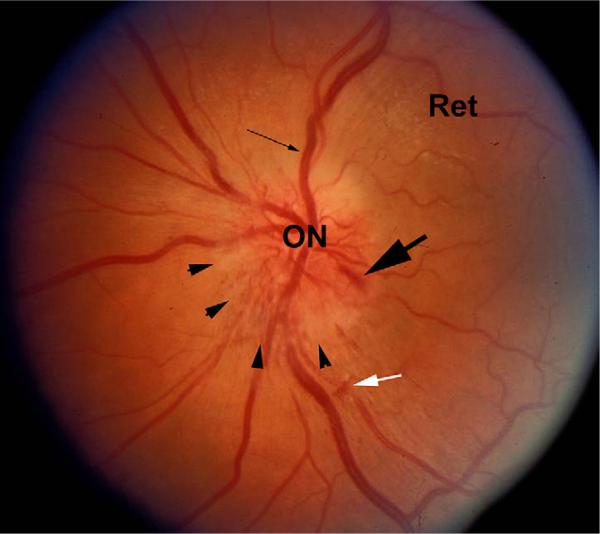
The most obvious finding following both NAION and AAION is edema of the optic nerve head (i.e., the optic disk). In both cases, AION-related ON edema may be associated with flame-shaped hemorrhages on or adjacent to the optic disk (Fig. 1). These hemorrhages may be related to vascular compression at the disk or to ischemia-reperfusion injury, with rebleeding from the damaged vessels. In addition, the more severe the infarct, the more pallid the swelling will be (hence, the tendency for AAION-associated disc edema to be pallid) with the pallor presumably related to the severity and extent of the ischemia.
Fig. 1.
Fundus photograph of an eye with NAION. The optic nerve (ON) and retina (Ret) are shown. There is obvious disk edema (arrowheads), with slight disk pallor. Venous dilation is apparent (thin arrow), and a disk hemorrhage (large arrow) is visible. A small intraretinal hemorrhage is also present (white arrow).
1.2. Electrophysiological findings in NAION and AAION
The visual evoked potential (VEP) is a cortical potential. It is recorded clinically by placing wire electrodes adjacent to the occipital cortex and to a non-visual area of the brain; the stimulus, viewed by the patient, is typically an alternating high contrast checkerboard, although many other types of stimuli have been used. The VEP reflects the patency of the visual system up to primary visual cortex. It is used clinically to examine the function of the optic nerve and its cortical projections.
The predominant feature of the visual evoked potential (VEP) in eyes with NAION is reduction in amplitude, often severe, with little or no change in latency (Wilson, 1978), unlike the increase in latency that occurs in most other optic nerve disorders. When changes in latency are seen, they are small and have been attributed to: 1) dominance of perimacular responses due to reduction in central function (Thompson et al., 1986). 2) In patients with inferior altitudinal field defects, to selective input from the superior field that normally has a longer latency (Wildberger, 1984).
There are several types of electroretinogram (ERG) that are recorded in the clinic. The ganzfeld (full-field) ERG is recorded by flashing lights of varying color, intensity, etc., into an integrating sphere, homogenously illuminating the entire retina. When recorded using a corneal electrode, it reflects the average activity of all retinal cells having a graded response, with limited contribution from spiking cells. In contrast, the pattern ERG (pERG), recorded using the same type of stimulus as the pattern VEP, contains significant ganglion cell response.
Little attention has been paid to the full-field ERG in NAION. However, the pattern ERG (pERG) N95 component, which can be totally attributed to the activity of spiking cells in the retina (Viswanathan et al., 2000), is reduced in NAION patients who have been affected relatively acutely (<35 days) (Froehlich and Kaufman, 1994). This result is in agreement with the reduced ERG photopic negative response (PhNR) found in patients with NAION and in monkeys who have had the contribution of retinal spiking cells to the ERG eliminated with pharmacologic blockade (Rangaswamy et al., 2004). Interestingly, this latter study also found PhNR reductions in the fellow, normal eyes of patients with NAION, suggesting predisposing physiologic characteristics, and in agreement with an earlier study of bilateral ERG oscillatory reductions in patients with chronic unilateral AION (Tormene et al., 1989). All of these ERG studies document abnormal ganglion cell function in NAION eyes, either from retrograde degeneration or from subclinical impairment of the ON and its cell body.
1.3. Anatomy and vascular supply of the anterior optic nerve
A perfect (i.e., clinically identical) animal model of human NAION would take into account not only the associated patho-physiological contributing factors (e.g., `crowded disk', underlying vascular risk factors, age), but the ON itself would be physiologically identical in terms of structure, vasculature, size and control mechanisms. It is unreasonable to expect any model to be identical with the human clinical condition but, rather, it is appropriate to utilize these models to obtain physiologically accurate and predictive data comparable to the human condition. A comparison of the similarities and differences between human, nonhuman primate, and rodent ON is therefore essential.
In all species, the optic nerve is a white-matter CNS tract formed by the long-axon neurons of retinal ganglion cells and myelinated by oligodendrocytes rather than Schwann cells. The dura of the ON sheath is continuous with the sclera. The mouse ON possesses roughly 50,000 axons (Williams et al., 1996); the rat, 100,000 (Perry et al., 1983); the rhesus monkey and human, 1.1–1,200,000 (Morrison et al., 1990). Axonal fiber diameters are similar among all species, and diffusion coefficients are identical among all mammalian species (Fukuda et al., 1988). Thus, there is a 20-fold factor in axon numbers between rhesus and mouse ON, with a corresponding increase in intraneural vascularization.
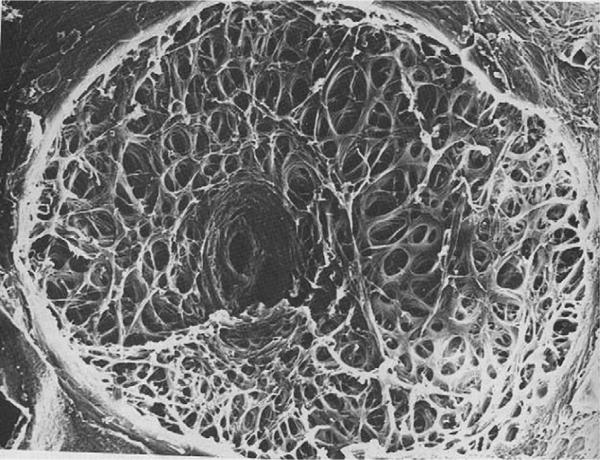
One of the major differences in ON-related anatomy between rodents and primates is in the lamina cribrosa (LC) (Albrecht, 2008). The LC is a complex structure that permits the RGC axons to penetrate the globe, and emerge as the ON. The primate lamina cribrosa consists of both a glial laminar element and a connective tissue laminar element. The latter consists of connective tissue sheets that form the pores through which the RGC axons pass (Miller, 1982b) (Fig. 2).
Fig. 2.
10× Photograph of a primate lamina cribrosa as viewed from the vitreous cavity.
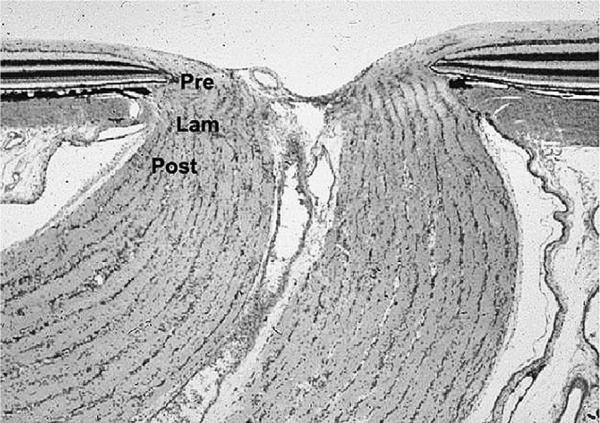
Considerable research has focused on the primate LC, and an extensive description is beyond the scope of this review; however, briefly, the LC subdivides the intraocular portion of the ON into three zones: prelaminar (visible by fundus examination), intra-laminar, and post-laminar (Miller, 1982b) (Fig. 3).
Fig. 3.
Longitudinal section (10× magnification) of normal primate optic nerve showing prelaminar (Pre), Laminar (Lam) and Retrolaminar (Post) portions of the nerve.
Within this junctional zone, axons pass from a region of higher pressure (intraocular) to lower pressure (intraorbital–intracranial), as they form the optic nerve. There are also changes in composition of the glial components, with few astrocytes and unmyelinated axons in the prelaminar region and many more astrocytes and myelinating oligodendrocytes in the post-laminar region.
In rodents, the glial component of the lamina is similar to that of primates, but there are marked differences in the connective tissue component between rodent and primate (Morrison et al., 1995; Johansson, 1987). Rather than tissue sheets, the connective tissue component in rats is comprised of fiber bundles (Albrecht, 2008). In mice, no LC connective tissue component exists (Albrecht, 2008). This undoubtedly accounts for some of the visible differences in edema seen after AION induction in the mouse vs the rat (see below). To summarize, LC collagen sheets seen in primates are replaced by collagen bundles in rats, and are largely absent in mice (May and Lutjen-Drecoll, 2002). These differences likely alter the impact of compartmentation associated with ON ischemia, which is believed to be integral to the development of NAION. In particular, the absence or minimization of the collagenous component of the LC in rodents, and the thinness of the sclera in most small animals are likely to change the response of their eyes to the pressure exerted by tissue edema in AION, resulting in marked differences in the appearance of ON head edema. These differences are discussed later in this review.
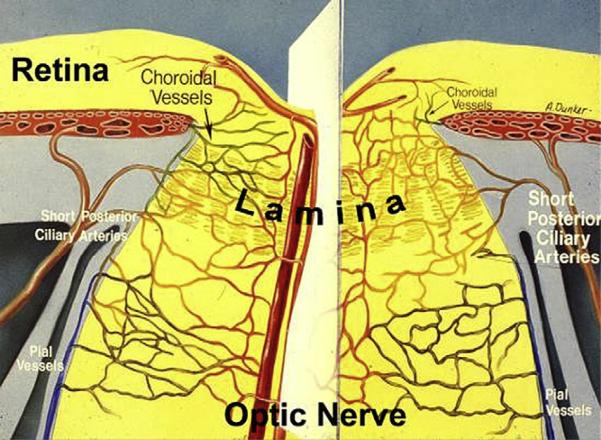
Vascularization of the anterior ON region is complex. In primates and rats, both the retina and ON are supplied by vessels that penetrate the sclera around the ON (Fig. 4). Inner retinal circulation is supplied via the central retinal vessels that enter (central retinal artery) or leave (central retinal vein) the eye through the optic nerve. The intraretinal portion of the ON is supplied by capillaries derived from the same central retinal vessels supplying the inner retina, although this can be quite variable in rats (Morrison et al., 1999; Bernstein et al., 2003) (Fig. 5). In distinction, choroidal circulation supplying outer retinal (photoreceptor) function and the perineural vascular arcade supplying the intrascleral portion of the ON (the perioptic nerve arteriolar anastomoses forming the `circle of Zinn-Haller') in both primates (humans) and rats are derived from the SPCAs (Morrison et al., 1999; Olver and McCartney, 1989; Hayreh, 1974). The vascularization of the posterior (post-laminar) portion of the ON in primates and rats is supplied by vessels originating from the pial plexus surrounding the ON and, possibly, recurrent arterioles emanating from the circle of Zinn-Haller as well. There also may be variations and anastomoses between the two circulatory supplies. In rats, the choroidal vascular ring surrounding the ON is usually complete (Bernstein et al., 2003), with capillaries perfo-rating the intrascleral ON. Because of the rats relatively large optic nerve diameter compared to the mouse, the vascular supply of the rat ON is similar to that of primates in the relative abundance of ON capillaries (Fig. 7). Mice on the other hand, typically have an incomplete vascular ring surrounding the nerve at the level of the choroid (Goldenberg-Cohen et al., 2005; May and Lutjen-Drecoll, 2002). The lack of a complete ring may be an important contributor to the overall variability of the extent of ischemic neuropathy expression following AION induction. Mice also have a recurrent arterial supply deriving from the retinal circulation (May and Lutjen-Drecoll, 2002), that, due to its larger diameter, may be more resistant to photothrombotic ischemic induction. There is also a generally sparse vascular supply to the mouse ON, due to its small ON diameter (compare Fig. 5, mouse ON circulation, with that of rat and human).
Fig. 4.
Optic nerve (ON) vasculature. Short posterior ciliary arteries perforate through the sclera (intrascleral region) around the optic nerve and supply the choroid, as well as forming an anastomotic vascular circle the circle of Zinn-Haller (ZH), which contributes to the vascular supply of the anterior ON. ON capillaries (ONCs) are supplied from the ZH and anastomose with choroidal vessels, as well as intraretinal capillaries in the region of the optic nerve. ON capillaries posterior to the lamina are also supplied by pial vessels near the ON sheath and also contributed from the central retinal artery (CRA) and central retinal vein (CRV). These large central vessels ultimately supply the inner retina. Figure modified from (Lieberman et al., 1976).
Fig. 5.
Comparison of scanning electron micrographs of ON capillary supply in Human (A), Rat (B) and Mouse (C). In humans, ON capillaries are largely derived from feeder branches (arrows) derived from the choroidal vasculature (Chor) surrounding the optic nerve (ON). Rats have a similar ON capillary structure largely derived from the choroid (Chor). In mice, the ON capillary structure is much sparser, with few capillaries draining into the central retinal vein (V). Data from (Human: Olver and McCartney, (1989); Rat: Morrison et al., (1999); Mouse: May and Lutjen-Drecoll, (2002). Scale bar: 1 micron.
Fig. 7.
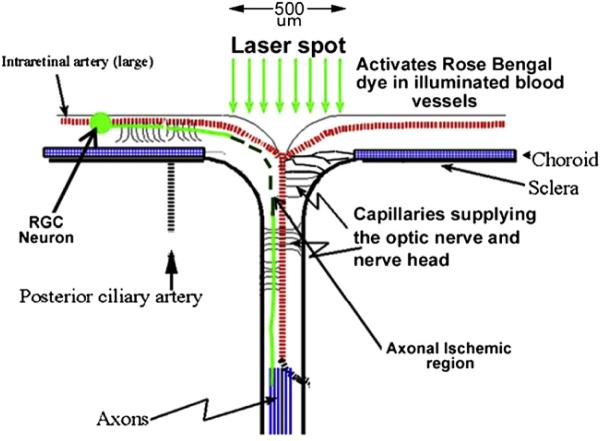
rAION induction schematic. A contact lens is placed on the rodent cornea, enabling clear visualization of the retina and optic disk. A 500-micron diameter laser spot (focal laser illumination) is used to irradiate the optic disk, largely sparing the surrounding retina and vessels. Laser-activated dye generates singlet oxygen that, in turn, causes thrombosis of the capillaries supplying the ON axons (axonal ischemic region). Axonal ischemia is limited to the exposure site.
2. Generating a model of nonarteritic AION (NAION)
CNS stroke models utilizing laser-induced photothrombotic induction of CNS ischemia have been produced by a number of investigators (Watson et al., 1985; Zhao et al., 2002; Frontczak-Baniewicz and Gajkowska, 2001). This approach has also been used to produce retinal ischemia (Mosinger and Olney, 1989). We induced NAION using Rose Bengal (RB), an iodinated fluorescein derivative that fluoresces brightly over a broad range of visible wavelengths, including argon-green laser light (514 nm) (Fluhler et al., 1989). It is a potent inducer of singlet oxygen (Rodgers, 1981). RB's maximal excitation wavelength is closer to the emission wavelength of a frequency-doubled neodymium-YAG (Fd-YAG) laser diode (532 nm; Fig. 5) (Rodgers, 1981) than of an argon laser (514 nm). Because of this, it is necessary to adjust the NAION induction energy when changing between these two sources. For example, inductions requiring 15 s when using an argon laser require just 12 s when using an Fd-YAG laser, at the same energy output (50 mW).
Previous studies in CNS tissue and in vitro have determined that it is the generation of singlet oxygen, and not light-derived heat energy, that is responsible for vascular damage in the majority of these models (Rodgers, 1981; Lambert et al., 1996; Wilson and Hatchell, 1991). It also appears that it is damage to the capillary endothelium and not direct singlet oxygen derived platelet activation that is the primary pathophysiological event (Inamo et al., 1996). Rose Bengal is excreted hepatically, with first order kinetics. Thus, circulating RB levels quickly drop after intravenous administration, similar to that seen after intravenous injection of fluorescein.
Other singlet dyes have been used in modified AION models that expose the intraorbital portion of the ON, and have a slower rate of excretion, enabling longer exposure times or time till induction (Duan et al., 2010). The latter approach is limited by the need for microsurgical skill and operative recovery.
2.1. Rodent Nonarteritic anterior ischemic optic neuropathy (rAION)
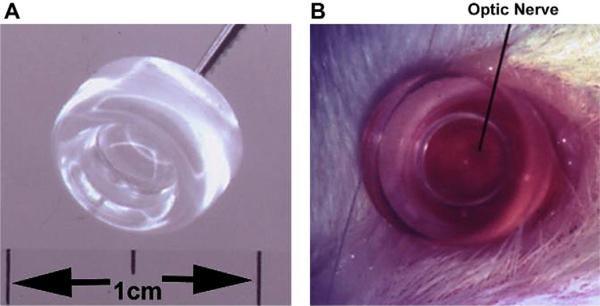
A major problem in producing consistent laser treatment of small animals is the difficulty of focusing and fixing the rodent eye for stable treatments. This can be resolved by using a small fundus contact lens that fits over the eye, and which has a flat anterior surface. It does not need to be held in place but is stabilized on the cornea using 2.5% methylcellulose (see Fig. 6).
Fig. 6.
Rat fundus contact lens. The contact lens is 8 mm wide (Panel A), with a flat front surface. When applied with a coupling agent such as methylcellulose, the retina and optic nerve can be easily visualized (panel B), and treated, without compromising retinal circulation.
The flat anterior surface eliminates most of the internal reflection generated by the cornea, thus enabling clear visualization of the retina and optic disk. Generating this self-seating fundus contact lens for rats is a relatively simple procedure, requiring an 8-mm thick circular piece of optically clear plexiglass (cut out by a drill press) with an internal curvature generated by a drill bit, and polished smooth. Once the lens is in place, the fundus is visualized through a standard slit-lamp biomicroscope in the anesthetized animal (see Fig. 6). Rose Bengal is eliminated with first pass kinetics, which means that the level of intravenous RB will decline rapidly after injection. For consistency, all inductions are performed at the same times between injection and laser exposure. With the contact lens already in place, we inject RB and induce rodent AION (rAION) within 1 min following injection. The focal laser spot size is determined by the size of the optic nerve, which is ~500 microns in the rat (Fig. 7), and the laser light is centered on the ON (Fig. 7). Laser-induced RB activation results in capillary thrombosis at the level of the anterior optic nerve (Fig. 7; axonal ischemic region). The larger central retinal vessels are relatively resistant to this treatment. Thus, the rAION model spares the inner (central) retinal vasculature, and selectively damages circulation to the optic nerve. The relative resistance of the inner retinal circulation is due to the comparative size of the exposed vessels. Smaller diameter capillaries supplying the optic nerve axons within the disk are affected much more than the large caliber vessels that supply the inner retina, and that emerge from the optic disk. The sparing of inner retinal vasculature is only relative, since prolonged exposure can result in central retinal artery or vein occlusion.
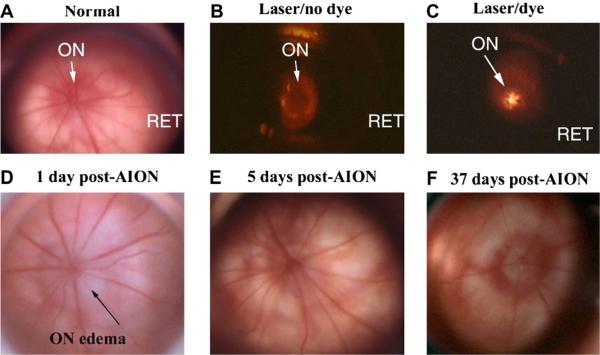
Using a standard Fd-YAG (such as an Iridex Oculight GL) or argon ophthalmic laser coupled to a standard clinical slit-lamp enables adjustment of the appropriate laser spot size to expose the entire intraocular portion of the ON (Bernstein et al., 2003; Goldenberg-Cohen et al., 2005). When RB is activated by green laser light, it glows a brilliant golden color (Fig. 8C).
Fig. 8.
Comparison of retina and disk before, during and after rAION induction. Slit- lamp biomicroscopic view (high magnification) seen with rat fundus contact lens. A. control (pre-induced) rat optic nerve (ON) and retina RET. The ON is flat against the retina. Radial retinal vessels emerge from the ON to supply the inner retina. B. Laser exposure without RB dye administration. The ON is dark. C. Laser exposure after RB dye administration. The central vessels glow with a golden color, indicating dye activation. D. ON 1 day post-induction. ON edema is present, with ON pallor and obscuration of the disk margin. Retinal vascular dilation occurs in vessels emerging from the disk, suggesting that intrascleral ON edema has caused vascular compression, similar to that seen in human NAION. E. ON appearance 5 days post-induction. ON edema has resolved, with nearly normal appearance. F. ON appearance 37 days post-induction. The ON disk is pale and apparently reduced in size, suggesting atrophy and loss of vascularization. Choroidal vascularization surrounding the ON is intact.
Singlet oxygen generated by the laser-activated dye has the potential to damage the vascular endothelium in both large (central retinal artery and vein) and smaller vessels at the optic nerve. We have seen that, within the rat ON, the central (presumably smallest) vessels are more susceptible to infarction. This may be because they have a higher surface area to volume ratio, than the larger, peripheral vessels. The amount of laser energy is adjusted so that thrombosis occurs only in the capillaries, preserving flow to the inner retinal layers. As previously mentioned, progressively increasing laser energy can result in branch or central retinal vein occlusions (BRVO/CRVO) and with long exposure times (typically>25 s), central retinal artery occlusion (CRAO). Singlet oxygen decays with a picosecond half-life; laser-induced primary singlet O2 damage is limited to the focal area of laser exposure.
Unlike the rabbit, rat (and mouse) retinal fundi are similar to human retina in their intraretinal vascularization patterns. The significant exception to this is the lack of any defined macular area in rodents as there is in both human and nonhuman primates. Retinal vessels supplying the inner retina divide from the central retinal artery and vein, which emerge from the intraocular portion of the ON (Fig. 8A). Normally, the intraocular portion of the ON (i.e., the optic disk) is flat. In albino animals, a reddish hue generated by the choroidal vasculature can be seen surrounding the ON. The retinal vasculature is of normal caliber. If the optic nerve is illuminated with an inducing laser without dye administration (or if the injected dye has infiltrated into the surrounding tissue, rather than distributed intravenously), the laser exposure does not illuminate the ON disk, which remains dark (Fig. 8B).
Laser illumination of intravascular RB dye using a 500-micron spot size centered over the optic disk results in dye excitation/activation at the site of laser exposure, with a beautiful golden color seen during the light exposure (Fig. 8C). One day post-induction, the rat ON disk shows changes typical of ON head ischemia; i.e., swelling and, in most cases, whitening of the ON (pallor). Interestingly, there is usually some dilation of the larger intraretinal veins (Fig. 8D), suggesting that the edema results in restriction of vascular return through the central retinal vein, similar to that seen in human NAION. In humans, NAION-associated optic disk edema usually takes at least 2 weeks to resolve and, in some cases, lasts for over a month. In rats, rAION-induced ON edema rapidly resolves. Five days post-induction, ON edema has resolved and the ON appears relatively normal, with normal vascular caliber (Fig. 8D). Nevertheless, by 1 month or longer after induction, there are clear indications of ON ischemic damage, with shrinkage and pallor of the disk itself, suggesting decreased function. Photographing each animal prior to induction, 1–2 and 7 days after induction, enables a close comparison of early changes. However, as ON edema is best seen in three dimensions, binocular slit-lamp examination is used to assess the overall appearance of the disk and vasculature (Fig. 8). Newer techniques, such as high resolution OCT, are also being used. In addition, we have reason to believe that there is considerable difference in ON sheath compliance between rodents and primates. The rodent ON has a much thinner ON sheath; with far more compliance, it will stretch more easily following ON axonal swelling. This may translate into reduced extent of grossly apparent ON edema, compared with primates. Additionally, because of the normal variation in vasculature of each animal, idiosyncratic response laser responses, varying angles of incidence of laser exposure, and a host of other factors, there is some variation in the severity of rAION induction between any two animals, despite consistent laser settings and technique.
We routinely utilize a 12-second exposure to obtain 35–65% (average 50%) RGC loss from Sprague–Dawley rats, quantified using stereological analysis of Brn 3a (+) immunopositive cell bodies in the RGC layer, 30 days post-induction. Differences in color appearance of the disk following laser induction are not reliable indicators of the degree of damage and should not be used as an indication of the level of rAION/NAION induced.
2.2. Histological changes in retina following rAION
The area of the primary rAION infarct lesion is not at the level of the retina but deeper within the anterior optic nerve. This has been shown both by early India ink filling as well as later hematoxylin and eosin (H&E) staining of histological sections (Bernstein et al., 2003). Interestingly, the anterior ON at, or near the level of the lamina cribrosa is believed to be the site of the primary lesion in human NAION (Arnold, 2003).
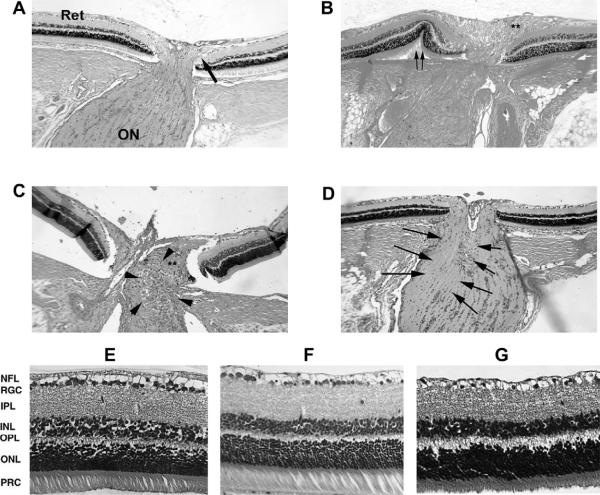
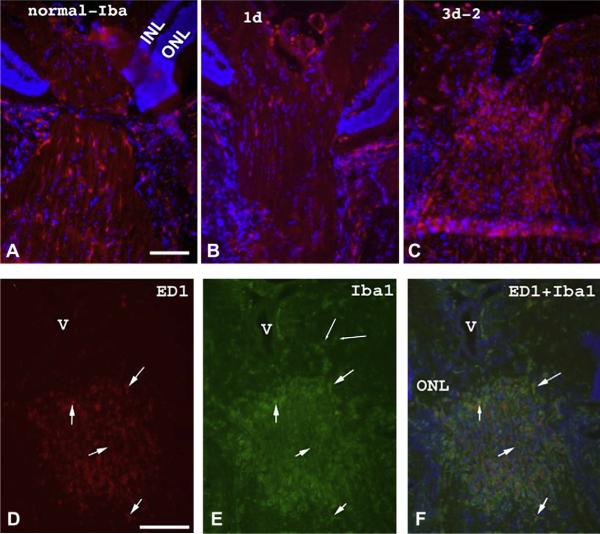
Histological longitudinal sections of the retina:optic nerve junction can be used to compare infarct-associated changes resulting from rAION. In naïve eyes, the retina and intraocular portion of the optic nerve are flat against the sclera (Fig. 9, panel A; large arrow). One day post-AION induction, there is optic nerve edema (Fig. 9, panel B, asterisks), associated in many cases with peripapillary (the retinal region closest to the optic nerve) retinal displacement (Double arrows in Fig. 9, panel B). By three days post-induction, there is disruption of the regular cellular columns in the optic nerve (Fig. 9, panel C), and accumulation of inflammatory cells in the area of the primary infarct (Fig. 9, panel C, arrowheads). By two weeks, there is a loss of the normal oligodendrocyte nuclear columnar structure within the optic nerve (arrows, Fig. 9, panel D).
Fig. 9.
Retina and optic nerve histological changes following rAION. A. Control nerve: The retina (Ret) is flat against the sclera, and the RGC-axonal fibers makes a 90° turn to enter the optic nerve (ON). B. rAION nerve 1d post-induction: there is optic nerve edema (double asterisks), with peripapillary retinal displacement (double arrows). C. Optic nerve 3 days post-rAION. There is an inflammatory cellular infiltrate. D. Optic nerve 21 days post-rAION. There is an asymmetric (one side of the ON; indicated by arrows) loss of oligodendrocytes columns, with residual infiltrate. E. Normal retina: there is a dense monolayer of retinal ganglion cells (RGCs). F. Retina from animal treated with laser without RB dye. No RGC loss is seen 90 days following rAION induction. G. Retina 90 days post-rAION. There is considerable loss of RGCs, without detectable change in the INL or ONL, and a thinning of the NFL layer. (A–D: 100× magnification, E–G: 200× magnification).
Following induction of rAION, the retina shows RGC-specific changes following rAION. The control (rat) retina has a crowded monolayer of RGCs (RGC layer, Fig. 9, panel E). No changes are seen in any cell layer in eyes that have been treated with laser alone (50 mW/15 s). These eyes have a normal RGC layer (Fig. 9, panel F). In contrast, 90 days post-rAION induction, there is severe RGC loss (Fig. 9, panel G). No cellular loss is seen in other retinal layers, suggesting that the rAION lesion specifically targets RGCs, and does not directly damage other retinal cell types (Bernstein et al., 2003).
rAION results in RGC loss by apoptosis, beginning at 7 days (Slater et al., 2008). The majority of RGC loss occurs by 21 days post-induction, revealed by loss of both cell bodies in the ganglion cell layer and loss of Brn-3a and -3b immunostaining. This latter point is important because, unlike rAION, the RGC soma in high pressure glaucoma models may remain long after axonal degeneration has occurred (Soto et al., 2008). This suggests that the form of neuronal loss caused by optic nerve-related damage can vary in presentation, depending on the type of insult.
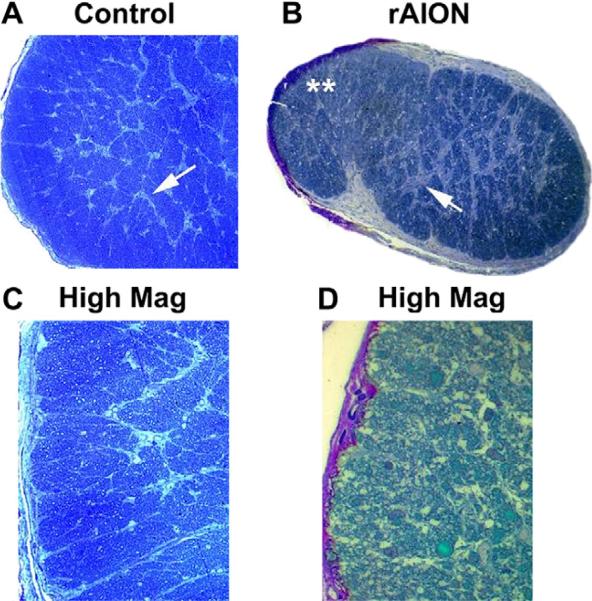
rAION results in considerable alterations in rat optic nerve morphology, compared with control ON (Fig. 10, compare panels A and C, with B and D).
Fig. 10.
Changes in the ON post- rAION induction. Toludine blue-stained sections. A. Control. The normal rat ON contains myelinated RGC axons tightly packed in between thin septae (panel A; arrow). C. Control, high magnification. Axons are divided into septated bundles. B. rAION, 3 months post-induction. There is reduced overall volume, with increased septal thickening (panel B; arrow). Panel D. High magnification of rAION-induced ON reveals axon loss and disruption within individual axonal bundles, with scarring. Magnification A,B: 40×. Magnification C, 60×; Magnification D; 100×.
Toluidine blue-stained cross-sections of the normal rat ON reveal tightly packed axon bundles surrounded by individual thin septae (Fig. 10A and C). Three months post-rAION induction, there is septal thickening (Fig. 10B; arrow), overall shrinkage in volume and reduction in the size of individual axon bundles (Fig. 10B). There is also visible axon loss (Fig. 10 D). Axonal loss is typically regional, but variable. Post-infarct demyelination is also evident at this time, with loss of central myelination that is revealed both by changes in luxol fast blue staining and evidence of oligodendrocyte apoptosis at the light microscopic level (Goldenberg-Cohen et al., 2005), and by `myelin unwinding' and bare axons demonstrable at the transmission electron microscopic level (not shown).
The dichotomy between the histological evidence of post-stroke demyelination and lack of electrophysiological data supporting demyelination (prolongation of the VEP) as a component in clinical NAION is puzzling. Prolongation of clinical VEP signal in classical demyelinating optic neuropathies is a prominent feature of the disease. One possible explanation is that the VEP is a processed signal detected after arriving at the occipital cerebral cortex. Since the optic nerve initially projects to the thalamus (in humans, mainly to the lateral geniculate nucleus), there may be a filtering effect that suppresses disparate signals generated from the optic nerve. Another possible explanation may be that the fraction of viable, but demyelinated axons in the NAION models is less than that detectable by the total contribution of either non-affected axons. Regardless, rAION results in a loss of RGCs and their axons, with optic nerve scarring. The VEP in these cases is reflecting the activity of the remaining normal neurons and hence is smaller, as the population of normal neurons has decreased.
2.3. rAION-associated electrophysiological changes
Visual evoked potential (VEP) amplitudes decrease following rAION and the primate model of NAION (pNAION; discussed later in this chapter). Despite our immunohistochemical finding of demyelination of some optic nerve fibers in our rodent model, the visual evoked potentials (VEPs) from animals with rNAION, pNAION and human NAION do not show increases in latency. The explanation may be that there is irreversible damage to individual axons, but the remaining axons have normal conduction.
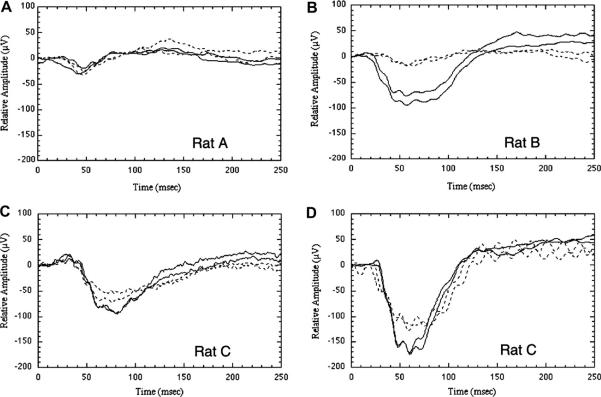
Fig. 11 illustrates VEPs generated from treated eyes (dotted traces) compared with responses from fellow, control eyes (solid traces). VEP amplitudes vary widely among individual animals, but the variability between eyes of the same animal is low. Although treatment exposure was not standardized in this study, the median amplitude reduction in the treated eye was 20%. No changes are seen in non-RB, laser-treated eyes when compared with controls (Fig. 11A, rat A). VEP responses from individual rAION-affected animals are always reduced compared with control eyes, but the level of reduction varies between animals. VEP differences between rAION-affected and control eyes in individual animals range from 17% (Fig. 11C, rat C) to 70% (Fig. 11B, rat B). These VEP amplitude differences between treated and untreated eyes are statistically significant (two tailed paired t-test; P 0.015; n = 16; t = 2.77). The VEP amplitude depression at early times after rAION induction (e.g., Fig. 11C, rat C; 3 days) continues even 45 days after induction (e.g., Fig. 11D, rat C; 45 days; dotted trace). Thus, rAION produces a loss of ON electrical function, with permanent degradation of normal ON electrical activity.
Fig. 11.
VEPs in rAION. rAION was induced in the right eye of each rat; the untreated left eye served as a control. Animals were euthanized at various times following induction. Differences in amplitude between individual panels are not comparable. In all panels, solid traces represent the control (left) eye, dotted traces the experimental (right) eye. The two similar traces in each panel are duplicate recordings. (A) Responses in an animal 1 day after laser irradiation of the right eye with no photoinducible dye (positive control). VEP amplitudes are very similar in both eyes. (B) There is a large reduction in the VEP of the treated eye 1 day following maximum rAION induction. (C) VEPs from a different animal recorded 3 days after rAION induction. A 23–28% decrease in amplitude is present in the experimental eye. (D) Long-term changes in the same rat (rat C) 45 days after rAION induction. The experimental eye continues to show an approximate 23–28% decrease in amplitude.
2.4. rAION-associated alterations in retinal gene expression
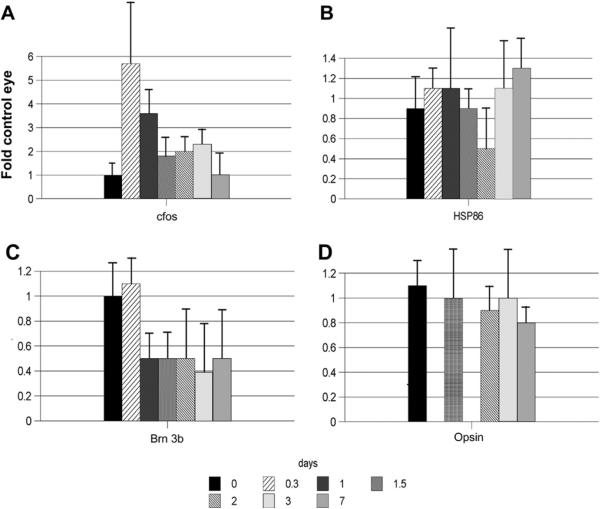
Changes in the gene expression of rAION-affected retinae and optic nerve (as measured by changes in the messenger RNA levels of specific transcripts) undoubtedly occur. We quantified messenger RNA expression, utilizing complementary DNA (cDNA) reverse-transcribed from the mRNA of five total retinae at different times pre- and post-induction via the polymerase chain reaction (PCR), using an internal expressed control (Beta-actin). RNA from the contralateral (uninduced) eye of each animal was utilized in each group for internal comparison. We initially evaluated rAION-associated changes in retina- and RGC-specific expressed genes (Brn-3b); photoreceptor-specific genes such as opsin to determine if rAION disrupted photoreceptor/outer retinal function, and early-and other stress-associated genes (cfos, the HSP90 alpha isoform: HSP86). rAION induction conditions were set to ~50% estimated RGC loss. Results are shown in Fig. 12.
Fig. 12.
rAION-induced changes in retinal gene expression: Temporal analysis. rAION induction was performed to predicted 50% RGC loss (n = 5 animals/group). Total RNA was isolated, with rq-PCR analysis done at 7 time points (0–7 days). Genes shown: cfos (immediate early stress response); Opsin (rod photoreceptor); Brn 3b (POU domain transcription factor expressed in the retina exclusively in RGCs); HSP86 (a chaperone highly expressed in RGCs, but also expressed in all retinal cells). There is early upregulation (5-fold) of retinal cfos expression which quickly declines by 2 days post-induction. Rod opsin levels do not vary significantly. In contrast, Brn 3b shows a ~50% decline by one day post-induction. The HSP86 response is more complex, with an apparent bimodal change in expression.
After rAION induction there is a rapid (by 8 h) induction (>5 fold over baseline) of retinal cfos in rAION eyes, compared with contralateral control eyes (Fig. 12A). This expression declines rapidly to less than two-fold by 36 h post-induction (Fig. 12A, compare 0.3 and 1.5 days). There may be a second moderate (bimodal) retinal expression peak by 3 days, with decline to baseline cfos level by 1 week post-induction (Fig. 12A). HSP86 (HSP90 alpha) expression also apparently responds in a bimodal fashion but more modestly (Fig. 12B). In contrast, Brn 3b, an RGC-specific transcription factor, declines approximately 50% by 1 day and remains low after 1 week (Fig. 12C). Photoreceptor-specific gene expression, monitored by opsin does not change (Fig. 12D), suggesting that, unlike models of AAION, rAION does not affect outer retinal function.
We also performed array analysis of 1- and 3-day post-rAION induced rat retinae, using Affymetrix U34A chips (n = 3 animals/chip). Results were compared to gene expression in contralateral uninduced eyes (N = 3 chips/group). Only gene products with signal expression levels considered significant (>150) were compared, to minimize falsely large expression ratio differences. Comparisons with previously obtained rq-PCR internal controls (including opsin, cfos and HSP70) enabled us to evaluate relative efficacy of the array analysis. Two times as many genes decreased vs. increased at 1 day post-induction (162 v. 81 ESTs), and the trend continued at 3 days (176 decrease v. 122 increase). Thus, rAION induction initially results in overall retinal gene-down regulation. For the purposes of this paper, we focus only on genes that increased in expression.
Previous reports have suggested that cross-comparison between different damage models in a single tissue can reveal considerable gene expression response differences, with few common elements (Tang et al., 2002). Despite this caveat, we feel that such comparisons may also be informative. We compared common retinal gene expression changes with those reported in two rat glaucoma models: a chronic experimentally induced IOP (Morrison model) elevation model (Ahmed et al., 2004) and a hereditary glaucoma model based on spontaneous glaucoma in a specific Royal College of Surgeons rat strain (RCS-Rdy)(Naskar and Thanos, 2006). The timing of these changes is quite different among models. rAION-associated changes were measured at 1 and 3 days, while the elevated IOP model tissue was obtained after 35 days, and rdy at 12 months.
Significant changes occur in expression of inflammation-associated genes, such as complement factors 1 and 4 (Table 1). A number of other inflammatory- and remodeling-associated gene changes, such as tumor necrosis factor receptor-1 (TNFR1), cathepsin-L, protease-inhibitor CPi-26, and an estrogen-response gene (EET-1) known to be associated with modulating TNF activity (Dimayuga et al., 2005) also changed expression early post-induction, with return to baseline by day 3. This suggests that following sudden axon ischemia, there is rapid activation of intrinsic inflammatory/remodeling responses. Selected stress-associated genes such as ceruloplasmin are also elevated early post-axon stress. Despite the difficulty in comparing these findings with our array data, we identified some comparable changes with the IOP-elevation models. Ceruloplasmin expression increases dramatically in all three models. Inflammatory responses in complement factors C1 and C4 are also seen in all three models, but even here, there are subtle differences (compare C1 in rat IOP with C4 in mouse dystrophic IOP elevation). A CELF protein associated with differential splicing (Wang et al., 2005) is rapidly turned on after rAION and also is elevated following rat IOP elevation at 35 days, suggesting both elevated IOP and axonal ischemic models initiate changes not only in transcriptional regulation but also in the way these retinal genes are being utilized or regulated for various functions.
Table 1.
Microarray analysis of selected retina-expressed genes 1 and 3 days post-rAION induction. Each array analysis represents the average of three gene U34A genechips, with RNA from 3 retinae pooled per chip (total = 9 retinae/timepoint). The left eye was left as an untreated control from each animal. R1/L1: Ratio difference between rAION-induced and contralateral eyes at 1 day post-induction. R3/L3: Ratio difference between rAION-induced and contralateral eyes at 3 days post-induction. L1/L3: Ratio difference between contralateral eyes at 1 and 3 days post-induction (used to identify systemic anesthesia or dye-associated changes). Ratio differences >2.0 or <0.5 are considered significant. Rat IOP: 35-day post-induction microarray data obtained from the study of Ahmed et al. (2004) and provided by Dr. S. Tomarev. Rdy IOP: 12 month microarray data obtained from the study of Naskar and Thanos (2006).
| R1/L1 | R3/L3 | L1/L3 | Rat IOP (Ahmed et al., 2004) | Rdy IOP (Naskar and Thanos, 2006) | Descriptions |
|---|---|---|---|---|---|
| 1.975784 | 1.306827 | 0.89721 | 4 | NA | AF017437 Rattus norvegicus integrin-associated protein form 4 (IAP) mRNA |
| 1.254927 | 1.066875 | 0.902128 | 3.6 | NA | S85184 Cyclic Protein-2 = cathepsin-L proenzyme |
| 4.556023 | 3.469395 | 0.804363 | 22.4 | 3.53 | AF028784mRNA#1 Rattus norvegicus glial fibrillary acidic protein alpha (GFAP)gene |
| 8.987134 | 1.700414 | 0.676996 | 10.1 | NA | AF030089UTR#1 Rattus norvegicus activity and neurotransmitter-induced early gene 4 (ania-4) mRNA |
| 0.957207 | 1.035157 | 0.910537 | NA | NA | Z46957 R. norvegicus mRNA for rhodopsin |
| 3.97326 | 1.597515 | 1.098268 | 17.3 | NA | U59510mRNA RNEDN2S01 Rattus norvegicus endothelin-2 gene, |
| 4.660707 | 2.730576 | 0.753446 | 11.3 | D00753 Rat mRNA for contrapsin-like protease-inhibitor related protein (CPi-26) | |
| 4.181425 | 1.868184 | 0.596393 | 14.4 | NA | M65149 Rat CELF mRNA |
| 1.060579 | 10.71762 | 0.983592 | 15.4 | NA | X71127 R. norvegicus mRNA for complement protein C1q beta chain |
| 2.937233 | 2.498856 | 0.675057 | 4.9 | 5.61 | L33869 Rattus norvegicus ceruloplasmin mRNA |
| 2.894753 | 1.301528 | 0.836094 | 3.5 | NA | U53184 Rattus norvegicus estrogen-responsive uterine mRNA, partial sequence |
| 0.946344 | 1.003895 | 0.977847 | NA | NA | Z75029 R. norvegicus hsp70.2 mRNA for heat shock protein 70 |
| 1.344249 | 2.292628 | 0.886821 | NA | 3.9 | U42719 Rattus norvegicus C4 complement protein mRNA7 |
2.5. Vertical model analysis to identify conserved gene pathways
By utilizing similar NAION models in rodent and primate species (a vertical model analysis), one can identify conserved physiological and genetic response pathways to a given stimulus, such as NAION. This type of approach may improve identification of potentially effective treatment approaches for clinical trials. Conversely, homologous genes whose physiological levels are differentially expressed in a tissue may contribute to a species specific treatment response. For example, L-type calcium channel blockers such as nimodipine and other calcium channel blockers have been shown to be useful in reducing ischemic neuronal damage in rodents (Ouardouz et al., 2005; Li et al., 2007), but have failed in clinical trials (Horn and Limburg, 2001). We evaluated gene expression levels of L-type calcium channel proteins in the rodent, nonhuman primate and human optic nerve (Bernstein et al., 2009).
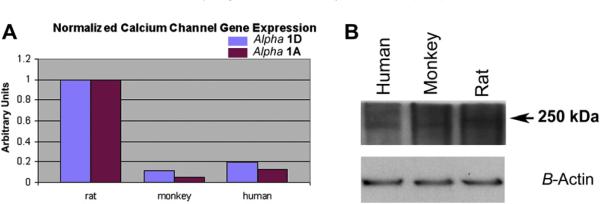
Real time quantitative polymerase chain reaction (rq-PCR) was performed on ON-mRNA isolated from rat, rhesus monkey and human donor tissue, using orthologously conserved primer sequence pairs. Results are shown in Fig. 13A. We also performed western analysis, utilizing rabbit antibody to the α1D subunit of the L-type calcium channel. These results are shown in Fig. 13B.
Fig. 13.
Quantitative comparison of L-type calcium channel subunit expression in rat, monkey and human ON. A. Real-time quantitative PCR (rq-PCR) results for mRNA quantification of alpha 1A and alpha 1D. L-type calcium channels in rat, monkey and human ON. There is approximately 10-fold less (in monkey ON) and 5-fold less (in human ON) α1A and α1D calcium channel mRNA sequence than in the rat. B. Western analysis of human, monkey and rat ON homogenate, using antibody against the α1D subunit of the L-type calcium channel. The rat ON has a higher concentration of the α1D subunit of the L-type calcium channel, than do either primate species. Inset lower band: Actin loading.
Rat ON expresses 5-fold more α1A and α1D subunit mRNA than does human ON (Fig. 13A, compare rat and human), and 10-fold more of these subunit messengers than does rhesus monkey ON (Fig. 13A; compare rat and monkey). This differential gene expression is not limited to mRNA, but is also seen at the protein level. Western analysis reveals that rat ON also expresses significantly more of the L-type calcium channel α1D subunit, than does human or monkey (Fig. 13B; compare band signal intensity of rat with monkey and human). Results from these assays suggest that rat ON is more likely to respond to modulation of L-type calcium channels with blocking agents, than either monkey or human ON. Since a similar NAION lesion is easily inducible in both rodents and primates using the current model approach, the NAION models are particularly useful for identifying conserved response pathways.
2.6. rAION-induced alterations in retinal protein activity
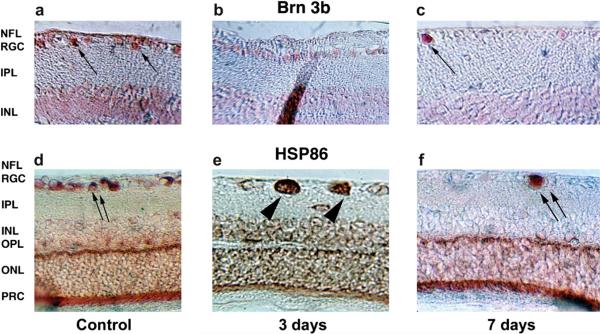
Immunocytochemical analysis of retinal proteins following rAION is also revealing. Brn-3b protein expression is limited to RGCs (Fig. 14A; arrows). Three days post-induction, there is a significant decrease in the number of Brn-3b (+) RGCs (Fig. 14B). One week post-induction, only a few Brn-3b expressing cells are found in the RGC layer of the affected region (Fig. 14C; arrow). Changes in the relative distribution of HSP86 (HSP90 alpha) are also revealing. HSP86 is a chaperone protein that is ubiquitously expressed in cells; it comprises 5% of total RGC protein, where it is concentrated in RGC axons (Bernstein et al., 2001). In the retina, strong HSP86 expression is seen in RGCs, with accumulation in the outer plexiform layer (OPL) (Fig. 14D). Three days post-rAION induction, HSP86 protein accumulates in the RGC soma (Fig. 14E; arrowheads), whereas HSP86 signal in the OPL has diminished, with diffuse staining throughout the retinal layers. One week post-induction, HSP86 re-accumulates in the OPL, with the few remaining RGCs strongly expressing HSP86 in their soma (Fig. 14F; arrows). We interpret these findings to mean that following rAION, there are at least two phenomena occurring. 1) A loss of RGC axon transport, with accumulation of HSP90 within the RGC soma, followed by ultimate down regulation of HSP86, during the approximate time of Brn 3b down-regulation. 2) Redistribution of existing intracellular HSP86 in non-RGC cells in the retina. Much of this redistribution may occur in Mueller cells, because of the extent of the redistribution (reduction in signal from the region of the inner segment of the photoreceptors, and loss of specific cellular localization in sparse cells of the inner nuclear layer, where Mueller cell nuclei are believed to reside). Re-formation of the original HSP90 pattern occurs after resolution of the initial stress. Thus, rAION appears to result in dramatic changes in RGC function, coupled to a reactive intraretinal response by glial (and other cellular) components, without affecting outer retina neuronal function, as measured by photoreceptor gene expression.
Fig. 14.
Intraretinal changes in protein expression. a–c: Brn-3b expression. d–f: HSP86 (HSP90α) expression. a. Baseline Brn-3b retinal expression. Brn-3b is concentrated in cells in the retinal ganglion cell (RGC) layer (arrows). Low background activity in the INL is due to cross-reactivity with other forms of Brn. b. Three days post-induction. Brn-3b protein in the RGC layer is reduced but still present. c. Seven days post-induction. There is loss of Brn-3b protein in many of the cells in the RGC layer, with continued strong expression in a few cells in this layer (arrow). d. HSP86 baseline expression. HSP86 is expressed at high levels in cells in the RGC layer (double arrows) and as a band in the outer plexiform layer (OPL). e. Three days post-induction. There is accumulation of HSP86 in individual swollen cells in the RGC layer (double arrowheads). There is a loss of HSP86 signal in the area of the OPL, with distribution of the signal throughout the retina. f. Seven days post-induction. HSP86 protein has disappeared in many of the cells in the RGC layer, with continued strong expression in a few cells in this layer (double arrows). There is reconstitution of the HSP86 signal in the OPL. NFL, nerve fiber layer; IPL, inner plexiform layer; INL, inner nuclear layer; ONL, outer nuclear layer; PRC, photoreceptors. Magnification: A–C: 400×, D–F: 200×.
3. Mouse rAION model induction
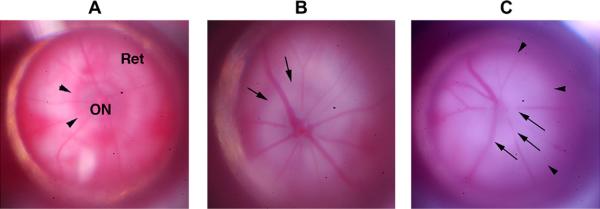
The mouse is perhaps the most utilized laboratory mammal for genetic studies, in part because of the ability to generate transgenic strains carrying desired traits or reporter gene elements (Feng et al., 2000; Smeyne et al., 1993). A mouse model of rAION was generated by Goldenberg-Cohen et al. (2005), utilizing a technique of RB-laser induction that is similar to that used in the rat. Initially, there was considerable difficulty in establishing this model because: 1) the mouse eye is considerably smaller than the rat, necessitating the design of a mouse-specific contact lens to optimally stabilize the cornea without raising intraocular pressure. 2) The smaller peripheral venous vasculature of the mouse makes intravenous RB injections more difficult. There are also significant differences in the internal vasculature of the ON between rats and mice, including a different vascular supporting structure in mice. Specifically, the presence of recurrent retinal vessels generated from the central retinal artery that supply the anterior optic nerve (compare Fig. 4b and c) (May and Lutjen-Drecoll, 2002). The smaller ON size and increased resistance to ON vascular damage results in a different apparent response to induction of ischemia, with a considerable variation in the appearance of the mouse ON after induction. Fig. 15 shows a control mouse fundus (A), compared with the appearance of two mouse rAION-induced eyes (Fig. 15, panels B and C).
Fig. 15.
Appearance of CD1 mouse retina and optic nerve pre- and post-rAION induction. A. Pre-induction (naïve retina). The optic nerve (ON) is slightly grayish/translucent, with a reddish halo of choroidal vessels (arrowheads). The choroid is visible beneath the transparent retina (Ret). B. Animal 1, 1d post-induction. The optic nerve is pale, with obscuration of the optic nerve/retina junction (arrows). There is loss of the reddish choroidal ring around the ON. C. Animal 2, 1d post-induction. There is ON pallor and obscuration of the vessels emerging from the ON (ON edema; arrows). The zone of whitening extends beyond the ON (arrowheads), with obscuration of the choroidal vasculature beneath the retina.
The smaller size of the optic nerve heat of the mouse necessitates a smaller laser spot size utilized for rAION induction than that used for the rat (300 microns for mouse vs 500 microns for rat). Laser power however, was left unchanged after exhaustive trials revealed that this did not change the tissue response. The time required for mouse rAION induction was found to be similar to that for rat (12–15 s for ~50–80% RGC loss). Following rAION induction, the mouse ON and retinal surround typically show more whitening, with less prominent ON edema, than is seen in rats.
rAION induction conditions are similar for CD1 albino mice vs those for C57Bl6/6J pigmented mouse retinae (data not shown). Twelve seconds of exposure time at a similar power intensity (50 mW) results in an average 50% RGC loss (Bernstein et al., 2007). However, there is greater individual variability in mouse induction responses than seen in rats (15–90% loss in mice, vs 25–75% in rats). This may be due to the increased difficulties as stated above, as well as differences in animal positioning, IV dye injection in pigmented animals, or other factors. Thus, when working with mice, more animals must be utilized to obtain consistent and reproducible results, compared with rats.
3.1. Transgenic analysis of rAION
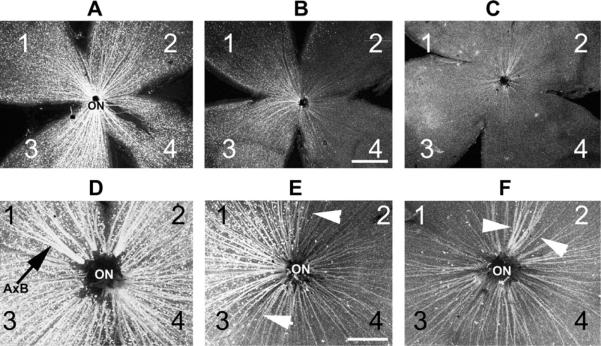
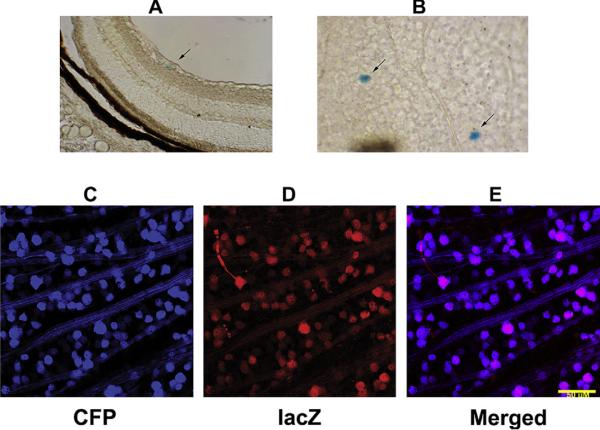
We performed rAION induction in transgenic mice carrying two transgene constructs: 1) a cfos (immediate early stress response gene) promoter driving a β-galactosidase (LacZ) reporter gene (Smeyne et al., 1993). 2) A Thy-1 promotor (RGC-selective expression in the retina) driving a cyan fluorescent protein (CFP) reporter gene (Feng et al., 2000). The former gene construct enables identification of cells undergoing stress. The latter construct enables easy RGC identification in flat-mounted retinae without the need for immunostaining, since the majority of RGCs glow blue-green under 450 nm light (Fig. 16). RGC loss can be easily analyzed both qualitatively (regional loss (Fig. 16; compare panel A with panels B and C)) and quantitatively (absolute cell loss (Fig. 16; compare panel D with panels E and F) perspectives. Utilizing Thy-1 (CFP)/cfos (LacZ) double transgenic mice revealed a number of interesting characteristics concerning rAION-induced acute axon ischemia. Early cfos expression following rAION induction was seen only in RGCs (Fig. 17), as defined by lacZ induction and localization in the RGC layer. LacZ expression was initially determined using a chemical reporter assay (which generates a blue reaction product) to detect LacZ activity. One day post-rAION, there was regional appearance of blue (lacZ-positive) cells localizing in the RGC layer by 1 day (Fig. 17A and B). It was found however, that the total number of blue cells following induction was many fewer than that predicted by the loss of CFP (+) RGCs and their axons (shown in Fig. 16B and C; compare to Fig. 16 panel A, control). No additional blue cells are detectable in other retinal layers, either at early or later times, suggesting that rAION does not result in stress in non-RGC retinal layers or other cell types.
Fig. 16.
rAION-induced RGC loss in a Thy1-CFP transgenic mouse line. Each retina is divided into quadrants (1–4). A. Control retina. CFP(+) RGCs form a `starry sky' pattern against the flattened retina, with CFP(+) axons projecting toward the optic nerve (ON). B. retina 30 days post-rAION induction (12 s). Regional CFP(+) RGC loss is apparent in quadrant 2. Overall, this animal had a 30% Thy-1 (CFP) RGC loss, determined by quantitative stereology. C. Retina 30 days post-rAION induction (12 s). There is fairly diffuse 85% RGC loss. Panels D–F: Magnified views of panels A–C showing in more detail the RGC axon patterns seen in panels A–C. D. Asymmetric axon bundles (A×B) are visible in the control retina as axons approach the ON. E. Axon pattern of retina shown in panel B. There is a regional preservation of axon bundles (indicated by the arrowheads), with decreased density elsewhere. F. Axon pattern of retina shown in panel C. There is a diffuse loss of axons, with a single large preserved axon bundle indicated by arrowheads. Scale bar: 500 microns.
Fig. 17.
Chemical vs immunohistochemical identification of β-gal (LacZ) expression in cfos (lacZ) transgenic mouse retina 1d post-rAION induction. A and B: Chemical analysis. Individual blue cells (LacZ (+)) are apparent in the RGC layer cross-section and are scattered throughout the RGC layer when seen in flat-mount (arrows). Lower panels: LacZ-immuno histochemical identification in a thy-1(CFP) X cfos(lacZ) double transgenic. 1d post-induction. Many of the RGC layer cells (CFP (+) RGCs) are also lacZ+ when stained for antibody to bacterial β-galactosidase. lacZ immunoreactivity is present regionally, suggesting regional RGC-axonal stress. Scale bar: 50 microns.
To evaluate further the reason for the lack of large numbers of blue (lacZ+) RGCs following rAION, RGC-lacZ expression was confirmed independently in double transgenic (CFP+/lacZ-cfos+) mice by using immunohistochemistry, with a LacZ primary antibody. The immunohistochemical method requires less cellular β-galactosidase expression for detection, and is thus a more sensitive detection technique. RGCs were detectable by CFP expression (Fig. 17, panel C). LacZ-based immunohistochemistry revealed that there was minimal lacZ expression in control retinae, but surprisingly, strong regional lacZ expression in the RGC layer of rAION-induced double transgenic mice (Fig. 17, panels D and E). Since there were many fewer lacZ-positive cells detectable by the chemical detection method than by lacZ immunohistochemistry, we concluded that many rAION-affected RGCs express lacZ, but only those RGCs expressing lacZ at a high level generated sufficient enzyme to allow visualization of the blue chemical product.
The low lacZ cellular level in most rAION-affected RGCs suggest that RGC-associated cfos expression (as measured by the transgenic cfos-lacZ reporter construct) occurs for only a short time following rAION, since the initial chemical detection method requires higher levels of cellular lacZ to generate a blue product. It is likely that the stress response resulting in RGC-cfos expression following rAION induction is rapidly turned on and then equally rapidly down-regulated, without directly affecting other cell layers. Long-term, there is a regional loss of CFP (+) cells in these mice, confirming that, like clinical NAION, rAION results in a regional loss of RGCs.
4. A primate model of NAION (pNAION)
While the retinal vasculature of the rat and mouse are similar in many ways to that of primates, ocular and neural structure differences remain between the two families. Firstly, their retinae vary in the extent of intraretinal stereotopic organization. For example, primates have a fovea/foveolar complex for improved central visual acuity, whereas rats and mice do not (Albrecht, 2008; Ogden, 1994; Jeon et al., 1998). Primates also have more exuberant choroidal/choriocapillaris vasculature than rats or mice (Zhang, 1994). As noted above, primates have a true lamina cribrosa (LC) consisting of both a glial lamina and a connective tissue lamina, comprised of connective tissue sheets that form the pores through which the RGC axons pass (Miller, 1982b) In rodents, the glial component of the lamina is similar to that of primates, but rather than tissue sheets, the connective tissue component in rats is comprised of fiber bundles that differ markedly among different species (Morrison et al., 1995; Johansson, 1987). In mice, no LC connective tissue component exists. Rodents also have different immune system response mechanisms than primates (Davis and Hamilton, 1998). Other differences between rodents and primates include a substantial difference in their optic nerve size. Rats have an optic nerve that has, at maximum, 100,000 axons and a 500 micron diameter compared with primate optic nerves containing 1.1–1.3 million axons and which have a diameter of 1.5–3mm, depending on whether the portion measured is myelinated or unmyelinated. Additionally, the primate optic nerve sheath is thicker than that of mice and rats. This may predispose primates to more damage from intraneural edema via a compartment syndrome than can occur in rodents (Tesser et al., 2003). The nonhuman primate (NHP) Maccaca mullata (rhesus monkey) optic nerve is similar to that of humans, containing similar numbers of axons with similar axon diameters, and with an intraocular segment similar in diameter to that of humans (Morrison et al.,1990; Fukuda et al.,1988; Hayreh and Vrabec,1966). Thus, in order to study human responses to optic nerve ischemia, a primate model is preferable and we chose the rhesus monkey to do so.
Chen and Johnson et al (Chen et al., 2008) generated a model of primate NAION (pNAION) using a technique similar to that used to produce rAION. Initial RB toxicology revealed no long-term systemic changes either hematologic (based on WBC counts, differential, and hemoglobin) or metabolic (based on SMA-18 values including glucose, liver function enzyme levels, or kidney function values) when 3–12y/o animals were dosed intravenously with single 2.5–5 mg/kg doses of RB. Following IV administration of 2.5 mg/kg RB (identical with that used in rats and mice), the intraocular portion of the rhesus optic nerve was irradiated with a 200 mW laser spot of 1.06 mM diameter positioned over the center of the disk, using a human pediatric (Glasser) laser fundus contact lens. The power was chosen because the 1.06 spot diameter is approximately 4 times larger in surface area than a 500 micron laser spot; thus, the fluence (energy distribution across the area of irradiation) decreases by four-fold if the power is not increased. Initial laser exposure time was 10 s (NHP P25). Induction was repeated with an additional animal for a reduced exposure time of 7 s (NHP Q11).
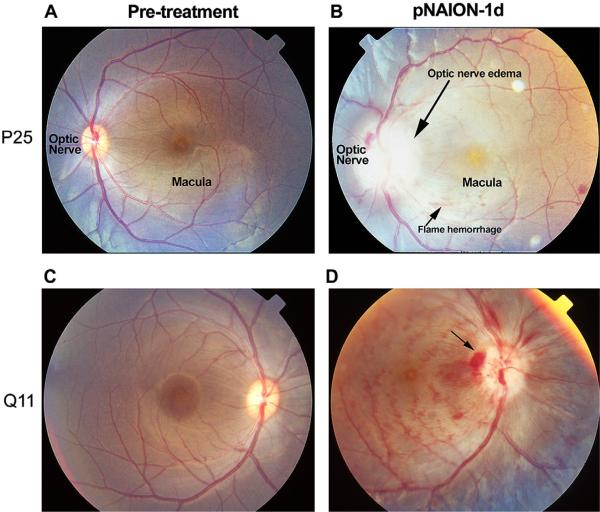
In this model, no apparent retinal changes are seen either pretreatment (Fig. 18, panels A and C), or 1 h after pNAION induction (data not shown). One day post-induction, however, the induced eyes showed a marked relative afferent pupillary defect (RAPD), indicative of ON dysfunction. In a pNAION animal induced for 10 s, a dilated fundus examination reveals severe optic nerve edema and ischemia that is characterized by extreme pallor (Fig. 18, panel B). Induction at a reduced exposure time does not produce as much nerve head edema or pallor, although both are still present (Fig. 18, panel D). In all animals, the induced eyes show increased venous tortuosity, with small intraretinal hemorrhages. These changes are virtually identical with those seen in patients with NAION and suggest that severe, acute optic disk edema associated with NAION/pNAION likely results in some degree of restriction of central retinal venous return, elevating intraretinal venous pressure, and potentially leading to vascular extravasation. Unlike chronic central retinal vein occlusion (CRVO) however, there are no changes in the ganzfeld ERG, implying that any changes in intrinsic retinal function not directly associated with the RGC layer are short-lived.
Fig. 18.
Appearance of nonhuman primate (NHP) retinae prior to, and 1 day post-pNAION induction. Left-hand numbers (P25 and Q11) refer to individual NHP identities. A and C: baseline photos (prior to induction). A. Pre-induction, (10 s). B. pNAION, 10 s induction. There is significant optic nerve edema (long arrow) and pallor. Mild venous tortuosity is present, along with intraretinal flame and blot hemorrhages. The macular pigment spot is prominent. C. Pre-induction (7 s). The optic nerve and macula are indicated. D. pNAION, 7 s induction. Disk hemorrhages and intraretinal blot and flame hemorrhages are present. The optic nerve is pale and edematous, with disk hemorrhages.
The peripapillary retinal nerve fiber layer in pNAION also reveals some degree of edema, with increased visibility of the macular pigment (compare the maculae of the pre-induced and pNAION retinae, Fig. 18, panels A and B). This finding, as well as the edema of the optic disk, suggests that like rAION, pNAION results in accumulation of intra-axonal material at the junction of the optic nerve and retina, due to the cessation of axon transport.
Intravenous fluorescein angiography (IVFA) performed in animals following pNAION induction reveals breakdown of the blood-retinal barrier (BRB), with fluorescein leakage at the disk (data not shown). Reconstitution of the BRB occurs by 14 days post-induction. These data suggest that, like the breakdown of the BBB seen following human CNS infarcts, a considerable time period ensues during which the affected optic nerve is exposed to the systemic immune system. High-speed indocyanine green (ICG) angiography reveals that in pNAION's early stages, there can be regional restriction of central venous return, with venous sludging at the optic nerve head, which resolves by 1 week post-induction. These findings support the concept that acute optic nerve edema results in intraretinal venous restriction, venous dilatation and intraretinal vascular extravasation, but that this restriction rapidly resolves without causing permanent retinal damage (see below).
4.1. Electrophysiological changes in pNAION
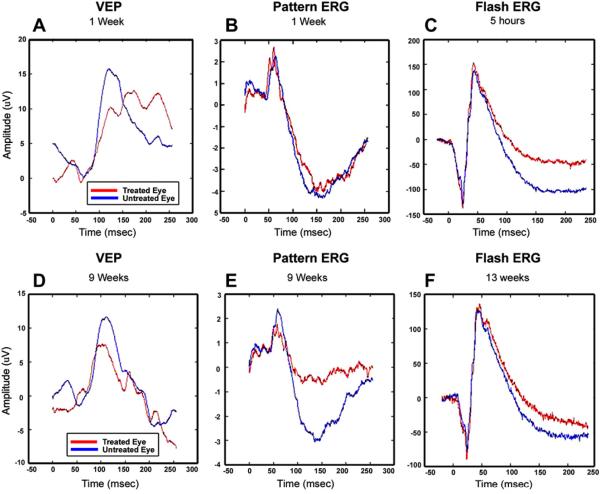
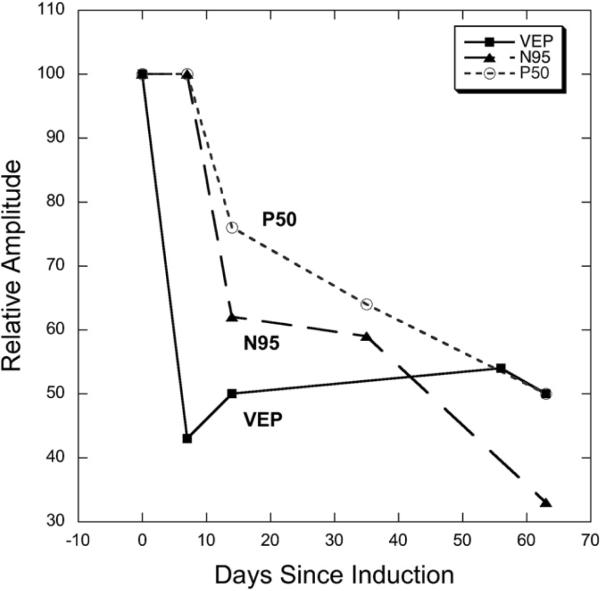
Chen and Johnson et al. recorded ganzfeld (full-field) ERGs, pattern ERGs (pERG) and VEPs on the control and experimental eyes of rhesus monkeys prior to induction of pNAION, 1 day post-induction, and weekly for 9 weeks post-induction (Chen et al., 2008). Because stimulus focus and location are critical parameters for recording pattern VEPs and pERGs, a fundus camera was modified to project the stimulus-an alternating checkerboard- onto the primate's retina (Chen et al., 2008). The stimulus was coplanar with the pupil, so that focusing on the fundus also focused the stimulus. Results from one animal are shown as two figures: Fig. 19 (VEP, pERG and flash ERG) and Fig. 20 (VEP and the two components of the pERG: N95 and p50). The VEP amplitude was reduced by 1 day post-induction (data not shown) and remained similarly reduced throughout the course of the study (Fig. 19, panels A and D). Conversely, the pERG was normal at 1 week post-induction but showed a large loss by 9 weeks post-induction (Fig. 21, center panels B and E). There was a large decline in the N95 component and a smaller loss in P50 by 2 weeks and continuing to 9 weeks post-induction, indicating the expected delayed impairment of ganglion cell function (Fig. 19), also compare (Fig. 20). Ganzfeld ERGs were typically normal in all eyes pre- and post-induction (Fig. 19, panels C and F), with the exception of reduced oscillatory potentials (OPs), which originate mainly in the amacrine cell layer. This finding indicates that pre-amacrine/ganglion cell function was not grossly affected by pNAION induction. The later reduction in OP amplitudes (not shown) is consistent with disruption of amacrine-ganglion cell connections.
Fig. 19.
VEPs (panels A and D) and pERGs (panels B and E) recorded from a rhesus monkey 1 week (top) and 9 weeks (bottom) following induction of pNAION. Results for the experimental eye (red lines) and control eye (blue lines) are plotted. The VEP is reduced by about 30% in the induced eye at 1 week and does not show further decline at 9 weeks. Conversely, the pERG is normal at 1 week post-induction, but shows a large loss in the N95 component (originating in spiking cells) and a smaller loss in P50 (from a combination of spiking and non-spiking cells) at 9 weeks post-induction, indicating the expected delayed impairment of ganglion cell function. The panels on the right are ganzfeld ERGs recorded 5 h (top panel C) and 13 weeks (Bottom panel F) after induction. The results indicate that there were no gross short-term or long-term pre-ganglion cell changes in the retina as a result of laser induction.
Fig. 20.
VEP and pERG results from NHP Q11. Relative amplitude (experimental eye/control eye) is plotted as a function of time. The VEP amplitude is affected first, and in this animal, shows a 50–60% loss compared to the fellow, control eye. VEP loss did not continue to worsen, nor did it appreciably recover. Between 1 and 2 weeks post-induction, the pERG amplitude began to decrease, with the N95 component showing a larger reduction than the P50 component. This finding may indicate a longer time window for partial treatment of NAION.
Fig. 21.
pNAION-associated histological changes in the retina. H&E staining. A. Control macular section. The RGC layer is packed with cells, with a double layer in some areas (arrows). The nerve fiber layer (NFL) is thick. B. Macular region 90 days post-pNAION. There is a loss of RGCs, with a few remaining nuclei (arrow). The NFL thickness is reduced. All other retinal layers are unchanged in both nuclear numbers and thickness. C. RGC quantification in peripheral region and macula. There is a statistically significant loss of RGCs in the superior retinal quadrant of the pNAION animal, compared with the control retina (one tailed t test, p < 0.02). RGC loss is greatest in the macula, where there is an average 65% RGC loss (p < 0.002) (mean ± s.d. of 6 sections/region). Scale bar: 50 microns.
4.2. pNAION: histological changes
Similar to the rat retina, the RGC layer of primates consists of a cell monolayer, except in the macular region, which is multilayered. Histologic assessment of normal rhesus retinae using hematoxyln and eosin (H&E) stained sections near the macula reveals an intact RGC layer, with RGCs present in up to two layers (Fig. 21, panel A, arrows). A thick, distinct nerve fiber layer (NFL) consisting of the RGC axons, is present internal to the RGC layer. In contrast, sections from a similar retinal region 70 days post-pNAION induction showed isolated loss of cells in the RGC layer (Fig. 21, panel B). Quantitative RGC analysis in two retinal regions (macula and superior retinal periphery) revealed considerable cell loss in both regions of the induced eye, compared with the control eye. No quantitative cell loss was seen in other nucleated retina layers (i.e., the INL and ONL). Thus, like rAION, pNAION represents a model of acute, isolated RGC axon ischemia that results in subsequent RGC loss, without loss of other retinal cellular elements.
4.3. pNAION: laminar and optic nerve changes
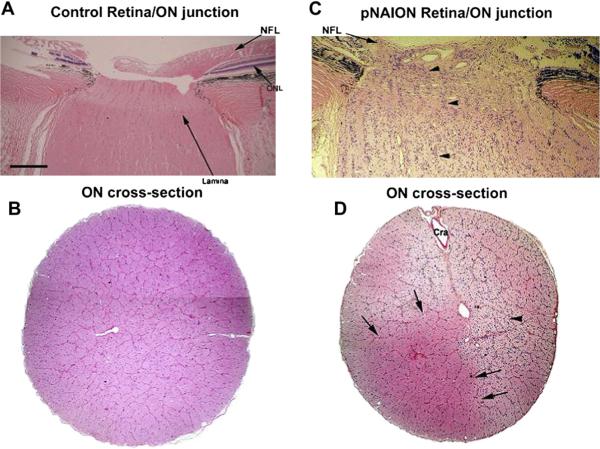
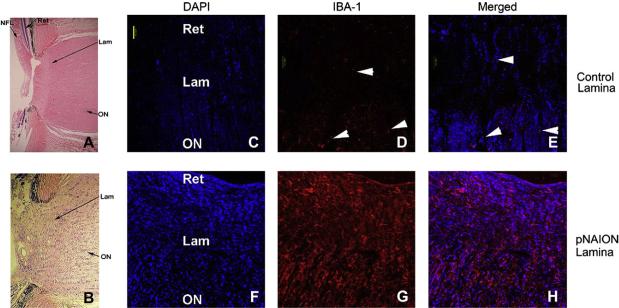
The pNAION lesion is generated in the laminar region of the optic nerve. Within the normal primate lamina, axons are arranged in columns surrounded by fibrovascular septae (Fig. 22, panel A). A cross-section of the primate ON reveals an organization similar to that seen in the rat, but with greatly increased numbers of septated bundles (Fig. 22, panel B). In the laminar region of pNAION-induced eyes, there is a loss of RGC axons and disruption of the normal columnar structure of the retina:ON junction, which is similar to that seen in rAION. The NFL is greatly reduced in thickness in this region. At submaximal induction conditions (i.e., less than 10 s), there may be regions in which there is preservation of normal laminar features with relatively intact axon columns and normal appearing oligodendrocytes (Fig. 22, panel C, to the left of the arrowheads). However, even in these areas, an increased cellular infiltrate is a prominent feature in pNAION-induced laminae and ONs in animals whose eyes were obtained 60 days or more post-induction. In ON regions distal to the lamina, there is also increased cellularity (Fig. 22, panel D, arrowhead). Again like rAION, there is typically regional axonal loss, with preservation of some normal areas of ON architecture (Fig. 22, panel D, normal-appearing area delineated by arrows).
Fig. 22.
pNAION-associated histological changes in the Rhesus macaque lamina and optic nerve. A. Normal (control) retina:ON junction. H and E staining. The laminar region appears slightly pale (long arrow), the nerve fiber layer (NFL) is thick. There is a regular columnar organization of the RGC-axonal bundles from the lamina, through the distal ON regions. B. ON cross-section. The axonal bundles are regular, and there is a suggestion of the septae surrounding the axons. C. pNAION-induced retina:ON junction, 75 days post-induction. The NFL is thinned (panel C; indicated by arrow). There is disruption of the normal columnar structures, with increased cellularity. Columnar organization is regionally maintained (area indicated by arrowheads). D. 75 days pNAION-induced, ON cross-section. There is a collapse of the normal septal bundles in many areas, and increased cellularity (arrowhead). The central artery is indicated (Cra). There is a normal appearing region, with reduced cellularity and preservation of the normal septated bundles (indicated by arrows). Scale bar: A–D, 500 microns.
Overall, the histological findings in pNAION eyes are similar to the histological findings reported in human eyes with NAION or other ischemic ON lesions that developed at times far removed from time of autopsy (Knox et al., 2000).
4.4. pNAION-associated ultrastructural optic nerve changes
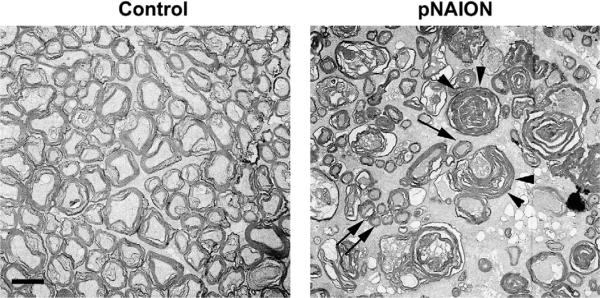
Following pNAION, both RGC and axonal loss can be easily demonstrated by light microscopy, using either traditional paraffin sections or by epon-embedded sections. Electron microscopy reveals ultrastructural changes within the affected regions that can shed additional light on processes occurring post-infarct and can be used to more effectively quantify RGC-axonal numbers, as the multi-cellular primate RGC layer makes it difficult to use the relatively straightforward flat mount in situ stereological technique currently used to count rodent RGCs.
Although a full quantitative stereological study of the primate ON is beyond the scope of this chapter, qualitative ultrastructural analysis reveals some interesting features. In primates with pNAION-induced ON lesions >60%, there appears to be preferential loss of large diameter axons (Fig. 23; compare control with pNAION-induced). This suggests that following pNAION, as in clinical NAION, there is relative preservation of ocular functions associated with small RGC axons, such as fine acuity and some degree of color function. Functions associated with large axon diameter RGCs, such as peripheral and night vision, may be disproportionately affected.
Fig. 23.
Comparison of ON axonal ultrastructure in primate control and pNAION-affected eyes. Control: Axons are myelinated and packed in septated bundles. The axons are of different diameters, ranging from ~0.5–2 microns in the current figure. pNAION: There is axonal loss, with post-infarct demyelination and axonal degeneration (arrowheads). Intact, smaller diameter axons are present in small groups (double arrows) and also seen singly in between groups of degenerating large diameter axons (arrow). Scale bar: 1 micron.
5. Inflammatory changes associated with pNAION and rAION
Because inflammation can both initiate and exacerbate CNS infarct-related conditions (Nakase et al., 2008; Pineau et al., 2010), questions regarding NAION-associated inflammation are important from the point of view of both initiation and treatment. Post-infarct inflammation is a well-defined phenomenon in other regions of the CNS. Current opinion holds that there is no inflammation associated with NAION. This view must be taken with reservation, because of the lack of histological data describing acute human NAION. In fact, one histological study of human autopsy specimens in which the inciting incident was generally far distant from the time of collection reveals that there is indeed some inflammatory infiltrate (Knox et al., 2000). The problem is that none of the patients from whom these specimens were obtained underwent an ophthalmologic assessment prior to death. Thus, we do not know if they truly had NAION, or if they had some other form of optic nerve ischemia (e.g., Nonarteritic posterior ION). There is a single histological report of optic nerve findings 28 days post-NAION onset (Tesser et al., 2003), in which it was suggested that there was no obvious inflammation was identified; however this study did not utilize specialized antibodies to identify immune cells. In fact, the authors of the single human clinical study were kind enough to provide us with unstained sections from the affected optic nerve which, when stained for inflammatory cells, did, in fact, show evidence of acute inflammation in the region of the infarct as well as in the surrounding regions (data not shown). We have used our rAION and pNAION models to evaluate this issue.
Following microarray analyses, we found that following induction of acute optic nerve axon ischemia (i.e., rAION), acute inflammation occurs within 1 day post-infarct (Zhang et al., 2009). Resident microglia are macrophages which take up long-term residence in the CNS. We utilizing antibody against IBA-1, an ionized calcium channel protein, which is found on the surface of inflammatory cells (Ito et al., 2001). IBA-1(+) cells are seen in control retina, choroid and ON (Fig. 24, panel A), and are presumed to be microglia (CNS resident macrophages). Detectable changes in IBA-1 (activated) microglia appear around the large vessels and in the choroid closest to the infarct by one day post-induction. These cells begin migrating towards the region of ischemia (Fig. 24, panel B arrowheads). Significant numbers of inflammatory cells accumulate within the primary infarct area 3 days post-induction (Fig. 24, panel C). Extrinsic macrophages (blood-borne macrophages which invade the damaged tissue) are identifiable early in their generation by the presence of ED1 (CD68) protein. Blood borne-ED1+ cells are also IBA-1 +, which are also present within the infarct region by 3 days post-induction (Fig. 24, panels D–F), indicating significant BBB disruption. These ED1+ cells cluster at the region of the primary lesion, and are not found in any significant numbers in the distal optic nerve (Fig. 24, panel D). ED1+ cells slowly disappear and are largely absent in the infarct by 14 days post-induction, whereas IBA-1+ cells remain clustered in the remodeling infarct (data not shown). As ED1+ immunoreactivity only occurs in newly matured macrophages, these data suggest that soon after rAION, there is BRB/BBB disruption that lasts for up to 1 week, with infiltration of systemic macrophages. After BRB/BBB reconstitution, a few additional extrinsic macrophages infiltrate the lesion. Because systemic macrophages, rather than intrinsic microglia, are most active in eliminating degenerating myelin from fragmenting axons, degenerate myelin elimination is prolonged, with suppression of axon regeneration through the Lingo-Nogo-RhoA signaling pathways (Mi et al., 2004). Thus, to enhance axon regeneration, we hypothesize that one post-infarct treatment approach might be to increase extrinsic macrophage recruitment to the remodeling optic nerve, while encouraging RGC survival during this period.
Fig. 24.
Early appearance of inflammatory cells in rat ON following rAION induction. Panels A–C: IBA-1 (ionized calcium channel protein) immunostaining. A. Control retina/optic nerve. IBA-1+ microglia are scattered randomly throughout the ON, with occasional cells in the retina. B. 1 day post-induction. IBA-1+ cells are apparent in the retinal vessels, as well as the choroid, surrounding the area of the primary infarct. C. 3 days post-induction. There is infiltration of IBA-1+ cells in the ON region of the infarct. D–F: Early invasion and localization of extrinsic macrophages following rAION. D. ED1 immunoreactivity. ED1+ cells are detectable in the center of the rAION lesion at three days post-induction. E. IBA-1 immunoreactivity. F. ED1/IBA-1 colocalization. The center of the rAION lesion is infiltrated by extrinsic (blood-borne) macrophages early post-induction. Scale bars: A,D: 50 microns.
Similar to the inflammatory component seen following rAION, the post-pNAION-induced primate anterior (prelaminar) and laminar regions of the optic nerve reveal an inflammatory component visible by H&E staining as increased cellularity in this region (Fig. 25, panel B; compare with control lamina, panel A). There is also a loss of columnar structure within the pNAION-induced tissue, compared with the control nerve/lamina. Immune cells within the laminar region are identifiable using IBA-1 antibody. Resident IBA-1+ cells (presumably microglia) are identifiable scattered throughout the laminar region in the contralateral control section (Fig. 25, panels C–E), whereas there is a large increase in the number of IBA-1+ cells throughout the pNAION-induced nerve 75 days post-induction (Fig. 25, panels F–H). Post-infarct inflammatory upregulation is therefore demonstrable in both rodent and primate NAION models. Thus, despite the supposed lack of inflammation in human NAION, inflammation plays an important part of the response to optic nerve ischemia in our rAION and pNAION models and probably has been underappreciated in human NAION.
Fig. 25.
Post-pNAION changes in inflammatory cell infiltration in the laminar region. A and B: H&E-stained cross-sections of nonhuman primate laminar regions. A. Control lamina. The retina is visible to the left, with the optic nerve on the right. There is a columnar organization in the normal lamina, with cellularity distributed between the eosinophilic columns. B. Lamina of a pNAION-induced eye (75 days post-induction). There is disruption of the normal columnar organization, and increased cellularity. C–E: confocal analysis of inflammatory cells in the normal lamina. C. DAPI staining. Normal columnar structure of nuclei. D: Inflammatory (IBA-1) cells. There are a few scattered IBA-1+cells across the lamina. E. Merged image. F–H: confocal analysis of inflammatory cells in the laminar region of a pNAION-induced (75d) eye. There are is disruption of the normal columnar structure, with infiltrration of many IBA-1+ cells across the lamina. Ret: retia. Lam: lamia. ON: optic nerve. Scale bar panel C: 50 microns.
6. Conclusions and future directions
The relative ease of the application of NAION models, combined with the ability to evaluate responses to acute isolated optic nerve ischemia without direct retinal compromise, improves our understanding of the mechanisms responsible for human NAION-associated dysfunction. Although differences remain between any animal model of human disease and the clinical disorder they mimic, we believe that the AION models described in this chapter can provide valuable insights into the physiological mechanisms associated with response to isolated sudden optic nerve ischemia.
The development and extension of highly similar NAION models into all species currently utilized for basic neurobiological research (i.e., mouse, rat and old-world primate) means that data obtained in one species can be evaluated rapidly in other species, with the intent of translating these results into practical treatments for human clinical disease. The responses to optic nerve ischemia in our models resemble in many ways the responses to axon (white-matter) ischemia in the rest of the CNS. This is not surprising, because the ON is, in fact, a CNS white-matter tract, rather than a peripheral nerve. Thus, our models may enable us to evaluate the responses to CNS white-matter ischemia in general and may provide a basis for evaluating various neuroprotective and neuroreparative strategies for CNS white-matter. While the event or events that initiate human NAION are still poorly understood (and, indeed, probably are multifactorial), vascular dysfunction plays an important role. The resultant tissue edema seen in the human condition as well as in our AION models probably results in a compartmentation syndrome that increases the damage caused by the original lesion, leading to significant visual compromise. Very early NAION treatments thus may appropriately focus on reduction of optic nerve edema to reduce the axon dysfunction caused by the compartmentation syndrome before irreversible neuronal damage occurs.
Following acute optic nerve ischemia in our animal models and, probably, in human NAION, there is both axon degeneration and post-stroke demyelination. The early demyelinating component was little appreciated prior to development of the NAION models. Inflammation too, was initially believed to be of little importance in NAION. However, our NAION models reveal that inflammatory changes are an important component of the post-ON ischemic event, demonstrable by retinal gene assessment, as well as by immunohistochemical analysis of the retina and optic nerve. Thus, selective inflammatory modulation also may be relevant in the treatment of human NAION treatment, both in the early stages of the disease and in the post-infarct period.
Acknowledgements
We thank Dr. Stanislav Tomarev (NEI) for his kind sharing of 35d IOP elevation microarray data, and Dr. John Morrison (Casey Eye Center, Oregon) for the use of his vascular figure of the rat optic nerve, and Dr. Len Levin, for his kind contribution of clinical material from an individual who died 28 days post-NAION. We also gratefully acknowledge the work of many of our postdoctoral fellows and students, in particular Dr Nitza Goldenberg-Cohen, Celia Chen, Charles Zhang and James Nicholson. The technical assistance of Yan Guo and Theresa Alexander are also greatly appreciated. This work was supported by a grant from the Rasmussen Foundation, Donner Foundation, and NIH grants RO1-EY015304 and RO1EY19529 from the National Eye Institute. Their support is gratefully acknowledged.
References
- Ahmed F, Brown KM, Stephan DA, Morrison JC, Johnson EC, Tomarev SI. Microarray analysis of changes in mRNA levels in the rat retina after experimental elevation of intraocular pressure. Invest. Ophthalmol. Vis. Sci. 2004;45:1247–1258. doi: 10.1167/iovs.03-1123. [DOI] [PubMed] [Google Scholar]
- Albrecht MC. Comparative anatomy of the optic nerve head and inner retina in non-primate animal models used for glaucoma research. Open Ophthalmol. J. 2008;2:94–101. doi: 10.2174/1874364100802010094. [DOI] [PMC free article] [PubMed] [Google Scholar]
- Arnold AC, Hepler RS. Natural history of nonarteritic anterior ischemic optic neuropathy. J. Neuroophthalmol. 1994;14:66–69. [PubMed] [Google Scholar]
- Arnold AC, Badr MA, Hepler RS. Fluorescein angiography in nonischemic optic disc edema. Arch. Ophthalmol. 1996;114:293–298. doi: 10.1001/archopht.1996.01100130289011. [DOI] [PubMed] [Google Scholar]
- Arnold AC. Pathogenesis of nonarteritic anterior ischemic optic neuropathy. J. Neuroophthalmol. 2003;23:157–163. doi: 10.1097/00041327-200306000-00012. [DOI] [PubMed] [Google Scholar]
- Bernstein SL, Russell P, Wong P, Fishelevich R, Smith LEH. Heat shock protein 90 in retinal ganglion cells: association with axonally transported proteins. Vis. Neurosci. 2001;18:429–436. doi: 10.1017/s0952523801183094. [DOI] [PubMed] [Google Scholar]
- Bernstein SL, Guo Y, Kelman SE, Flower RW, Johnson MA. Functional and cellular responses in a novel rodent model of anterior ischemic optic neuropathy. Invest. Ophthalmol. Vis. Sci. 2003;44:4153–4162. doi: 10.1167/iovs.03-0274. [DOI] [PubMed] [Google Scholar]
- Bernstein SL, Guo Y, Slater BJ, Puche A, Kelman SE. Neuron stress and loss following rodent anterior ischemic optic neuropathy in double reporter transgenic mice. Invest. Ophthalmol. Vis. Sci. 2007;48:2304–2310. doi: 10.1167/iovs.06-0486. [DOI] [PubMed] [Google Scholar]
- Bernstein SL, Guo Y, Peterson K, Wistow G. Expressed sequence tag analysis of adult human optic nerve for NEIBank: identification of cell type and tissue markers. BMC Neurosci. 2009;10:121. doi: 10.1186/1471-2202-10-121. [DOI] [PMC free article] [PubMed] [Google Scholar]
- Bosley TM, Abu-Amero KK, Ozand PT. Mitochondrial DNA nucleotide changes in non-arteritic ischemic optic neuropathy. Neurology. 2004;63:1305–1308. doi: 10.1212/01.wnl.0000140696.34117.95. [DOI] [PubMed] [Google Scholar]
- Cavaglia M, Dombrowski SM, Drazba J, Vasanji A, Bokesch PM, Janigro D. Regional variation in brain capillary density and vascular response to ischemia. Brain Res. 2001;910:81–93. doi: 10.1016/s0006-8993(01)02637-3. [DOI] [PubMed] [Google Scholar]
- Chen CS, Johnson MA, Flower RA, Slater BJ, Miller NR, Bernstein SL. A primate model of nonarteritic anterior ischemic optic neuropathy (pNAION) Invest. Ophthalmol. Vis. Sci. 2008;49:2985–2992. doi: 10.1167/iovs.07-1651. [DOI] [PMC free article] [PubMed] [Google Scholar]
- Collignon-Robe NJ, Feke GT, Rizzo JF. Optic nerve head circulation in nonarteritic anterior ischemic optic neuropathy and optic neuritis. Ophthalmology. 2004;111:1663–1672. doi: 10.1016/j.ophtha.2004.05.020. [DOI] [PubMed] [Google Scholar]
- Davis WC, Hamilton MJ. Comparison of the unique characteristics of the immune system in different species of mammals. Vet. Immunol. Immunopathol. 1998;63:7–13. doi: 10.1016/s0165-2427(98)00076-2. [DOI] [PubMed] [Google Scholar]
- Dimayuga FO, Reed JL, Carnero GA, Wang C, Dimayuga ER, Dimayuga VM, Perger A, Wilson ME, Keller JN, Bruce-Keller AJ. Estrogen and brain inflammation: effects on microglial expression of MHC, costimulatory molecules and cytokines. J. Neuroimmunol. 2005;161:123–136. doi: 10.1016/j.jneuroim.2004.12.016. [DOI] [PubMed] [Google Scholar]
- Duan Y, Thurston J, Watson B, Hernandez E, Fern R, Goldberg JL. Retinal ganglion cell survival and optic nerve glial response after rat optic nerve ischemic injury. Invest. Ophthalmol. Vis. Sci. 2010;48 E-Abstract 644. [Google Scholar]
- Feng G, Mellor RH, Bernstein M, Keller-Peck C, Nguyen QT, Wallace M, Nerbonne JM, Lichtman JW, Sanes JR. Imaging neuronal subsets in transgenic mice expressing multiple spectral variants of GFP. Neuron. 2000;28:41–51. doi: 10.1016/s0896-6273(00)00084-2. [DOI] [PubMed] [Google Scholar]
- Fluhler EN, Hurley JK, Kochevar IE. Laser intensity and wavelength dependence of rose bengal- photosensitized inhibition of red blood cell acetylcholinesterase. Biochem. Biophys. Acta. 1989;990:269–275. doi: 10.1016/s0304-4165(89)80044-3. [DOI] [PubMed] [Google Scholar]
- Froehlich J, Kaufman DI. Use of pattern electroretinography to differentiate acute optic neuritis from acute anterior ischemic optic neuropathy. Electroencephalogr. Clin. Neurophysiol. 1994;92:480–486. doi: 10.1016/0168-5597(94)90131-7. [DOI] [PubMed] [Google Scholar]
- Frontczak-Baniewicz M, Gajkowska B. Focal ischemia in the cerebral cortex has an effect on the neurohypophysis. II. Angiogenesis in the neurohypophysis is a consequence of the focal ischemia in the cerebral cortex. Neuro. Endocrinol. Lett. 2001;22:87–92. [PubMed] [Google Scholar]
- Fukuda Y, Watanabe M, Wakakuwa K, Sawai H, Morigiwa K. Intraretinal axons of ganglion cells in the Japanese monkey (Macaca fuscata): conduction velocity and diameter distribution. Neurosci. Res. 1988;6:53–71. doi: 10.1016/0168-0102(88)90006-5. [DOI] [PubMed] [Google Scholar]
- Goldenberg-Cohen N, Guo Y, Margolis FL, Miller NR, Cohen Y, Bernstein SL. Oligodendrocyte dysfunction following induction of experimental anterior optic nerve ischemia. Invest. Ophthalmol. Vis. Sci. 2005;46:2716–2725. doi: 10.1167/iovs.04-0547. [DOI] [PubMed] [Google Scholar]
- Hayreh SS, Vrabec F. The structure of the head of the optic nerve in rhesus monkey. Am. J. Ophthalmol. 1966;61:136–150. doi: 10.1016/0002-9394(66)90758-6. [DOI] [PubMed] [Google Scholar]
- Hayreh SS. Anterior ischemic optic neuropathy. I. Terminology and pathogenesis. Br. J. Ophthalmol. 1974;58:955–963. doi: 10.1136/bjo.58.12.955. [DOI] [PMC free article] [PubMed] [Google Scholar]
- Horn J, Limburg M. Calcium antagonists for ischemic stroke: a systematic review. Stroke. 2001;32:570–576. doi: 10.1161/01.str.32.2.570. [DOI] [PubMed] [Google Scholar]
- Inamo J, Belougne E, Doutremepuich C. Importance of photo activation of rose bengal for platelet activation in experimental models of photochemically induced thrombosis. Thromb. Res. 1996;83:229–235. doi: 10.1016/0049-3848(96)00131-4. [DOI] [PubMed] [Google Scholar]
- IONDT study group Characteristics of patients with nonarteritic anterior ischemic optic neuropathy eligible for the ischemic optic neuropathy decompression trial. Arch. Ophthalmol. 1996;114:1366–1374. doi: 10.1001/archopht.1996.01100140566007. [DOI] [PubMed] [Google Scholar]
- Ito D, Tanaka K, Suzuki S, Dembo T, Fukuuchi Y. Enhanced expression of Iba1, ionized calcium-binding adapter molecule 1, after transient focal cerebral ischemia in rat brain. Stroke. 2001;32:1208–1215. doi: 10.1161/01.str.32.5.1208. [DOI] [PubMed] [Google Scholar]
- Janaky M, Fulop Z, Palffy A, Benedek K, Benedek G. Electrophysiological findings in patients with nonarteritic anterior ischemic optic neuropathy. Clin. Neurophysiol. 2006;117:1158–1166. doi: 10.1016/j.clinph.2006.01.013. [DOI] [PubMed] [Google Scholar]
- Jeon CJ, Strettoi E, Masland RH. The major cell populations of the mouse retina. J. Neurosci. 1998;18:8936–8946. doi: 10.1523/JNEUROSCI.18-21-08936.1998. [DOI] [PMC free article] [PubMed] [Google Scholar]
- Johansson JO. The lamina cribrosa in the eyes of rats, hamsters, gerbils and guinea pigs. Acta Anat. (Basel) 1987;128:55–62. doi: 10.1159/000146315. [DOI] [PubMed] [Google Scholar]
- Kerr NM, Chew SS, Danesh-Meyer HV. Non-arteritic anterior ischaemic optic neuropathy: a review and update. J. Clin. Neurosci. 2009;16:994–1000. doi: 10.1016/j.jocn.2009.04.002. [DOI] [PubMed] [Google Scholar]
- Knox DL, Kerrison JB, Green WR. Histopathologic studies of ischemic optic neuropathy. Trans. Am. Ophthalmol. Soc. 2000;98:203–222. [PMC free article] [PubMed] [Google Scholar]
- Lambert CR, Stiel H, Leupold D, Lynch MC, Kochevar IE. Intensity-dependent enzyme photosensitization using 532 nm nanosecond laser pulses. Photochem. Photobiol. 1996;63:154–160. doi: 10.1111/j.1751-1097.1996.tb03007.x. [DOI] [PubMed] [Google Scholar]
- Leiba H, Rachmiel R, Harris A, Kagemann L, Pollack A, Zalish M. Optic nerve head blood flow measurements in non-arteritic anterior ischaemic optic neuropathy. Eye. 2000;14:828–833. doi: 10.1038/eye.2000.231. [DOI] [PubMed] [Google Scholar]
- Levin LA, Danesh-Meyer HV. Hypothesis: a venous etiology for nonarteritic anterior ischemic optic neuropathy. Arch. Ophthalmol. 2008;126:1582–1585. doi: 10.1001/archopht.126.11.1582. [DOI] [PubMed] [Google Scholar]
- Li XM, Yang JM, Hu DH, Hou FQ, Zhao M, Zhu XH, Wang Y, Li JG, Hu P, Chen L, Qin LN, Gao TM. Contribution of downregulation of L-type calcium currents to delayed neuronal death in rat hippocampus after global cerebral ischemia and reperfusion. J. Neurosci. 2007;27:5249–5259. doi: 10.1523/JNEUROSCI.0802-07.2007. [DOI] [PMC free article] [PubMed] [Google Scholar]
- Lieberman MF, Maumenee AE, Green WR. Histologic studies of the vasculature of the anterior optic nerve. Am. J. Ophthalmol. 1976;82:405–423. doi: 10.1016/0002-9394(76)90489-x. [DOI] [PubMed] [Google Scholar]
- May CA, Lutjen-Drecoll E. Morphology of the murine optic nerve. Invest. Ophthalmol. Vis. Sci. 2002;43:2206–2212. [PubMed] [Google Scholar]
- Mi S, Lee X, Shao Z, Thill G, Ji B, Relton J, Levesque M, Allaire N, Perrin S, Sands B, Crowell T, Cate RL, McCoy JM, Pepinsky RB. LINGO-1 is a component of the Nogo-66 receptor/p75 signaling complex. Nat. Neurosci. 2004;7:221–228. doi: 10.1038/nn1188. [DOI] [PubMed] [Google Scholar]
- Miller N. Anterior ischemic optic neuropathy. In: Miller NR, editor. Walsh and Hoyts Neuro-ophthalmology. Williams and Wilkins; Baltimore: 1982a. pp. 212–226. [Google Scholar]
- Miller NR. Anatomy and physiology of optic nerve. In: Miller NR, editor. Walsh and Hoyts Clinical Neuro-Ophthalmology. Williams and Wilkins; Baltimore: 1982b. pp. 41–59. [Google Scholar]
- Morrison JC, Cork LC, Dunkelberger GR, Brown A, Quigley HA. Aging changes in the rhesus monkey optic nerve. Invest. Ophthalmol. Vis. Sci. 1990;31:1623–1627. [PubMed] [Google Scholar]
- Morrison J, Farrell S, Johnson E, Deppmeier L, Moore CG, Grossmann E. Structure and composition of the rodent lamina cribrosa. Exp. Eye Res. 1995;60:127–135. doi: 10.1016/s0014-4835(95)80002-6. [DOI] [PubMed] [Google Scholar]
- Morrison JC, Johnson EC, Cepurna WO, Funk RH. Microvasculature of the rat optic nerve head. Invest. Ophthalmol. Vis. Sci. 1999;40:1702–1709. [PubMed] [Google Scholar]
- Mosinger JL, Olney JW. Photothrombosis-induced ischemic neuronal degeneration in the rat retina. Exp. Neurol. 1989;105:110–113. doi: 10.1016/0014-4886(89)90178-7. [DOI] [PubMed] [Google Scholar]
- Nadal-Nicolas FM, Jimenez-Lopez M, Sobrado-Calvo P, Nieto-Lopez L, Canovas-Martinez I, Salinas-Navarro M, Vidal-Sanz M, Agudo M. Brn3a as a marker of retinal ganglion cells: qualitative and quantitative time course studies in naive and optic nerve-injured retinas. Invest. Ophthalmol. Vis. Sci. 2009;50:3860–3868. doi: 10.1167/iovs.08-3267. [DOI] [PubMed] [Google Scholar]
- Nakase T, Yamazaki T, Ogura N, Suzuki A, Nagata K. The impact of inflammation on the pathogenesis and prognosis of ischemic stroke. J. Neurol. Sci. 2008;271:104–109. doi: 10.1016/j.jns.2008.03.020. [DOI] [PubMed] [Google Scholar]
- Naskar R, Thanos S. Retinal gene profiling in a hereditary rodent model of elevated intraocular pressure. Mol. Vis. 2006;12:1199–1210. [PubMed] [Google Scholar]
- Ogden TE. Topography of the retina. In: Ryan SJ, editor. The Retina. C.V. Mosby; St. Louis, MO: 1994. pp. 32–36. [Google Scholar]
- Olver JM, McCartney AC. Orbital and ocular micro-vascular corrosion casting in man. Eye. 1989;3:588–596. doi: 10.1038/eye.1989.92. [DOI] [PubMed] [Google Scholar]
- Ouardouz M, Zamponi GW, Barr W, Kiedrowski L, Stys PK. Protection of ischemic rat spinal cord white matter: dual action of KB-R7943 on Na+/Ca2+ exchange and L-type Ca2+ channels. Neuropharmacology. 2005;48:566–575. doi: 10.1016/j.neuropharm.2004.12.007. [DOI] [PubMed] [Google Scholar]
- Palombi K, Renard E, Levy P, Chiquet C, Deschaux C, Romanet JP, Pepin JL. Non-arteritic anterior ischaemic optic neuropathy is nearly systematically associated with obstructive sleep apnoea. Br. J. Ophthalmol. 2006;90:879–882. doi: 10.1136/bjo.2005.087452. [DOI] [PMC free article] [PubMed] [Google Scholar]
- Perry VH, Henderson Z, Linden R. Postnatal changes in retinal ganglion cell and optic axon populations in the pigmented rat. J. Comp. Neurol. 1983;219:356–368. doi: 10.1002/cne.902190309. [DOI] [PubMed] [Google Scholar]
- Pineau I, Sun L, Bastien D, Lacroix S. Astrocytes initiate inflammation in the injured mouse spinal cord by promoting the entry of neutrophils and inflammatory monocytes in an IL-1 receptor/MyD88-dependent fashion. Brain Behav. Immun. 2010;24:540–553. doi: 10.1016/j.bbi.2009.11.007. [DOI] [PubMed] [Google Scholar]
- Pomeranz HD, Bhavsar AR. Nonarteritic ischemic optic neuropathy developing soon after use of sildenafil (viagra): a report of seven new cases. J. Neuroophthalmol. 2005;25:9–13. doi: 10.1097/00041327-200503000-00003. [DOI] [PubMed] [Google Scholar]
- Rangaswamy NV, Frishman LJ, Dorotheo EU, Schiffman JS, Bahrani HM, Tang RA. Photopic ERGs in patients with optic neuropathies: comparison with primate ERGs after pharmacologic blockade of inner retina. Invest. Ophthalmol. Vis. Sci. 2004;45:3827–3837. doi: 10.1167/iovs.04-0458. [DOI] [PubMed] [Google Scholar]
- Rodgers MAJ. Light-induced generation of singlet oxygen in solutions of rose bengal. Chem. Phys. Lett. 1981;78:509–514. [Google Scholar]
- Sakai T, Shikishima K, Matsushima M, Kitahara K. Endothelial nitric oxide synthase gene polymorphisms in non-arteritic anterior ischemic optic neuropathy. Graefes. Arch. Clin. Exp. Ophthalmol. 2007;245:288–292. doi: 10.1007/s00417-005-0245-7. [DOI] [PubMed] [Google Scholar]
- Salomon O, Huna-Baron R, Kurtz S, Steinberg DM, Moisseiev J, Rosenberg N, Yassur I, Vidne O, Zivelin A, Gitel S, Davidson J, Ravid B, Seligsohn U. Analysis of prothrombotic and vascular risk factors in patients with nonarteritic anterior ischemic optic neuropathy. Ophthalmology. 1999;106:739–742. doi: 10.1016/S0161-6420(99)90159-8. [DOI] [PubMed] [Google Scholar]
- Salomon O, Rosenberg N, Steinberg DM, Huna-Baron R, Moisseiev J, Dardik R, Goldan O, Kurtz S, Ifrah A, Seligsohn U. Nonarteritic anterior ischemic optic neuropathy is associated with a specific platelet polymorphism located on the glycoprotein Ibalpha gene. Ophthalmology. 2004;111:184–188. doi: 10.1016/j.ophtha.2003.05.006. [DOI] [PubMed] [Google Scholar]
- Schlamp CL, Johnson EC, Li Y, Morrison JC, Nickells RW. Changes in Thy1 gene expression associated with damaged retinal ganglion cells. Mol. Vis. 2001 Aug 15;7:192–201. [PubMed] [Google Scholar]
- Slater BJ, Mehrabian Z, Guo Y, Hunter A, Bernstein SL. Rodent anterior ischemic optic neuropathy (rAION) induces regional retinal ganglion cell apoptosis with a unique temporal pattern. Invest. Ophthalmol. Vis. Sci. 2008;49:3671–3676. doi: 10.1167/iovs.07-0504. [DOI] [PMC free article] [PubMed] [Google Scholar]
- Smeyne RJ, Vendrell M, Hayward M, Baker SJ, Miao GG, Schilling K, Robertson LM, Curran T, Morgan JI. Continuous c-fos expression precedes programmed cell death in vivo. Nature. 1993;363:166–169. doi: 10.1038/363166a0. [DOI] [PubMed] [Google Scholar]
- Soto I, Oglesby E, Buckingham BP, Son JL, Roberson ED, Steele MR, Inman DM, Vetter ML, Horner PJ, Marsh-Armstrong N. Retinal ganglion cells downregulate gene expression and lose their axons within the optic nerve head in a mouse glaucoma model. J. Neurosci. 2008;28:548–561. doi: 10.1523/JNEUROSCI.3714-07.2008. [DOI] [PMC free article] [PubMed] [Google Scholar]
- Tang Y, Lu A, Aronow BJ, Wagner KR, Sharp FR. Genomic responses of the brain to ischemic stroke, intracerebral haemorrhage, kainate seizures, hypoglycemia, and hypoxia. Eur. J. Neurosci. 2002;15:1937–1952. doi: 10.1046/j.1460-9568.2002.02030.x. [DOI] [PubMed] [Google Scholar]
- Tesser RA, Niendorf ER, Levin LA. The morphology of an infarct in nonarteritic anterior ischemic optic neuropathy. Ophthalmology. 2003;110:2031–2035. doi: 10.1016/S0161-6420(03)00804-2. [DOI] [PubMed] [Google Scholar]
- Thompson PD, Mastaglia FL, Carroll WM. Anterior ischemic optic neuropathy; a correlative clinical and visual evoked potential study of 18 p.tients. J. Neurol. Neurosurg. Psychiatr. 1986;49:128–135. doi: 10.1136/jnnp.49.2.128. [DOI] [PMC free article] [PubMed] [Google Scholar]
- Tormene AP, Doro D, Mantovani E, Fabris S, Moro F. Electrophysiological findings in anterior ischemic optic neuropathy. Metab. Pediatr. Syst. Ophthalmol. 1989;12:76–79. [PubMed] [Google Scholar]
- Viswanathan S, Frishman LJ, Robson JG. The uniform field and pattern ERG in macaques with experimental glaucoma: removal of spiking activity. Invest. Ophthalmol. Vis. Sci. 2000;41:2797–2810. [PubMed] [Google Scholar]
- Wang JM, Tseng JT, Chang WC. Induction of human NF-IL6beta by epidermal growth factor is mediated through the p38 signaling pathway and cAMP response element-binding protein activation in A431 cells. Mol. Biol. Cell. 2005;16:3365–3376. doi: 10.1091/mbc.E05-02-0105. [DOI] [PMC free article] [PubMed] [Google Scholar]
- Watson BD, Dietrich WD, Busto R, Wachtel MS, Ginsberg MD. Induction of reproducible brain infarction by photochemically initiated thrombosis. Ann. Neurol. 1985;17:497–504. doi: 10.1002/ana.410170513. [DOI] [PubMed] [Google Scholar]
- Wildberger H. Pattern-evoked potentials and visual field defects in ischaemic optic neuropathy. Doc. Ophthalmol. 1984;40:193–201. [Google Scholar]
- Williams RW, Strom RC, Rice DS, Goldowitz D. Genetic and environmental control of variation in retinal ganglion cell number in mice. J. Neurosci. 1996 Nov 15;16:7193–7205. doi: 10.1523/JNEUROSCI.16-22-07193.1996. [DOI] [PMC free article] [PubMed] [Google Scholar]
- Wilson CA, Hatchell DL. Photodynamic retinal vascular thrombosis. Invest. Ophthalmol. Vis. Sci. 1991;32:2357–2365. [PubMed] [Google Scholar]
- Wilson WB. Visual-evoked response differentiation of ischemic optic neuritis from the optic neuritis of multiple sclerosis. Am. J. Ophthalmol. 1978;86:530–535. doi: 10.1016/0002-9394(78)90302-1. [DOI] [PubMed] [Google Scholar]
- Zhang C, Guo Y, Miller NR, Bernstein SL. Optic nerve infarction and post-ischemic inflammation in the rodent model of anterior ischemic optic neuropathy (rAION) Brain Res. 2009;1264:67–75. doi: 10.1016/j.brainres.2008.12.075. [DOI] [PMC free article] [PubMed] [Google Scholar]
- Zhang HR. Scanning electron microscopic study of corrosion casts on retinal and choroidal angioarchitecture in man and mammals. In: Chader GJ, Osborne NN, editors. Prog. Retinal Res. Vol. 13. 1994. pp. 243–270. [Google Scholar]
- Zhao BQ, Suzuki Y, Kondo K, Kawano K, Ikeda Y, Umemura K. A novel MCA occlusion model of photothrombotic ischemia with cyclic flow reductions: development of cerebral hemorrhage induced by heparin. Brain. Res. Brain. Res. Protoc. 2002;9:85–92. doi: 10.1016/s1385-299x(01)00124-6. [DOI] [PubMed] [Google Scholar]


