

Abstract
Ultrasound contrast agents inside a microvessel, when driven by ultrasound, oscillate and induce mechanical stresses on the vessel wall. These mechanical stresses can produce beneficial therapeutic effects but also induce vessel rupture if the stresses are too high. Therefore, it is important to use sufficiently low pressure amplitudes to avoid rupturing the vessels while still inducing the desired therapeutic effects. In this work, we developed a comprehensive three dimensional model of a confined microbubble inside a vessel while considering the bubble shell properties, blood viscosity, vessel wall curvature and the mechanical properties of the vessel wall. Two bubble models with the assumption of a spherical symmetric bubble and a simple asymmetrical bubble were simulated. This work was validated with previous experimental results and enabled us to evaluate the microbubbles’ behaviour and the resulting mechanical stresses induced on the vessel walls. In this study the fluid shear and circumferential stresses were evaluated as indicators of the mechanical stresses. The effects of acoustical parameters, vessel viscoelasticity and rigidity, vessel/bubble size and off-center bubbles on bubble behaviour and stresses on the vessel were investigated. The fluid shear and circumferential stresses acting on the vessel varied with time and location. As the frequency changed, the microbubble oscillated with the highest amplitude at its resonance frequency which was different from the resonance frequency of an unbound bubble. The bubble resonance frequency increased as the rigidity of a flexible vessel increased. The fluid shear and circumferential stresses peaked at frequencies above the bubble’s resonance frequency. The more rigid the vessels were, the more damped the bubble oscillations. The synergistic effect of acoustic frequency and vessel elasticity had also been investigated, since the circumferential stress showed either an increasing trend or a decreasing one versus the vessel rigidity at difference acoustic frequencies. When the acoustic pressure was increased from 52 kPa to 680 kPa, the maximum bubble radius increase by 2.5 folds and the maximum shear and circumferential stress increased by 15.7 and 18.3 folds respectively. The shear stress was largest when the acoustic frequency was higher (3.25 MHz) and the ratio of the vessel radius to the bubble radius was lower. The circumferential stress was largest when the bubble wall was closer to the vessel wall. An oscillating off-center bubble forms a mushroom shape with the most damping on the points closest to the vessel wall.
1. Introduction
Microbubble ultrasound contrast agents inside the blood stream enhance the ultrasound signals of the vascular bed and are widely used in diagnostic ultrasound (Becher and Burns 2000, Goldberg et al 2001). More recently, it has been shown that microbubbles may also have potential for use in disease treatment. Some of these potential therapeutic applications include the enhancement of energy deposition in tissues (Klotz et al 2010), cell membrane lysis , drug and gene delivery into cells in vitro and in vivo (Miller et al 1998), (Bao et al 1998) and the opening of the blood brain barrier (BBB) locally and transiently for targeted drug and gene delivery (Hynynen et al 2001).
Stably oscillating bubbles (non-inertial) can be thought of as acoustic focusing agents that produce microstreaming. The streaming, which occurs near pulsating bubbles, induces a fluid shear stress on neighbouring cells or vessel walls (Lewin and Bjorno 1982, Wu 2002). This shear stress may generate bioeffects if cells are present in the microstreaming field. For instance, at high enough stresses, endothelial cells eventually detach or lose membrane integrity (VanBavel 2007). It has also been reported that shear stress gradients together with sign reversals may contribute to the disruption of endothelial cell membrane integrity and functionality (Mukundakrishnan et al 2009). Also, the vessel wall is more susceptible to the circumferential stress than longitudinal (axial) stress. Rowe et al speculated that this difference is because of the multidirectional layered structure of vessel wall. Furthermore, Zhong et al observed cellulose hollow fibre rupture along the axial direction of the fibre (Zhong et al 2001). This indicated that the failure of the fibre was due to the circumferential stress. Therefore, in order to safely use microbubbles, it is important to understand the mechanisms involved and estimate the mechanical effects due to microbubble oscillation on the vessel wall. In this study, after developing a simulation model of a confined microbubble inside a microvessel, we focus on estimating the mechanical effects induced by an oscillating bubble on endothelial cells. As an indicator of the mechanical effects, we calculated the fluid shear and circumferential stress on the vessel wall.
When a bubble is placed inside a tube, the confining surroundings affect the bubble’s behaviour and response and this has been shown numerically and experimentally in the literature. Previous numerical models simulated a bubble inside a confining vessel. Õguz and Prosperetti simulated a 2D geometry of a bubble inside different rigid vessels with open and closed ends (Õguz and Prosperetti 1998). Sassaroli and Hynynen expended the earlier work and performed a 2D simulation of a rectangular bubble inside a rigid vessel while accounting for damping as well (Sassaroli and Hynynen 2005). Ye and Bull used a 2D Boundary Element Method to simulate the vaporization of perfluorocarbon droplets turning into gas bubbles inside a rigid and flexible vessel (Ye and Bull 2006). In their simulations, the pressure on the bubble was 2 MPa and bubble expanded asymmetrically, an inviscid fluid and no bubble shell effects were assumed. Martynov et al simulated a 2D model of a bubble oscillating asymmetrically inside a vessel with the assumption of viscid fluid but no shell effects (Martynov et al 2009). Miao et al used a coupled Finite Element Method and Boundary Element Method code to simulate a 2D bubble oscillating asymmetrically inside an elastic vessel assuming inviscid fluid and no shell effects (Miao et al 2008). Gao et al simulated a 2D axisymmetrical model of an asymmetrical bubble inside a pseudoelastic vessel (Gao et al 2007). They assumed inviscid fluid and no shell effects and their simulations were performed for the application of shock-wave lithotripsy with the shock wave amplitude of 2.6 MPa. Qin and Ferrara simulated a 2D axisymmetrical model of a bubble inside an elastic vessel (Qin and Ferrara 2007). They used asymmetrical bubble and assumed viscid fluid but no bubble shell effects. The results from these numerical works imply that microbubble’s resonance frequency, maximum relative expansion and damping change when confined within a vessel compared to an unbound bubble inside an infinite fluid. Also experimentally Caskey et al studied the oscillation of microbubbles in 12, 25 and 195 μm microvessel phantoms and they found that the bubble’s amplitude of oscillation is substantially decreased when compared to the Raleigh–Plesset model prediction for microbubbles in an infinite liquid (Caskey et al 2006). Since the aim of this work is to estimate the mechanical effects of microbubbles, it is very important to have a realistic confined encapsulated microbubble model while accounting for the shell effects and vessel wall curvature.
Previously, a number of studies were performed to calculate the shear stress (Gao et al 2007), (Wu 2002), (Krasovitski and Kimmel 2004) and (Miao et al 2008). Wu used a modified Rayleigh-Plesset equation and velocity gradient within a boundary layer from the bubble surface to calculate the shear stress (Wu 2002). Krasovitski and Kimmel modeled a two dimensional computational domain with a bubble oscillating inside a potential flow close to a wall (Krasovitski and Kimmel 2004). In their study, the solution for potential flow was obtained numerically using a boundary integral method and the shear stresses on the vessel wall were obtained. Miao et al coupled the boundary element and finite element methods (FEM) to simulate an axisymmetrical two dimensional model of a microbubble inside a vessel with different elasticities (Miao et al 2008). The fluid was treated as a potential flow and the circumferential stress and principal stress were calculated. These studies calculated the values for shear stress and normal stresses on the vessel wall. However, in most of these studies the confinement effect on the bubble oscillation was ignored and an unbound bubble model was employed. Furthermore, in these studies either the wall curvature was ignored (due to the two dimensional nature of the simulation) or the flow was simplified as a potential flow (assuming irrotational flow). In most of the previous studies, the fluid was assumed inviscid as well.
In this study, we developed a three dimensional numerical model of a confined bubble inside a flexible viscoelastic, elastic or rigid microvessel in order to investigate the mechanical stresses (shear stress, circumferential stress) on the vessel wall more realistically. This model is solved using the finite element method. The gas law for the bubble is used to calculate the bubble’s oscillation with the effects of the bubble shell and fluid viscosity present. To increase the model’s accuracy, we implemented a two-way coupling between the bubble’s wall and the surrounding fluid as well as a two-way coupling between the fluid and the vessel wall. Symmetrical and asymmetrical bubble oscillations were studied for bubbles in the center of the vessel or off-center respectively. The three dimensional geometry used in this work gives the advantage to account for the wall curvature in small vessels which is lacking in the two dimensional models (Krasovitski and Kimmel 2004). Also microbubbles located closer to one side of the vessel wall are simulated. Blood is treated as a viscous fluid and a general form of the fluid flow is solved. This model is then used to investigate the influence of acoustical parameters, vessel properties, vessel/bubble size and off-center bubbles on the bubble oscillation and vessel wall mechanical stresses.
2. Methods
In our model a microbubble was placed inside a microvessel (5 μm in radius 2 μm thickness and 204 μm in length). All vessels were simulated with the same radius, thickness and length unless otherwise mentioned. Figure 1 illustrates the three dimensional geometry of the bubble, blood and microvessel that was used for the numerical simulation. Due to the symmetry on the two ends of the microvessel, only half of the domain was calculated to save some computation time. The vessel was free (not fixed to the surrounding tissue) and it was assumed as a “tube in liquid” where the capillary walls themselves bear the distending stress and the elasticity values were chosen according to this assumption (Smaje et al 1980).
Figure 1.

Aschematic illustration of the 3 dimensional geometry of bubble, blood and microvessel which was used for the numerical simulation. This is in a cylindrical coordinate where θ is in the vessel circumferential direction (r (radial), θ (azimuthal), z (axial)). (a) bubble in the middle of the vessel, (b) an off-center microbubble, (c) side view of an off-center bubble.
The ideal gas law (Leighton 1994) was used to model the bubble oscillation. The oscillating bubble wall was coupled to the surrounding blood and the blood was coupled back to the bubble in order to feed the fluid’s pressure back on the bubble surface. On the other hand, the fluid motion itself at the vessel wall causes the compliant vessel to undergo dilation. The vessel wall deformation was coupled back to the fluid in order to create a more realistic model. Therefore, the fluid pressure and velocity were not only affected by the bubble oscillation but also by the vessel wall movement. Table 1 summarized the notation used in this work. Some of the constants used included the ambient pressure inside capillaries P0 = 104.6 kPa, the surface tension = 0.072 N/m and the gas Polytropic index = 1.07 (van der Meer et al 2007). Other vascular properties were chosen from (Duck 1990), in which the vessel density was 1055 kg/m3, Poisson’s ratio was 0.49 and the vessel elasticity was in the mega Pascal range.
Table 1.
Notation.
| Symbol | Definition of symbol |
|---|---|
| v | Velocity of the fluid (m/s) |
| ρ | Fluid density (kg/m3) |
| μ | Dynamic viscosity of the fluid (Pa.s) |
| r | Radial direction in cylindrical coordinate system (m) |
| z | Axial direction in cylindrical coordinate system (m) |
| θ | Azimuthal direction in cylindrical coordinate system (m) |
| L | Half of the vessel length (m) |
| R | Bubble’s radius (m) |
| R0 | Initial bubble radius (m) |
| ε0 | Bubble radial Variation |
| rv | Initial vessel radius (m) |
| κs | shell viscosity (kg/s) |
| χ | shell elasticity (N/m) |
| PL | Fluid pressure at the bubble wall (Pa) |
| P0 | Ambient pressure in the capillaries (Pa) |
| Pv | Vapour pressure (Pa) |
| Pa | Acoustical pressure amplitude (Pa) |
| P | Fluid pressure (Pa) |
| Pi | Intravascular pressure (Pa) |
| σ | Surface tension (N/m) |
| f | Acoustic frequency (Hz) |
| κ | Polytropic index |
| τ | Relaxation time (s) |
| τxz | Fluid Shear Stress in Cartesian coordinates (Pa) |
| E | Young’s modulus (Pa) |
| e | Diameter strain |
| σθθ | Circumferential stress or Hoop stress (Pa) |
2.1. Fluid Domain
Blood was assumed incompressible and Newtonian. Navier-Stokes equations were used (Currie 1993):
| (1) |
Due to the inverse Fahraeus–Lindqvist effect, in which blood viscosity increases with decreasing the microvessel size, the blood viscosity used in this work was set to be 0.005 Pa.s (Dintenfass 1967) and (Whitmore 1967).
2.2. Microbubble
The bubble size was set to 2 μm unless otherwise mentioned. The bubble’s shell viscosity (κs) was 10−8 [kg/s] and the shell elasticity (χ) was 0.54 [N/m]. This is the shell properties reported for BR-14 (Bracco SA, Geneva) microbubbles with phospholipid shell and perfluorobutane gas (van der Meer et al 2007).
Using the gas equation, the bubble’s oscillation should satisfy the following equation:
| (2) |
where P(t), the acoustic pressure at the bubble wall, is Pa sin(2πft) and Pa and f are the acoustical amplitude and frequency respectively and t is time. The acoustical properties, such as ultrasound frequency and pressure, were controlled from P(t) in equation (2). PV, the vapour pressure, was assumed zero. The third and forth terms on the right hand side in equation (2) represent the surface tension and the fluid viscosity effect on the bubble wall. The fifth and sixth terms on the right hand side are responsible for the shell viscosity and elasticity, respectively. The shell model was proposed by de Jong et al (de Jong et al 1994), and later represented by van der Meer et al (van der Meer et al 2007) in the form shown in equation (2).
In this work, it was assumed that the incoming acoustic wave is spherical and acting on the bubble wall. Due to the large acoustic wavelength (i.e. a few millimetres) compared to the bubble size, we could safely assume that the acoustic pressure is the same around the bubble. Nevertheless, some test simulations (not shown here) were performed when the acoustic wave was acting on the vessel wall and the bubble was excited indirectly from the fluid pressure variation. These test results were very close to the work reported in the results section.
The frequency was varied over the range 0.1 to 5 MHz in this work and pressure varied from 52 to 680 kPa.
2.2.1 Spherical Symmetry
Using equation (2), we assumed a spherical symmetry on the bubble wall. The liquid pressure everywhere on the bubble surface was integrated, and normalized to the bubble surface area. The resultant pressure gave PL in equation (2) and then from this equation the equivalent bubble radius was calculated at each time. In reality at high pressures the bubble in a confined vessel oscillates forming an ellipsoid shape (Fig. 3a of reference Chen et al 2011a). The resultant spherical radius in this section is analogous to the equivalent radius of an ellipsoid bubble.
The bubble wall was coupled to the fluid which caused the fluid to move. This was done by equating the bubble velocity (Ṙ) to the fluid velocity at the bubble wall. The fluid pressure at the bubble wall was fed back to equation (2) to control the bubble oscillation as a result of the fluid pressure change.
In most of the simulations, a spherical symmetric bubble oscillation was used because asymmetrical bubble model was computationally expensive. Furthermore, in most of the parameters used in this work, the spherical symmetry assumption holds (see discussion).
2.2.2 Asymmetrical
Asymmetrical bubble oscillation was considered as well and in that the bubble surface (hemisphere) was divided into 48 sections, each section with the same area (shown in Fig 1b). The local pressure at each section was integrated over that section and normalized to the area of that section. Using equation (2), the radius of each local section is calculated and the integration of these local radii forms the overall bubble shape. We used a finer mesh to accurately account for all the section and simultaneously solve for all the 24 (due to symmetry) equations. This simulation was computationally expensive and only in the off-center bubbles were incorporated. In the Discussion section, the results from a spherical symmetric and asymmetrical bubble models are compared in more details.
2.3. Blood Vessel Wall Deformation
In order to simulate the vessel wall, elastic and viscoelastic models were chosen. Elastic vessel wall was modeled using a linear elastic equation (Hooke’s law) assuming a homogeneous and isotropic medium. The Young’s modulus of the vessel was chosen between 1–10 MPa to fit the physiological rage (Duck 1990). Also a rigid vessel with 100 MPa Young’s modulus was simulated as well. Although Young’s modulus of 100 MPa is not in the physiological range, it can still mimic microvessels close to a bone and it was simulated to represent the effects of a rigid vessel on the resonance frequency. The linear elastic constitutive equation is given as , where δij is the Kronecker delta (if i = j, δij = 1, and if i ≠ j, δij = 0) and σij and εij are the ijth components of the stress and strain tensors, respectively. Young’s modulus (E) and Poisson’s ratio (ν) are the material parameters.
For the viscoelastic case we used a standard linear solid model with two branches (a special case of the generalized Maxwell equation) (Christensen 1982). The standard linear solid model (SLS) was chosen because it prevails other viscoelastic models because it predicts both creep and stress relaxation. SLS combines aspects of the Maxwell and Kelvin–Voigt models to accurately describe the overall behaviour of a system under a given loading condition. Skalak and Schmid-Schönbein obtained viscoelastic properties of microvessels in rat spinotrapezius muscle by performing some experiments and fitting the results to a SLS model (Skalak and Schmid-Schönbein 1986). The viscoelastic parameters used in this study were taken from (Skalak and Schmid-Schönbein 1986). Therefore, we have also recruited a SLS model to reproduce the stresses and strains reported in their experiments.
A model of two Maxwell branches was used with E1 = 93.325 kPa and E2 = 6.661 kPa, and relaxation time τ1=43 s (Skalak and Schmid-Schönbein 1986). In a separate simulation, these values were given to a microvessel and the resulting strain was consistent with strains reported in this reference.
The governing differential equation of this Viscoelastic model is (Christensen 1982), (Skalak and Schmid-Schönbein 1986):
| (3) |
where pi is the intravascular pressure and e is the diameter stain.
E1 and E2 are elastic coefficients with dimensions of pressure, and η1 represents a viscous coefficient with dimension of pressure times time. The relaxation time, τ, is the ratio of viscous coefficient to elastic coefficients for each branch.
2.4. Boundary Conditions and Method of Solution
For boundary conditions, fluid velocity at the vessel was assumed to be equal to the vessel wall velocity and the pressure on the ends of the long vessel and the initial condition of the whole blood vessel were set to the ambient pressure in the capillaries, P0.
The vessel length for these simulations was set to 204 μm (i.e., 2×L), which is long enough to make the results independent of the length and have less impact from vessels ends on the microbubble (i.e. when the vessel ends were fixed or free the difference in bubble oscillation was 0.03%, and the variation in maximum shear and circumferential stress were less than 2%).
The numerical part was solved with the finite element method using Comsol Multiphysics 3.5a (COMSOL AB. Burlington, MA) along with a structural mechanics module.
In the finite element method, each computational geometry is divided into small units to produce element meshes. In this three dimensional model, tetrahedral meshes were used and typically more than 10,000 mesh elements were solved for this bubble-blood-vessel geometry. Since this model was time dependent, the time resolution was set 0.01 μs.
Since the bubble and vessel wall boundaries of our computational domain were moving in time, the simulation was performed using a Moving Mesh (Arbitrary Lagrangian-Eulerian) method (Nomura 1994, Donea et al 2004). The point of using this method is that a new mesh does not need to be generated for each configuration of the boundaries. Instead, the mesh nodes are perturbed so they conform with the moved boundaries. When the material motion is more complicated, like in a fluid flow model, the Lagrangian method is not appropriate. For such models, an Eulerian method, where the mesh is fixed, is often used. However, this method cannot account for moving boundaries. The Arbitrary Lagrangian-Eulerian (ALE) method is an intermediate between the Lagrangian, where the mesh movement follows the movement of the physical material and Eulerian methods, where the mesh is fixed. ALE allows moving boundaries without the need for the mesh movement to follow the material.
After solving the model, the shear stress was evaluated at the vessel wall using the shear stress equation e.g. in Cartesian coordinates (Currie 1993) , where coordinates are (x, y, z) and fluid velocities are (u, v, w).
The other important stress, the circumferential stress, was calculated using thick wall cylinder equations (Srivastava and Gope 2007):
| (4) |
where σθθ was the circumferential stress, ri and ro are inner and outer vessel diameters and Pi and Po were pressure on the inner diameter and outer diameter on the vessel wall respectively. Also r was a radial point between, ri and ro.
Bubble oscillation, fluid shear stress and circumferential stress were calculated as a function of acoustic frequency, acoustic pressure, vessel type (elastic or viscoelastic), vessel rigidity, vessel/bubble size and off-center bubbles.
2.5. Validation
In order to compare the oscillation of an unbound bubble with the solution of the Rayleigh-Plesset equation (Leighton 1994), a simulation was performed in which a bubble was placed inside a free fluid without any confinement. Figure 3 illustrates the result of this simulation along with the solution to the Rayleigh-Plesset equation. The numerical simulation is very similar to the Rayleigh-Plesset equation except in the compression phase.
Figure 3.

Comparison between the FEM simulation on an unbound bubble and the solution of Rayleigh-Plesset equation. Pa = 2.5 P0, f = 1 MHz, R0 = 2 μm.
This model was validated using some experimental data from references (Garbin et al 2007a) and (van der Meer et al 2007) in which a microbubble was placed close to a wall and a bubble was located inside a 200 μm capillary vessel respectively. Figure 4a shows the comparison between an unbound bubble and a microbubble kept at a wall with an optical tweezers system. The simulation parameters were set so that the bubble size and bubble shell materials were close to those performed in the experiment (R0 = 2.45 μm, f = 2.25 MHz, Pa = 200 kPa, χ = 0.8 Nm−1, κs = 2×10⁻⁸ kg s−1 (Garbin et al 2007b). An unbound bubble oscillation from the Rayleigh-Plesset equation was also plotted for the comparison. The bubble oscillation from the numerical simulation was following a similar trend as the experimental data. In the numerical data, there was a deviation of 40% and 160% from the experimental results in the first and second expansion phase cycles, respectively (the maximum peak value minus the initial bubble size gave the relative expansion. The relative expansion of numerical curve was then subtracted from the relative expansion of the experimental curve and normalized to the relative expansion of the experimental curve. The resultant multiply by 100 gave the percentage of deviation). The Rayleigh-Plesset equation has a 500% deviation from the experimental results and therefore the numerical result is much closer to the experimental results than the solution of the Rayleigh-Plesset equation. The deviation in the numerical result could be due to a slight distance between the bubble and wall in our numerical work or from the spherical symmetric bubble assumption. In the above experiment, when the bubble was kept away from the wall, the bubble oscillation was similar to the Rayleigh-Plesset solution (Figure 2 in reference (Garbin et al 2007a)) and numerical simulations from our work obtained similar results for the unbound bubble (data is not shown). In Figure 4b, we compared our numerical simulation with data obtained on the bubble oscillation inside a 200 μm capillary vessel (van der Meer et al 2007). The experimental and numerical data are closely matching when appropriate parameters are chosen (i.e., Pa = 58 kPa, f = 2.5 MHz, R0 = 1.7 μm, , χ = 0.32 Nm−1, κs = 0.2×10⁻⁸ kg s−1). However, there was a difference between the two curves at the beginning and the end of the bubble oscillation and this was because we used a continuous wave in our numerical simulations but in the experimental data (from (van der Meer et al 2007)) the pressure wave was tapered taking a Gaussian envelope at the two ends of the burst.
Figure 4.

Validation of Experimental Data (a) Validation with optical tweezer experiment (Garbin et al 2007a). The dotted line shows the Rayleigh-Plesset solution of an unbound bubble. Solid line is the experimental result of the bubble oscillation close to a wall (Garbin et al 2007a) and solid line with dot represents the bubble radius from numerical simulation of this model. Pa = 200 kPa, f = 2.25 MHz, R0 = 2.45 μm. (b) Validation with a bubble inside a 200 μm capillary vessel. The dotted line shows the experimental result of a bubble oscillation inside a vessel (van der Meer et al 2007) and solid line the bubble radius from our numerical simulation. Pa = 58 kPa, f = 2.5 MHz, R0 = 1.7 μm.
For the validation, several aspects were considered. It was ensured that the fluid mass was conserved, div(ρ.v) = 0, where ρ was the fluid density and v was the fluid velocity. With an incompressible fluid ρ was a constant and therefore div(v)= 0.
The propagating wave speed along a flexible tube wall was estimated with a simplified equation which assumes a linear relationship between area and pressure. This wave speed is where ρ is the blood density and C is the compliance; where A0 is the initial vessel area, ΔA is the variation in the area and ΔP is the variation in the pressure. We calculated the wave speed from the above equation and also estimated the wave speed from the vessel wall movement in our numerical model. For a 5 MPa elastic vessel, the propagating wave speed was 23.7 m/s and there was a good agreement between the above equation and the model with less that 3% error.
3. Numerical Results
The maximum expansion of a microbubble and the mechanical stress on the vessel wall were evaluated and then subjected to a sensitivity analysis study. Acoustic frequency and pressure, vessel rigidity and vessel/bubble sizes and the bubble position in the middle of the vessel were varied in order to investigate their effects on bubble oscillations and induced mechanical stresses.
Bubble’s radial oscillation (ε0 which is R –R0) and microvessel wall movement above the bubble (z = 0, r = rv) are shown in Fig. 5. This figure demonstrates that the vessel wall above the bubble oscillates (almost in phase due to the short distance between the bubble and vessel wall) with the microbubble.
Figure 5.
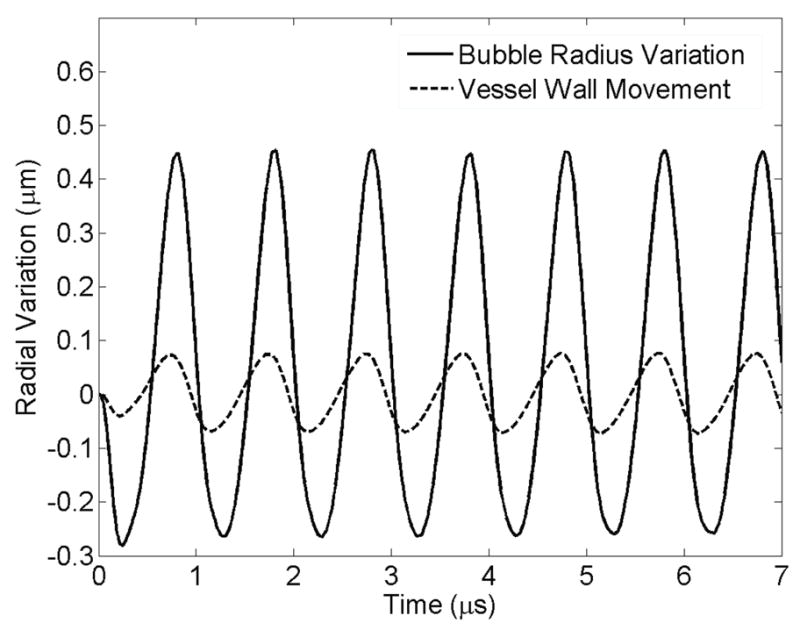
Radial variation of the bubble wall and vessel wall versus time for 7 μs. E = 5MPa, Pa = 2.5 P0, f = 1 MHz, rv = 5 μm, R0 = 2 μm. The solid line shows bubble radius oscillation and the dashed line represents the vessel wall movement above the bubble.
Figure 6 illustrates the radial expansion of the vessel wall versus the axial direction (z) at different snapshots in time. The bubble is oscillating at the origin of the axial direction. As time progresses, waves form from the origin and travel towards the end of the vessel. For the viscoelastic vessel, the propagating wave dies down and vanishes completely at z/l=0.6.
Figure 6.

Wave propagation along the vessel wall. Radial expansion of the vessel wall versus normalized axial direction (z) from the middle of the vessel to its end, showing a wave traveling inside an elastic vessel at different snapshots in time, E = 5 MPa, Pa = 2.5 P0, f = 1 MHz, R0 = 2 μm and rv = 5 μm. The axial direction is normalized to length of the vessel (L=102 μm).
The fluid streamlines for a rigid and an elastic vessel are illustrated in Figs. 7a and 7b respectively. The addition of wall flexibility resulted in a much more complicated flow field than in the rigid wall. In Fig. 7b there are some stagnation points, where the local velocity of the fluid is zero. This is due to the collision of two opposing flows.
Figure 7.

Streamlines and stagnation points of (a) a rigid vessel, (b) an elastic vessel at time 4 μs. E = 5MPa, Pa = 2.5 P0, f = 1 MHz, rv = 5 μm, R0 = 2 μm.
The maximum fluid shear stress occurred in front of the bubble at the vessel wall (z > 0, r = rv) and the maximum circumferential stress happened exactly above the bubble at the vessel wall (z = 0, r = rv). These mechanical stresses are shown in Figure 8 as a function of time and distance along the vessel. Figs. 8a and 8b show an oscillating shear stress versus time and axial direction respectively. Figs. 8c and 8d illustrate the circumferential stress on the vessel which also oscillates as a function of time and axial location.
Figure 8.

Temporal and spatial variation of stresses (a) Fluid shear stress at point z = 2.4 μm, r = rv, (b) The shear stress versus normalized axial direction, (c) Circumferential stress versus time at point z = 0, r = rv , (d) Circumferential stress versus normalized axial direction. E = 5 MPa, Pa = 2.5 P0, f=1 MHz, rv = 5 μm, R0 = 2 μm.
In Figure 9a, a 2 μm bubble is located inside an unbound fluid, a viscoelastic vessel (with the properties described in section 2.3. of the methods), and 2 MPa, 5 MPa, 10 MPa and 100 MPa tubes (where the Young’s modulus of 100 MPa represents a rigid tube). For each case the maximum radius expansion is plotted versus the acoustic frequency at a fixed acoustic pressure. This trend suggests more rigid vessels have higher damping impact on the bubbles resulting in smaller bubble expansion and the resonance peak at stiffer vessels shifts towards higher frequencies. The rigid vessel shown as a solid line with squares had the lowest bubble expansion values with a peak at the lower end of the frequency spectrum and there is another peak at 5 MHz. To investigate the peak at 5 MHz for a rigid vessel, figure 9b plots the maximum bubble radius normalized to the bubble initial radius versus the initial radius of different bubble sizes. This curve peaks for a 2 μm bubble suggesting that 5 MHz is not the resonance frequency of other bubble sizes except a 2 μm bubble.
Figure 9.

(a) Maximum bubble expansion as a function of acoustic frequency of a bubble inside different vessels. Pa = 2.5 P0, rv = 5 μm, R0 = 2 μm. (b) Maximum bubble oscillation normalized to the initial bubble size versus the initial bubble size inside a rigid vessel.
In Figures 10 and 11 the maximum shear and circumferential stresses of a 2 μm bubble inside viscoelastic and 2 MPa, 5 MPa and 10 MPa elastic vessels are plotted versus the frequency respectively. The shear stress in Fig 10 peaks at a specific frequency higher that the bubble’s resonance frequency. In more rigid vessels, this peak was broader and happened at slightly higher frequencies than softer vessels. The shear stress value inside a viscoelastic elastic vessel was the highest. The circumferential stress for each elastic vessel in Fig 11 has an increasing trend versus the acoustic frequency, but at each frequency this stress shows two different trends versus vessel rigidity. At frequencies lower than 1.5 MHz a rise in the vessel stiffness resulted in an increase in circumferential stress. However, at frequencies above 2.5 MHz a rise in the vessel stiffness resulted in an inverse pattern (the circumferential stress decreases).
Figure 10.

Fluid shear stress versus acoustic frequency for elastic and viscoelastic vessels. Pa = 2.5 P0, rv = 5 μm, R0 = 2 μm.
Figure 11.

Circumferential stress versus acoustic frequency for elastic and viscoelastic vessels. Pa = 2.5 P0, rv = 5 μm, R0 = 2 μm.
Figure 12 presents the effects of acoustic pressure at the resonance frequency of a confined bubble inside a 5 MPa tube (3.25 MHz). Figure 12a shows the maximum bubble expansion versus the acoustic pressure ranging from 52 to 680 kPa (0.5–6.5 times P0). The bubble expanded more as the acoustic pressure rises but the trend is not linear and this increase is rather with a second order of polynomials. Figures 12b and 12c represent both fluid shear and circumferential stress respectively. These stresses increased with the applied acoustic pressure almost linearly. High acoustic pressures resulted in larger bubble oscillations and stronger microstreaming. This leads to larger forces applied on the vessel wall. Linear fits to Fig. 12b and 12c give slopes of 7000 and 80000 for shear and circumferential stresses respectively. Therefore it can also be extracted that the circumferential stress is more sensitive to the acoustic pressure and bubble expansion than the shear stress.
Figure 12.

Maximum bubble expansion (a) maximum shear (b) and circumferential stress (c) versus acoustic pressure. E = 5MPa, f = 3.25 MHz, rv = 5 μm, R0 = 2 μm.
In Figure 13 the microbubble size was varied while keeping the vessel size constant. Figs. 13a, b, c and d show the maximum bubble radius, maximum vessel wall movement, maximum shear stress and circumferential stress versus bubble’s initial radius respectively (Initial vessel radius was rv = 5 μm, acoustic pressure was Pa = 2.5 P0 and vessel elasticity was E = 5MPa, the vessel thickness was 2 μm). Two different frequencies of 1MHz (which was the off resonance frequency of a 2 μm bubble) and 3.25 MHz (which was the resonance frequency of a 2 μm bubble) are shown in these plots. As a reminder from Fig. 9, 3.25 MHz was the resonance frequency of a 2 μm bubble inside a 5 μm, 5 MPa vessel and when the bubble size is changed its resonance frequencies changes as well. At 3.25 MHz frequency there were “bump-like” features, as can be seen in Fig. 13, around 2 and 2.5 μm bubbles. The acoustic frequency at 1 MHz was closer to the resonance frequency of a larger bubble (4.5 μm bubble in Fig. 13).
Figure 13.

Maximum bubble expansion (a) vessel wall movement (b) maximum shear (c) and circumferential stress (d) versus initial bubble radius. E = 5 MPa, Pa = 2.5 P0, rv = 5 μm.
Maximum bubble radius, vessel wall movement, shear stress and circumferential stress are illustrated in Figures 14a, b, c and d as a function of vessel radius while the initial bubble radius was kept constant (Initial bubble radius was r0 = 2 μm, acoustic pressure was Pa = 2.5 P0 and vessel elasticity was E = 5MPa, the vessel thickness was 2 μm). Each Figure is plotted at 1 MHz and 3.25 MHz frequencies.
Figure 14.

Maximum bubble expansion (a) vessel wall movement (b) maximum shear (c) and circumferential stress (d) versus initial vessel radius. E = 5MPa, Pa = 2.5 P0, r0 = 2 μm.
The shear stress depends on the acoustic frequency and the rv/r0 value (this is elaborated in the Discussion section: the analytical equation for the shear stress). Higher frequencies and smaller rv/r0 resulted in larger shear stresses as shown in Figs 13c and 14c.
The circumferential stress was more dominated by the bubble expansion. In Fig. 13d larger bubbles exerted higher pressures on the vessel wall and therefore there was an increasing trend for the circumferential stress with a local increase around 2 or 2.5 μm bubbles. In Figure 14d when the vessel size is increased the bubble wall is farther away from the vessel and therefore the circumferential stress decreases. However, at the resonance frequency (3.25 MHz) the bubble resonated and expanded more in larger vessels which caused the circumferential stress to rise back up. Bubble expansion and vessel size were the two competing factors in the circumferential stress. In the results from Figs. 13 and 14, shear stress was the only stress that changed approximately according to a non-dimensional parameter rv/r0 (the ratio of the initial vessel radius to the initial bubble radius). Figure 15 shows the maximum shear stress versus rv/r0 at 1 MHz and 3.25 MHz frequencies while either changing the bubble radius or the vessel radius. The shear stress is larger at 3.25 MHz everywhere on this plot and also this stress increases as rv/r0 decreases.
Figure 15.

Maximum shear stress versus the vessel radius normalized by the initial bubble radius. E = 5MPa, Pa = 2.5 P0.
Another set of simulations were performed using an asymmetrical bubble model (describe in section 2.2.2). A microbubble was placed off center (in this case 2.5 μm away from the vessel center) as shown in Figures 1b and 1c.
Figure 16 shows the oscillation of each point (points are defined in Figs. 1b and 1c) on the bubble wall. Point Rr1, having the closest distance to the vessel wall, is oscillating with the lowest amplitude while Rz (located at r = r0 and z = 0) has the largest amplitude of oscillation. In a 3D view, the oscillating bubble forms a mushroom shape.
Figure 16.

Oscillation of a bubble 2.5 μm away from the vessel center versus time for different points on the bubble wall, (a) at 1 MHz, (b) at 3.25 MHz, E = 5MPa, Pa = 2.5 P0, r0 = 2 μm.
The stresses due to a 2 μm oscillating bubble located at 2.5 μm off-center is plotted in Fig 17 versus the azimuthal angle. The highest bubble impact is at zero degrees at the wall closest to the bubble surface. At 90° and 270° degrees the bubble points and vessel wall have the same distance and owing to its symmetry exert the same amount of stress. Also at 3.25 MHz (which was the resonance frequency of a 2 μm bubble in a 5 μm, 5 MPa vessel) the stresses are higher compared to the 1 MHz acoustic frequency.
Figure 17.

Maximum shear (a) and circumferential stress (b) versus the azimuthal angle for a bubble 2.5 μm away from the vessel center. E = 5MPa, Pa = 2.5 P0, r0 = 2 μm. The blue line with open circle shows f=1 MHz, and the red line with asterisks represents f = 3.25 MHz.
4. Discussion and Summary
It this study, a comprehensive three dimensional model of an oscillating microbubble confined inside a vessel was created. In this model there was a double coupling between the bubble wall and surrounding fluid causing a fluid motion and a confined bubble oscillation. Also, another double coupling was incorporated on the vessel wall such that the fluid movements made the microvessel oscillate and at the same time this wall velocity was coupled to the fluid causing its pressure and velocities to change. Spherical symmetric and asymmetrical bubble models were considered in this work. We validated this work with experimental results of a bubble inside a tube and a bubble close to a wall (Figs. 3, 4a and 4b).
This model is an extension of other existing models and reflects real conditions well, in that it accounts for the bubble shell properties, vessel wall curvature and fluid viscosity. This work can help us achieve a better estimation of the microbubble behaviour and resulting mechanical stresses on the vessel wall to eliminate any harm on the tissue or to increase local vessel permeability (depending on the application). The vessel elasticity can be changed to model microvessels in different locations e.g. brain, skin or close to a bone which have different capillary types and rigidities (Standring 2005, Kassab et al 1999, Lee and Schmid-Schönbein 1995, Smaje et al 1980).
Fluid streamlines (shown in Fig. 7) describe two different situations of a microbubble inside a rigid and a flexible vessel with similar flow patterns (shown in (Ye and Bull 2004) for a rigid vessel and (Ye and Bull 2006) for an elastic flexible vessel). The complicated flow pattern with stagnation points inside a flexible tube happens because on the one hand the bubble expands and pushes the fluid away and at the same time the expanded vessel in front of the bubble “sucks” the liquid from the reservoir into the vessel in order to conserve the liquid mass. Therefore the two opposing flows make a stagnation point.
As the microbubble oscillates, the vessel wall oscillates as well and a wave propagates along the vessel towards its ends. The fluid shear and circumferential stresses on the vessel oscillate with time and location on the vessel. The shear stress is a maximum when the bubble wall acceleration is zero or the bubble wall velocity is constant. Fig. 8 illustrates that stresses oscillate versus time and location, and in fact Mukundakrishnan et al speculated that the shear stress gradients together with sign reversals contribute to the disruption of endothelial cell membrane integrity and functionality (Mukundakrishnan et al 2009). The temporal and spatial oscillation of shear stress has also been reported by T. Ye and J. Bull (2006) (see Fig. 6b of reference (Ye and Bull 2006)). The maximum shear stress occurs in front of the bubble, in the axial direction (z>0), while the maximum circumferential stress happens right above the bubble (z=0).
In Fig. 9a, when the vessel gets more rigid (e.g. a vessel attached to the bone), the microbubble oscillation inside the vessel is more damped. This finding is consistent with the work of others (Sassaroli and Hynynen 2005, Qin and Ferrara 2006). It is apparent that in stiffer vessels the bubble resonance frequency (where the maximum bubble expansion is reached) is higher. The shift towards higher frequencies with the vessel stiffness was also reported by (Martynov et al 2009). This could be explained from the mass and spring perspective where more rigid vessels have larger stiffness and therefore larger resonance frequencies. For the rigid vessel case, the bubble resonates at 5 MHz (Fig. 9b shows that only a 2 μm bubble within a rigid vessel is at resonance at 5 MHz). It is also interesting to note that the bubble radius increases at the lower end of the frequency spectrum. This can be attributed to the fact that at lower frequencies the bubble has more time to expand (similar to the solution of Rayleigh-Plesset equation). The bubble expansion in some of the elastic vessels had a small peak at the subharmonic frequency (half of the resonance frequency) as well.
It is important to note that the rigid vessel define in this manuscript is different from an ideal rigid vessel with an infinite vessel length. In the ideal rigid vessel, the vessel wall has absolutely no movement and the vessel has an infinite length, therefore due to the inertia force (bubble has to push/pull two infinite liquid columns) bubbles would not oscillate. But in the case of our simulation, a rigid vessel was defined such that it has 100 MPa elasticity and the vessel has finite length therefore the bubble undergoes some oscillations when excited. Caskey et al optically observed a lipid shelled bubble with an initial diameter of 2.5 μm within a 12 μm diameter PMMA tubing (>1000 μm in length) at 1.4 MPa and 1 MHz undergoes oscillations (Caskey et al 2006, Fig 2c of the reference). PMMA tubing has a Young’s modulus of at least 18 times more rigid than our rigid vessel. Also a number of numerical simulations were performed on bubbles bound inside a rigid vessel (Õguz and Prosperetti 1998, Sassaroli and Hynynen 2005, Ye and Bull 2004).
The shear stress versus frequency in Figure 10 also shows a peak (similar to Fig. 9a) however, it happens at higher frequencies than the resonance frequency (e.g. a 2 μm bubble inside 5 MPa vessel has a resonance frequency of 3.25 MHz and the shear stress this bubble generates peaks at 3.75 MHz). In the viscoelastic vessel the shear stress is the largest and its peak value is 1.6 times that of a 5 MPa vessel. This difference could be due to the viscous damping of the viscoelastic vessel. The shift in the peak location could be explained from the theory derived by Nyborg (Nyborg 1958) and (Lewin and Bjorno 1982). Assuming a Newtonian fluid inside the blood vessel, the shear stress is proportional to the velocity gradient. This gradient in a thin boundary layer away from the bubble is given by where ε0 equals to R – R0 and f is the acoustic frequency. In this equation, is the boundary layer thickness. Therefore, the velocity gradient, G, is proportional to ε02 and to . This means that there is a trade-off between the bubble radius and the acoustic frequency. On the one hand the bubble oscillates with maximum amplitude when the frequency is approaching the bubble resonance frequency. On the other hand, the velocity gradient increases with frequency. At higher frequencies above 3.25 MHz, the bubble oscillation (ε0) is slightly lower than the resonance size but the frequency is higher causing the velocity gradient to increase and have a maximum at a higher frequency. When the frequency is further increased, the bubble oscillation dramatically decreases and this makes the velocity gradient drop back down.
The circumferential stress in Fig. 11 changes its behaviour depending on the acoustic frequency and vessel stiffness. There is an increasing trend on this stress versus frequency, which could be explained by more pressure build-up. As the rigidity increases the location of the local minima and the maximum peak shifts towards higher frequencies. At the same time, below 1.5 MHz circumferential stress increases with vessel rigidity, and above 2.5 MHz an inverse trend is obtained. It is interesting to note that the largest variation in circumferential stress versus acoustic frequency happens for the softest vessel (i.e. a 2 MPa vessel). This complicated behaviour of the circumferential stress explains the need for the numerical simulation in order to understand the physical phenomena.
In Figures 13 and 14, the larger values of shear stress were obtained when the acoustic frequency was high and rv/r0 was low. The circumferential stress was highest when the bubble wall was closer to the vessel wall. However, in larger vessels since a fixed-size bubble expands more the circumferential stress rises again. In Figure 15 the largest shear stress values are obtained at the higher acoustic frequency and lower rv/r0 values.
Asymmetrical bubble oscillation was also considered for an off-center bubble (Fig. 16). When the bubble is located closer to one side of the wall it forms a mushroom shape (the closest point to the wall on the bubble oscillates with lowest amplitude). This finding is consistent with the experimental observation of bubbles oscillating closer to one boundary (Brujan et al 2001 and Chen et al 2011a). An off-center bubble applied the maximum wall stresses at zero degrees where the bubble was closest to the vessel wall (Fig. 17).
Since the asymmetrical bubble simulation was computationally expensive, symmetrical bubble oscillation were performed for most of the results. The bubble radius of the symmetrical model (in which the fluid pressure is integrated over the bubble surface) is analogous to an equivalent radius. This equivalent radius might be larger than asymmetrical bubble expansion radius in r direction (semiminor length of an ellipse) since there is more damping in the r direction. Therefore the results might have been overestimated specially in the regimes with larger bubbles compared to the vessel size, higher acoustic pressure and stiffer vessels. Nevertheless the results are still valid to give an estimate for the order of magnitude of exerted stresses.
The spherical symmetry bubble assumption deviates from reality when the bubble is not in the middle and center of the vessel or the vessel to bubble size ratio is small or the acoustic pressure amplitude is high or the vessel is very stiff. On the other hand, an encapsulated bubble due to its shell effects (especially the shell elasticity) is forced to remain spherical. Caskey et al experimentally observed lipid-shelled bubbles inside ex vivo microvessels. They observed a 1.7 μm bubble within a 13 μm diameter vessel at 0.8 MPa acoustic pressure and 1 MHz acoustic frequency oscillated spherically. In this experiment the vessel to bubble ratio is high (where there is less confinement on the bubble) but the acoustic pressure was high too (which causes the bubble to oscillate asymmetrically). Experimental observations from Chen et al (Fig. 4a of reference) suggests that a bubble located slightly off-centre within a 22 μm radius vessel spherically expends to 9 μm radius at 2.8 MPa and 1 MHz (Chen et al 2011). Furthermore, the asymmetrical simulation of a gas bubble with a vessel to bubble radius ratio as low as 1.1 at 2 MPa (Fig. 5 of reference) shows that the bubble expands with a slight aberration of sphericity (Ye and Bull 2006).
A comparison between a spherical symmetric and asymmetrical bubble models inside a rigid vessel revealed that the shear and circumferential stress variations are 0.3% and 1% respectively (E=100 MPa, P0 =261 kPa, f = 1 MHz, R0 = 2 μm, rv = 5 μm). For a large bubble within a vessel, the stress variations were 3% and 12% for shear and circumferential stress respectively (E=5 MPa, P0 =261 kPa, f = 3.25 MHz, R0 = 4 μm, rv = 5 μm). Therefore, the spherical symmetric bubble model holds for the values investigated in this work with higher sensitivity to vessel/bubble ratio and less sensitivity to the vessel rigidity. When compared with asymmetrical model amongst the parameters used in this work, the spherical symmetry model predicted the shear and circumferential stresses with a maximum variation of 3% and 12% respectively. However, when combing all the parameters (this combination is not shown in the manuscript) in an extreme case (i.e. for stiffer vessels, smaller vessel to bubble ratios and higher pressures) the bubble deviates from the spherical shape and the results are over estimated. Within the parameters used in this study, a simulation was performed to represent an extreme case that jeopardizes the spherical symmetry assumption. In this simulation, a 4 μm bubble inside a rigid vessel (E=100 MPa) exited at 3.25 MHz and 680 kPa was considered with both spherical symmetry bubble model and asymmetrical model. As the result, the shear and circumferential stresses in asymmetrical bubble model were 31% and 27% less than those stresses calculated in spherical symmetric bubble model. Thus the stress values of a large spherical symmetric bubble inside a rigid vessel at high acoustic pressure is overestimated but still in the same order of magnitude as the asymmetrical bubble. Furthermore, most of our results were obtained at 2.5 P0 (261 kPa) acoustic pressure. When the two spherical symmetric versus asymmetrical bubble models are compared at this pressure (261 kPa), the difference of shear and circumferential stresses between the two models were 0.4% and 4% respectively (E=5 MPa, P0 =261 kPa, f = 1 MHz, R0 = 2 μm, rv = 5 μm).
There are several situations where highest stresses are achieved when acoustical parameters, bubble size, vessel size, vessel rigidity or bubble location is changed. From the results presented here, the highest stress on the vessel wall is achieved when the bubble is located inside a softer vessel and excited at frequencies above 2.5 MHz, or inside a more rigid vessel when excited at below 1.5 MHz. For example, a 2 μm bubble inside a completely rigid wall at 1 MHz induces large circumferential stresses of 1.189 MPa which exceed the vascular strength (Di Martino et al 2006). When bubbles are driven at above resonance frequencies stresses peak, and when the acoustic pressure is increased the stresses increase as well. Also, when the bubble or vessel radius is changed, large shear stress values are achieved at larger frequencies and lower rv/r0 values. When the vessel/bubble ratio is lower the circumferential stress is larger. The stresses induced on the vessel wall closer to an off-center bubble are significantly larger than those produced from the same bubble in the vessel center. Shear stress has the largest peak in a viscoelastic vessel. In the literature, there is a lack of data on experimental shear stress measurements from microbubbles inside micron scale tubes due to the difficult nature of this type of experiments.
It is worth noting that the physiological shear induced on the vessel wall by the flowing blood in the cardiovascular system is about 1 Pa (Rooney 1970). The vessel wall circumferential strength has been reported to be 0.8 MPa for abdominal aortic aneurysm wall tissue (Di Martino et al 2006) and 2.4 MPa for cerebral arteries (Rowe et al 2003). In general, the tensile strength of vessels varies between about 0.46–3.6 MPa (Rowe et al 2003, Yamada and Evans 1970, Snowhill and Silver 2005 ). For instance in Fig. 12c the circumferential stresses pass the minimum value for the vascular strength (0.46 MPa) and vessel rupture could occur.
We performed two simulations to relate the experimental studies to our numerical model. In order to quantify the stresses induced in the study by Hynynen et al (Hynynen et al 2006), which resulted in the BBB disruption of New Zealand White rabbits with a threshold of 0.2 MPa, an Optison™ microbubble (r0=2.25 μm, χ=0.26 N/m, κs=8.10−8 kg/s (Morgan et al 2000)) was simulated inside a 3 μm vessel (Herrlinger et al 1974) (E = 0.5 MPa) using 260 kHz and 0.2 MPa for the acoustic frequency and pressure respectively. From the results of this simulation the calculated maximum shear and circumferential stress on the vessel wall were 7.1 kPa and 78.6 kPa respectively. Another simulation was performed to emulate the study done by Skyba et al in which they reported microvessel disruption in rat spinotrapezius muscle using Optison™ microbubbles (Skyba et al 1998). Rupture sites were observed from their lowest pressure used (0.61 MPa). A 2.25 μm Optison™ bubble (χ =0.26 N/m, κs=8.10−8 kg/s) was simulated inside a 4.25 μm viscoelastic vessel (Skalak and Schmid-Schönbein 1986) using 2.3 MHz and 0.61 kPa as the acoustic frequency and pressure respectively. The maximum shear stress calculated from this simulation was 14.3 kPa and the circumferential stress was 168 kPa. The stresses calculated in the latter simulation (which could cause a microvessel disruption) are approximately two times larger than those in the former simulation (where the blood brain barrier opening could occur).
In this work the acoustic pressure was directly applied on the bubble surface and it was assumed that initial pressure inside the fluid and at the vessel ends were constant: Po. In reality not only the bubble wall but also the fluid and vessel are subjected to the acoustic pressure (which was ignored in this work). Since for these low pressure amplitudes the ultrasound alone has a small effect on the vessel wall movement (this has been tested in another set of simulations which is not shown here and the difference between the resulting stresses are less than 1%), this factor was eliminated in this work to save computational time. The circumferential stress, in the case of oscillating pressure everywhere on the vessel, could be calculated using equation (4), but instead of Po, Po + Pa sin(2πft) should be substituted.
The vessel wall properties used here were for stationary or low frequency vessel responses and the high frequency properties might be different. In fact, Holzapfel et al suggested that a vessel behaves with its stiffest response at high frequencies (Holzapfel et al 2002). The approach in this model gives the opportunity to study an asymmetrical bubble oscillation close to a red blood cell, two or more bubble interactions and microbubbles in different geometries in future studies.
Figure 2.

Viscoelastic model of a generalized Maxwell equation, where E is the Young’s modulus and η is the vessel viscosity.
Acknowledgments
The authors would like to thank Drs. Peter Burns and David Steinman for helpful discussions. Support for this work was provided by the Terry Fox Foundation, National Institutes of Health under grant no. EB003268, and the Canada Research Chair Program as well as Ontario Graduate Scholarships in Science and Technology (OGSST).
References
- Bao S, Thrall BD, Gies RA, Miller DL. In vivo transfection of melanoma cells by lithotripter shock waves. Cancer Research. 1998;58:219–221. [PubMed] [Google Scholar]
- Becher H, Burns PN. Handbook of contrast echocardiography : left ventrical function and myocardial perfusion. Springer Verlag; 2000. [Google Scholar]
- Brujan EA, Nahen K, Schmidt P, Vogel A. Dynamics of laser-induced cavitation bubbles near an elastic boundary. J Fluid Mech. 2001;433:251–281. [Google Scholar]
- Caskey CF, Kruse DE, Dayton PA, Kitano TK, Ferrara KW. Microbubble oscillation in tubes with diameters of 12, 25, and 195 microns. Appl Phys Lett. 2006;88:033902. [Google Scholar]
- Chen H, Kreider W, Brayman AA, Bailey MR, Matula TJ. Blood Vessel Deformations on Microsecond Time Scales by Ultrasonic Cavitation. Physical Review Letters. 2011a;106:034301. doi: 10.1103/PhysRevLett.106.034301. [DOI] [PMC free article] [PubMed] [Google Scholar]
- Chen H, Brayman AA, Kreider W, Bailey MR, Matula TJ. Observations of translation and jetting of ultrasound-activated microbubbles in mesenteric microvessels. Ultrasound In Med & Biol. 2011b doi: 10.1016/j.ultrasmedbio.2011.09.013. [DOI] [PMC free article] [PubMed] [Google Scholar]
- Christensen RM. Theory of viscoelasticity : an introduction. New York: Academic Press; 1982. [Google Scholar]
- Clarke PR, Hill CR. Physical and Chemical Aspects of Ultrasonic Disruption of Cells. Journal of Acoustical Society of America. 1970;47:649–653. doi: 10.1121/1.1911940. [DOI] [PubMed] [Google Scholar]
- Currie IG. Fundamental Mechanics of Fluids. New York: Marcel Dekker; 1993. [Google Scholar]
- de Jong N, Cornet R, Lancée CT. Higher harmonics of vibrating gas filled microspheres. Part one: simulations. Ultrasonics. 1994;32:447–453. [Google Scholar]
- Di Martino ES, Bohra A, Vande Geest JP, Gupta N, Makaroun MS, Vorp DA. Biomechanical properties of ruptured versus electively repaired abdominal aortic aneurysm wall tissue. Journal of Vascular Surgery. 2006;43:570–576. doi: 10.1016/j.jvs.2005.10.072. [DOI] [PubMed] [Google Scholar]
- Dintenfass L. Inversion of the Fahraeus–Lindqvist phenomenon in blood flow through capillaries of diminishing radius. Nature. 1967;215:1099–1100. doi: 10.1038/2151099a0. [DOI] [PubMed] [Google Scholar]
- Donea J, Huerta A, Ponthot J, Rodríguez-Ferran A. Arbitrary Lagrangian-Eulerian methods. New York: John Wiley & Sons; 2004. [Google Scholar]
- Duck FA. Physical properties of tissue : a comprehensive reference book. London: Academic Press; 1990. [Google Scholar]
- Gao F, Hu Y, Hu H. Asymmetrical oscillation of a bubble confined inside a micro pseudoelastic blood vessel and the corresponding vessel wall stresses. International Journal of Solids and Structures. 2007;44:7197–7212. [Google Scholar]
- Garbin V, Cojoc D, Ferrari E, Di Fabrizio E, Overvelde MLJ, van der Meer SM, de Jong N, Lohse D, Versluis M. Changes in microbubble dynamics near a boundary revealed by combined optical micromanipulation and high-speed imaging. Applied Physics Letters. 2007a;90:114103. [Google Scholar]
- Garbin V, Dollet B, Overvelde M, de Jong N, Lohse D, Versluis M, Cojoc D, Ferrari E, Fabrizio E. Coupled dynamics of an isolated UCA microbubble pair. IEEE Ultrasonics Symposium Proceedings. 2007b;2:757–760. [Google Scholar]
- Goldberg BB, Raichlen JS, Forsberg F. Ultrasound contrast agents: basic principles and clinical applications. London, England: Martin Dunitz; 2001. [Google Scholar]
- Herrlinger H, Anzil AP, Blinzinger K, Kronski D. Endothelial microtubular bodies in human brain capillaries and venules. Journal of Anatomy. 1974;118:205–209. [PMC free article] [PubMed] [Google Scholar]
- Holzapfel GA, Gasser TC, Stadler M. A structural model for the viscoelastic behavior of arterial walls: Continuum formulation and finite element analysis. European Journal of Mechanics. 2002;21:441–463. [Google Scholar]
- Hynynen K, McDannold N, Vykhodtseva N, Jolesz FA. Noninvasive MR imaging-guided focal opening of the blood-brain barrier in rabbits. Radiology. 2001;220:640–646. doi: 10.1148/radiol.2202001804. [DOI] [PubMed] [Google Scholar]
- Hynynen K, McDannold N, Vykhodtseva N, Raymond S, Weissleder R, Jolesz FA, Sheikov N. Focal disruption of the blood-brain barrier due to 260-kHz ultrasound bursts: a method for molecular imaging and targeted drug delivery. Journal of Neurosurgery. 2006;105:445–454. doi: 10.3171/jns.2006.105.3.445. [DOI] [PubMed] [Google Scholar]
- Kassab SG, Le KN, Fung YC. A hemodynamic analysis of coronary capillary blood flow based on anatomic and distensibility data. Am J Physiol Heart Circ Physiol. 1999;277:H2158–H2166. doi: 10.1152/ajpheart.1999.277.6.H2158. [DOI] [PubMed] [Google Scholar]
- Klotz AR, Lindvere L, Stefanovic B, Hynynen K. Temperature change near microbubbles within a capillary network during focused ultrasound. Phys Med Biol. 2010;55:1549–61. doi: 10.1088/0031-9155/55/6/001. [DOI] [PMC free article] [PubMed] [Google Scholar]
- Krasovitski B, Kimmel E. Shear stress induced by a gas bubble pulsating in an ultrasonic field near a wall. IEEE Trans Ultrason Ferroelectr Freq Control. 2004;51:973–979. doi: 10.1109/tuffc.2004.1324401. [DOI] [PubMed] [Google Scholar]
- Lee J, Schmid-Schönbein GW. Biomechanics of skeletal muscle capillaries: hemodynamic resistance, endothelial distensibility, and pseudopod formation. Annals of Biomedical Engineering. 1995;23:226–246. doi: 10.1007/BF02584425. [DOI] [PubMed] [Google Scholar]
- Leighton TG. The acoustic bubble. Academic Press; New York: 1994. [Google Scholar]
- Lewin PA, Bjorno L. Acoustically induced shear stresses in the vicinity of micro-bubbles in tissue. J Acoust Soc Am. 1982;71:728–734. [Google Scholar]
- Martynov S, Stride E, Saffari N. The natural frequencies of microbubble oscillation in elastic vessels. J Acoust Soc Am. 2009;126:2963–72. doi: 10.1121/1.3243292. [DOI] [PubMed] [Google Scholar]
- Miao H, Gracewski SM, Dalecki D. Ultrasonic excitation of a bubble inside a deformable tube: Implications for ultrasonically induced hemorrhage. J Acoust Soc Am. 2008;124:2374–2384. doi: 10.1121/1.2967488. [DOI] [PMC free article] [PubMed] [Google Scholar]
- Miller DL, Williams AR, Morris JE, Chrisler WB. Sonoporation of erythrocytes by lithotripter shockwaves in vitro. Ultrasonics. 1998;36:947–952. doi: 10.1016/s0041-624x(98)00017-1. [DOI] [PubMed] [Google Scholar]
- Morgan KE, Allen JS, Dayton PA, Chomas JE, Klibanov AL, Ferrara KW. Experimental and theoretical evaluation of microbubble behavior: Effect of transmitted phase and bubble size. Ultrasonics Ferroelect Freq Control. 2000;47:1494–509. doi: 10.1109/58.883539. [DOI] [PubMed] [Google Scholar]
- Mukundakrishnan K, Ayyaswamy PS, Eckmann DM. Bubble motion in a blood vessel: shear stress induced endothelial cell injury. Journal of Biomechanical Engineering. 2009;131:074516. doi: 10.1115/1.3153310. [DOI] [PubMed] [Google Scholar]
- Nomura T. ALE finite element computations of fluid-structure interaction problems. Computer Methods in Applied Mechanics and Engineering. 1994;112:291–308. [Google Scholar]
- Nyborg WL. Acoustic streaming near a boundary. J Acoust Soc Am. 1958;30(4):329–339. [Google Scholar]
- Õguz HN, Prosperetti A. The natural frequency of oscillation of gas bubbles in tubes. J Acoust Soc Am. 1998;103:3301–3308. [Google Scholar]
- Qin S, Ferrara KQ. Acoustic response of compliable microvessels containing ultrasound contrast agents. Phys Med Biol. 2006;51:5065–5088. doi: 10.1088/0031-9155/51/20/001. [DOI] [PMC free article] [PubMed] [Google Scholar]
- Qin S, Ferrara KQ. The natural frequency of nonlinear oscillation of ultrasound contrast agents in microvessels. Ultrasound in Med & Biol. 2007;33:1140–1148. doi: 10.1016/j.ultrasmedbio.2006.12.009. [DOI] [PMC free article] [PubMed] [Google Scholar]
- Rooney JA. Hemolysis near an ultrasonically pulsating gas bubble. Science. 1970;169:869–871. doi: 10.1126/science.169.3948.869. [DOI] [PubMed] [Google Scholar]
- Rowe AJ, Finlay HM, Canham PB. Collagen biomechanics in cerebral arteries and bifurcations assessed by polarizing microscopy. J Vasc Res. 2003;40:406–415. doi: 10.1159/000072831. [DOI] [PubMed] [Google Scholar]
- Standring S. Gray’s anatomy : the anatomical basis of clinical practice. Elsevier Churchill Livingstone; 2005. [Google Scholar]
- Sassaroli E, Hynynen K. Resonance frequency of microbubbles in small blood vessels: a numerical study. Phys Med Biol. 2005;50:5293–5305. doi: 10.1088/0031-9155/50/22/006. [DOI] [PubMed] [Google Scholar]
- Skalak TC, Schmid-Schönbein GW. Viscoelastic properties of microvessels in rat spinotrapezius muscle. J Biomech Eng. 1986;108:193–200. doi: 10.1115/1.3138602. [DOI] [PubMed] [Google Scholar]
- Skyba DM, Price RJ, Linka AZ, Skalak TC, Kaul S. Direct in vivo visualization of intravascular destruction of microbubbles by ultrasound and its local effects on tissue. Circulation. 1998;98:290–293. doi: 10.1161/01.cir.98.4.290. [DOI] [PubMed] [Google Scholar]
- Smaje LH, Fraser PA, Clough G. The distensibility of single capillaries and venules in the cat mesentery. Microvasc Res. 1980;20:358–370. doi: 10.1016/0026-2862(80)90064-3. [DOI] [PubMed] [Google Scholar]
- Snowhill PB, Silver FH. A mechanical model of porcine vascular tissues-Part II: Stress–strain and mechanical properties of juvenile porcine blood vessels. Cardiovascular Engineering. 2005;5:157–169. [Google Scholar]
- Srivastava AK, Gope PC. Strength of Materials. Prentice-Hall of India; 2007. [Google Scholar]
- van der Meer SM, Dollet B, Voormolen MM, Chin CT, Bouakaz A, de Jong N, Versluis M, Lohse D. Microbubble spectroscopy of ultrasound contrast agents. J Acoust Soc Am. 2007;121:648–656. doi: 10.1121/1.2390673. [DOI] [PubMed] [Google Scholar]
- VanBavel E. Effects of shear stress on endothelial cells: Possible relevance for ultrasound applications. Progress in Biophysics and Molecular Biology. 2007;93:374–383. doi: 10.1016/j.pbiomolbio.2006.07.017. [DOI] [PubMed] [Google Scholar]
- Whitmore RL. The flow behaviour of blood in the circulation. Nature. 1967;215:123–126. doi: 10.1038/215123a0. [DOI] [PubMed] [Google Scholar]
- Wu J. Theoretical study on shear stress generated by microstreaming surrounding contrast agents attached to living cells. Ultrasound in Med & Biol. 2002;28:125–129. doi: 10.1016/s0301-5629(01)00497-5. [DOI] [PubMed] [Google Scholar]
- Yamada H, Evans FG. Strength of biological materials. Williams and Wilkins; Baltimore, MD: 1970. [Google Scholar]
- Ye T, Bull JL. Direct numerical simulations of micro-bubble expansion in gas embolotherapy. J Biomech Eng. 2004;126:745–759. doi: 10.1115/1.1824131. [DOI] [PubMed] [Google Scholar]
- Ye T, Bull JL. Microbubble expansion in a flexible tube. J Biomed Eng. 2006;128:554–563. doi: 10.1115/1.2206200. [DOI] [PubMed] [Google Scholar]
- Zhong P, Zhou Y, Zhu S. Dynamics of bubble oscillation in constrained media and mechanisms of vessel rupture in SWL. Ultrasound Med Biol. 2001;27:119–134. doi: 10.1016/s0301-5629(00)00322-7. [DOI] [PubMed] [Google Scholar]