Abstract
Purpose.
The mouse has become an important wound healing model with which to study corneal fibrosis, a frequent complication of refractive surgery. The aim of the current study was to quantify changes in stromal ultrastructure and light scatter that characterize fibrosis in mouse corneal debridement wounds.
Methods.
Epithelial debridement wounds, with and without removal of basement membrane, were produced in C57BL/6 mice. Corneal opacity was measured using optical coherence tomography, and collagen diameter and matrix order were quantified by x-ray scattering. Electron microscopy was used to visualize proteoglycans. Quantitative PCR (Q-PCR) measured mRNA transcript levels for several quiescent and fibrotic markers.
Results.
Epithelial debridement without basement membrane disruption produced a significant increase in matrix disorder at 8 weeks, but minimal corneal opacity. In contrast, basement membrane penetration led to increases in light scatter, matrix disorder, and collagen diameter, accompanied by the appearance of abnormally large proteoglycans in the subepithelial stroma. This group also demonstrated upregulation of several quiescent and fibrotic markers 2 to 4 weeks after wounding.
Conclusions.
Fibrotic corneal wound healing in mice involves extensive changes to collagen and proteoglycan ultrastructure, consistent with deposition of opaque scar tissue. Epithelial basement membrane penetration is a deciding factor determining the degree of ultrastructural changes and resulting opacity.
This study characterized the collagen and proteoglycan ultrastructural changes that underpin tissue opacity in mouse corneal debridement wounds. Evaluation of stromal gene expression also revealed new temporal aspects of keratan sulfate proteoglycan control during fibrosis.
Introduction
Injury repair in adult mammals is typified by the activation of a fibrotic response, in which rapidity of healing is often gained at the expense of restoration of tissue function. In the cornea, fibrotic repair poses specific problems in the form of tissue opacity arising from the disorganized nature of the extracellular matrix (ECM) initially deposited, as well as corneal distortion brought about by wound contraction as the fibrotic tissue subsequently remodels.1,2 Understanding the fibrotic corneal wound healing response is of significant interest, as fibrosis remains a frequent complication of some types of refractive surgery.3
The cornea lends itself particularly well to wound healing studies on account of its highly organized connective tissue architecture and cellular homogeneity. Approximately 90% of the corneal thickness is accounted for by a stroma of multiple, superimposed lamellae. Each lamella is composed of parallel collagen fibrils of remarkably uniform diameter and regular lateral separation. Corneal transparency depends upon the maintenance of diameter and short-range order within this fibrillar array,4 parameters that, in turn, are governed by the interaction of collagen with two groups of intervening small leucine-rich proteoglycans (SLRPs)—one containing chondroitin-dermatan sulfate (CS-DS) glycosaminoglycans and the other containing keratan sulfate (KS) glycosaminoglycans.5 Increased collagen fibril size and level of spatial disorder can be major causative factors behind the opacity of fibrotic corneal repair tissue.6,7
The cornea is bounded on the anterior side by a stratified squamous epithelium, which is separated from the underlying stroma by a basement membrane, the latter of submicron thickness in mice.8 Research has indicated that the integrity of the epithelial basement membrane influences the regenerative nature of the corneal wound healing response. In brief, injuries involving basement membrane penetration or disruption tend to elicit greater cell transformation from fibroblast to myofibroblast phenotype in the subjacent stroma, and subsequently a stronger fibrotic repair response, than those involving epithelial disruption or debridement alone.9–11
Much of our current understanding of corneal wounding healing has come from the study of experimental animal models. In recent years the availability of mutant and genetic knockout mice has provided researchers with the opportunity to selectively investigate the role that specific molecules play in corneal injury repair, and this has led to a burgeoning of interest in the mouse as a model for corneal wound healing.12–16 Much of the focus of previous studies of murine wound healing has been on the acute phase of healing. We understand little as to the long-term consequences of wounding in terms of disruption of the stromal ECM and how this affects light scatter. In order to address this, the authors have carried out an ultrastructural study of stromal changes that accompany the development of corneal opacity in mouse corneal debridement wounds, using a combination of x-ray scattering, optical coherence tomography, and transmission electron microscopy.
Methods
Animals and Tissue Harvesting
All animal procedures were performed in accordance with the ARVO statement on the Use of Animals in Ophthalmic and Vision Research, under protocols approved by the University of Pittsburgh IACUC. Epithelial debridement wounds were produced as previously described.12 In brief, mice were anesthetized by intraperitoneal injection of a mixture of ketamine (20 mg/kg) and xylazine (20 mg/kg). A drop of tetracaine hydrochloride 0.5% was applied to the cornea. The center of one cornea was marked by a 2-mm-diameter skin biopsy punch. Corneal epithelial debridement (EPI group) was produced using an Algerbrush II (The Alger Company, Lago Vista, TX).
For basement membrane (BM) removal, a second passage of the Algerbrush over the surface was made, applying increased pressure to remove the epithelial BM and a small amount of anterior stromal tissue (EPI/B group). Removal of the BM was confirmed using a biomicroscope, under which the BM appears reflective and stromal debridements yield a rough aspect. The effectiveness of this technique for full removal of the BM was confirmed using histology with staining of laminin (Fig. 1). After wounding, each eye was treated with a single drop of Ophthalmic Gentamicin solution. Contralateral (left) corneas of the EPI/B group were unwounded and served as untreated controls (CTRL group).
Figure 1.
Laminin staining showing integrity of epithelial basement membrane (arrows). (A) shows a section of normal mouse cornea (CTRL group) displaying continuous laminin staining of basement membrane. (B) shows a section 48 hours after corneal epithelial debridement with an intact basement membrane (EPI group). (C) shows a section 48 hours after corneal wounding with basement membrane removal (EPI/B group). Note inflammatory cell influx. (D) shows a section 2 months after corneal epithelial and basement membrane debridement (EPI/B group). DAPI stains nuclei as blue. Bars: 50 μm.
Optical Coherence Tomography
After 8 weeks, optical coherence tomography (OCT) was performed to quantify corneal light scatter. Images were captured using a Bioptigen SD-OCT (Bioptigen, Research Triangle Park, NC) with axial resolution of 4 μm and A-scan acquisition rate of 20 kHz 3.5 × 3.5 mm 250 × 250 A-scans. Image processing and analysis was conducted with MetaMorph 7.7.3 (Molecular Devices, Inc., Sunnyvale, CA). The images were processed to isolate the entire cornea, and the epithelium was then removed by running a morphological dilation on just the epithelial side of the cornea. Normal corneas were used to set the threshold cutoff on the remaining stromal area, and that threshold was applied to all image stacks. The remaining scar volume was calculated using the MetaMorph 4D viewer and exported into Excel (Microsoft Corp., Redmond, WA) for quantification. Following OCT, animals were immediately sacrificed and the corneas harvested, wrapped in Saran Wrap (SC Johnson, Racine, WI), and stored frozen at −80°C for ultrastructural analysis.
X-ray Scattering
Small-angle x-ray scattering17 (SAXS) was carried out on Beamline I22 at the Diamond Light Source (Didcot, UK), using an x-ray beam with wavelength 0.1 nm and cross section measuring 0.25 mm (horizontal) × 0.25 mm (vertical) at the specimen. Prior to x-ray exposure, each specimen (in Saran Wrap) was thawed and carefully examined under a light microscope, and any displaying evidence of major tissue wrinkles or folds that might significantly affect the SAXS results were excluded. The resulting numbers of specimens for SAXS were CTRL group n = 4, EPI group n = 4, and EPI/B group n = 6. For data collection, individual wrapped corneas were placed, superior side uppermost, into sealed Perspex (Lucite Group Ltd, Southampton, UK) chambers with Mylar (DuPont-Teijin, Middlesbrough, UK) windows. This group's previous SAXS work has shown that the hydration of mouse corneas examined in this way does not significantly change, even after several minutes of x-ray exposure.18,19 Specimen alignment was achieved by an initial exposure of x-ray–sensitive film placed in the specimen holder to locate the incident beam position. SAXS patterns, each resulting from an x-ray exposure of 5 seconds, were collected at 0.25-mm (horizontal) × 0.25-mm (vertical) intervals covering the whole of each cornea, and were recorded electronically on an x-ray detector placed 6 m behind the specimen position.
Corneal SAXS patterns contain quantitative information about the average separation and diameter of collagen fibrils within the volume of stroma traversed by the x-ray beam.17 The radial scatter distribution of the pattern is the product of scattering from an individual fibril F(K), termed the fibril transform, and scatter arising from the relative fibril positions G(K), termed the interference function, plus an additional background of noncollagen scatter, B(K)17:
where K is the scattering vector, whose magnitude is defined in terms of the x-ray wavelength, λ, and scattering angle 2θ:
Approximating collagen fibrils as infinitely long cylinders, the fibril transform is related to the fibril radius, rf, by:
where J1 is a first-order Bessel function.20
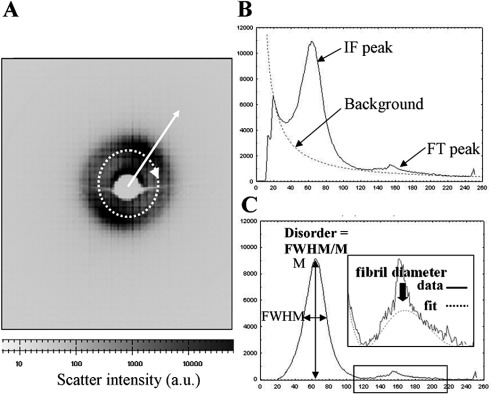
For each SAXS pattern (Fig. 2A), a radial scatter profile (Fig. 2B) was extracted using a combination of Fit2d (ESRF, Grenoble, France) and Excel (Microsoft, Reading, UK) software. A power-law background function, representing B(K), was then fitted (Fig. 2B) and subtracted using in-house software based on Python 2.6 (Python Software Foundation, Wolfeboro Falls, NH). The same program was then used to fit a fibril transform function (Fig. 2C), of the form of equation 3. The average collagen fibril diameter, 2rf, was then calculated from the first subsidiary maximum position of F(Krf) (Fig. 2C, solid arrow), which occurs at Krf = 5.14.17 In this region (and at higher K), the contribution of G(K) is negligible21 and could therefore be ignored. Calibration was achieved using the 67-nm axial period reflection from a SAXS pattern of hydrated rat tail tendon. The fibril transform was then divided out to leave the interference function peak, G(K), whose shape may be analyzed to give a relative measure of the level of spatial order within the collagen fibril array.22 Matrix disorder was expressed as the ratio of the peak's full width at half maximum (FWHM) to its maximum value (M), as shown in Figure 2C.
Figure 2.
(A) SAXS pattern from mouse cornea. The collagen interference function peak is visible. A circular integration (dotted arrow) was performed and the resulting integrated intensity extracted in the radial direction (solid arrow). (B) Resulting intensity distribution. A background scatter function was fitted to extract the collagen interference function (IF) and fibril transform (FT) peaks. (C) The shape and position of the IF and FT peaks were used to determine the relative amount of collagen matrix disorder and the average collagen fibril diameter, respectively. The sharp third-order peak from the collagen 65-nm axial period17 is also visible superimposed on the FT peak in (B) and (C) and may be ignored in the data analysis.
Electron Microscopy
Following x-ray scattering, proteoglycan ultrastructure was examined using transmission electron microscopy. Tissue blocks were dissected from the central cornea and incubated overnight at 4°C in 2.5% glutaraldehyde fixative containing 0.05% cuprolinic blue.23 Contrast enhancement of stained proteoglycan–dye complexes was achieved by washes, first in aqueous (3 × 10 min) and then in 1:1 aqueous/ethanolic (15 min) solutions containing 0.5% sodium tungstate. Specimens were then dehydrated in an ascending series of ethanol concentrations and subjected to 30-minute propylene oxide and 60-minute 1:1 propylene oxide/Araldite resin incubations prior to resin embedding. Ultrathin sections (∼100 nm thick) were prepared, collected on square-mesh copper grids (3.05 mm), and stained with phosphotungstic acid (30 s) and uranyl acetate (12 min) at room temperature, before examination in a Jeol 1010 transmission electron microscope (Jeol, Welwyn Garden City, UK).
Quantitative PCR
At 2 and 4 weeks, three animals from each group were sacrificed and corneas were removed for quantitative PCR (Q-PCR). The tissue was stored in RNAlater (Invitrogen, Austin, TX); the epithelium was removed, and three stromas with endothelium were pooled and extracted in RLT buffer (Qiagen, Valencia, CA) followed by isolation of total RNA using the RNeasy mini kit (Qiagen), treated with DNase I (Invitrogen), and concentrated by alcohol precipitation. Complementary DNA was transcribed from the RNA using SuperScript II reverse transcriptase (Invitrogen) in accordance with recommendations of the manufacturer. Q-PCR of cDNA was performed using SYBR Green reagent (Applied Biosystems, Carlsbad, CA) as previously described.24 Primer sequences were obtained from qPrimerDepot (http://mouseprimerdepot.nci.nih.gov/) with the sequences shown in Supplementary Table S1 (see http://www.iovs.org/content/53/6/2786/suppl/DC1). Amplification of 18S rRNA was performed for each cDNA (in triplicate) for normalization of RNA content. Relative mRNA abundance was calculated as the Ct for amplification of a gene-specific cDNA minus the average Ct for 18S expressed as a power of 2 (2–ΔΔCt). Three individual gene-specific values thus calculated were averaged to obtain mean ± SD.
Results
Corneal Wounding
Mouse corneal epithelial wounds heal within 2 to 3 days, rapidly reestablishing barrier function and corneal hydration.25 Epithelial debridement leaving the BM intact reportedly leaves the cornea transparent, whereas disruption of the epithelial BM, particularly one that generates a rough surface on the stroma, heals with anterior stromal haze.26 The status of the ECM after healing of these two wound types has not been evaluated. The present authors compared the two wound types using a manual procedure for epithelial removal that left the BM intact, as well as a deeper debridement procedure that removed epithelium, BM, and a small portion of anterior stroma. Laminin staining of the tissue 48 hours after wounding showed the BM intact after epithelial debridement (Fig. 1B), whereas the BM was completely removed after the deeper debridement (Fig. 1C). Two months after BM removal, the epithelial layer was re-established and BM re-formed, and the stroma appeared similar to that of nonwounded corneas (Fig. 1D).
Optical Coherence Tomography
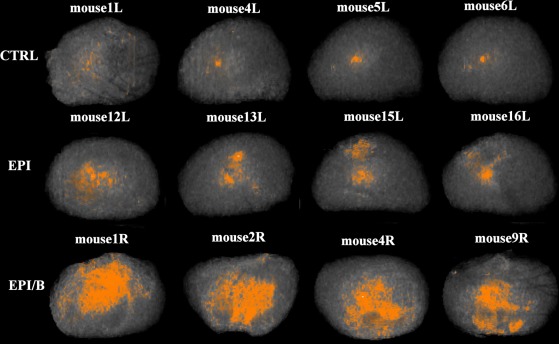
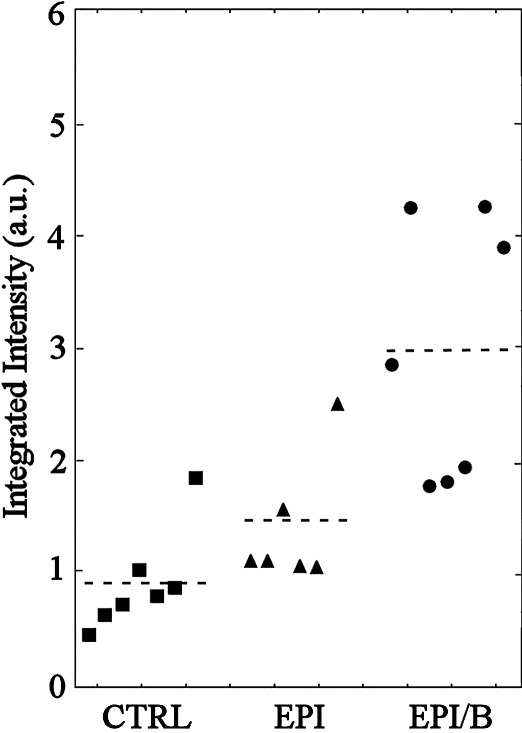
OCT has become a sensitive and powerful method for assessing corneal stromal haze,27 including in corneas from mice.28 When mouse eyes were scanned after healing, the cornea and sclera produced no reflected signal, but corneal scarring was readily visualized as haze (see Supplementary Video S1, http://www.iovs.org/content/53/6/2786/suppl/DC1). OCT images of stromas from four eyes of each experimental group are shown in Figure 3. Intensity of red coloration scales proportionately with stromal opacity (light scatter). Opacity was quantified by integrating the scatter intensity values for the isolated stroma of each cornea (Fig. 4). Light scatter was found to be significantly elevated in the EPI/B (351% of control) group compared to uninjured controls, whereas in the EPI group it was not significantly different from control levels (Fig. 4 and Table 1). However, four of the eight samples in the EPI group exhibited light scatter values greater than the >95% confidence interval of the control population. This strongly suggests that some corneas wounded by epithelial debridement increased light scatter even if the group as a whole did not differ significantly from the control.
Figure 3.
OCT imaging of corneal opacities in four individual mouse corneas from each experimental group. Proportional light scatter is represented by intensity of red coloration in each image.
Figure 4.
Quantification of corneal opacity detected by OCT. Integrated light scatter intensity is expressed per cornea (symbols). Broken lines denote group averages.
Table 1.
Statistical Comparison of Integrated Light Scatter between Experimental Groups by Single-Factor ANOVA
|
EPI |
EPI/B |
|
| CTRL | ** | |
| EPI | * |
Significance was tested at *P < 0.05 and **P < 0.01.
X-ray Scattering
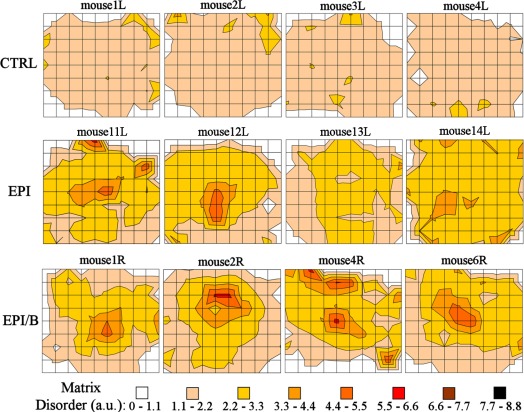
Contour maps of relative matrix disorder across four specimens from each experimental group, as determined by SAXS, are shown in Figure 5. Consistently low levels of matrix disorder were measured across all CTRL corneas, with notable increases being mainly limited to regions of the outer peripheral cornea and limbus (Fig. 5). This is consistent with the normal pattern of collagen fibril polydispersity across the cornea, where increasing numbers of larger, more widely spaced fibrils are found with increasing proximity to the sclera.19,29–31 It should be noted that in these outer corneal regions, small discrepancies in measurement position between specimens (maximum estimated interspecimen error: ±0.25 mm) will translate into large differences in measured disorder. For this reason the outermost data were excluded from subsequent averaging calculations.
Figure 5.
Contour maps of matrix disorder across four individual mouse corneas from each experimental group. Grid element: 0.25 mm.
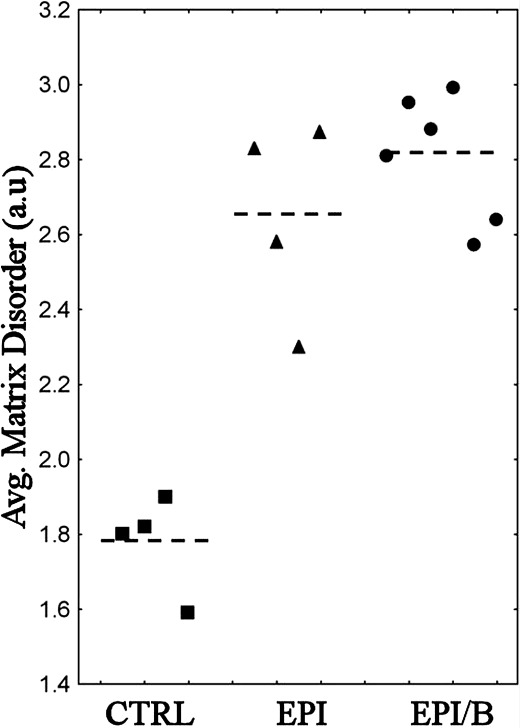
All wounded groups showed increased matrix disorder compared to controls, with the more severely disordered regions being most consistently observed in the EPI/B group (Fig. 5). To further quantify the results, matrix disorder was averaged for individual specimens. Calculation of average disorder was limited to the central 1.5 mm × 1.5 mm (36 values per cornea). This ensured that the majority of the wound area was included, even for noncentralized wounds (e.g. mouse 2R in Fig. 5) while the outermost data were still excluded on the basis of the aforementioned criteria. Average matrix disorder per cornea is shown in Figure 6. Matrix disorder was found to be significantly (P < 0.01) elevated in the EPI (49%) and EPI/B (58%) groups compared to uninjured controls (Fig. 6 and Table 2).
Figure 6.
Average matrix disorder within central 1.5 mm × 1.5 mm, expressed per cornea (symbols) and experimental group (broken lines).
Table 2.
Statistical Comparison of Matrix Disorder between Experimental Groups by Single-Factor ANOVA
|
EPI (n = 144) |
EPI/B (n = 216) |
|
| CTRL (n = 144) | ** | ** |
| EPI (n = 144) |
Individual disorder values within the central 1.5 × 1.5-mm region (n = 36 per cornea) were pooled for each group. Significance was tested at *P < 0.05 and **P < 0.01 using n = 144.
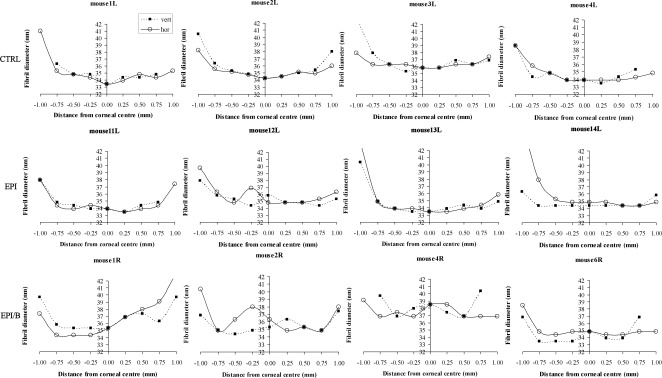
Figure 7 presents SAXS fibril diameter measurements along vertical and horizontal scans for four individual specimens from each experimental group. Similar to what is seen in other species,29–31 the unwounded mouse cornea is typified by a “U-shaped” fibril diameter distribution, in which diameter is lowest at the corneal center and increases rapidly near the limbus (Fig. 7, CTRL). Mouse 3L featured consistently larger (+2 nm) fibrils than the rest of the CTRL specimens, although the general shape of its diameter distribution was consistent with the remainder of the group. In general, debridement of the epithelium without basement membrane disruption had minimal effect on fibril diameter distribution. The exception was mouse 12L, which displayed a localized increase in fibril diameter near the corneal center (Fig. 7, EPI). In contrast, debridement wounds in which the basement membrane was disrupted resulted in more widespread changes to the fibril diameter distribution, in which the U-shaped pattern that characterizes the unwounded cornea was altered. Regions of locally elevated fibril diameter were evident across the central 1.5-mm region in all specimens examined from the EPI/B group (Fig. 7). Mouse 4R displayed larger (+2 nm) fibrils in general compared to the remainder of the group.
Figure 7.
Fibril diameter as a function of distance from corneal center along vertical (filled squares) and horizontal (empty circles) directions, shown for four individual mouse corneas from each experimental group.
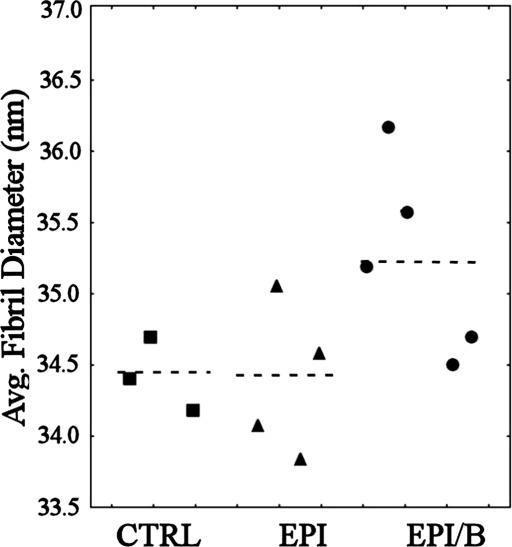
In order to further quantify the changes in fibril diameter due to wounding, the average fibril diameter was calculated for each specimen (Fig. 8). Mouse 3L and mouse 4R were excluded on the basis of Peirce's criterion, and the averaging was limited to the central 1.5 mm × 1.5 mm (12 values per cornea) so as to exclude the peripheral data where any discrepancy in spatial position between specimens would have a large effect on measured diameter. Average fibril diameter was found to be significantly elevated (0.6-0.8 nm) in the EPI/B group compared to both other groups (P < 0.01), while no significant difference (P > 0.05) was found between the CTRL and EPI groups (Fig. 8 and Table 3).
Figure 8.
Average fibril diameter within central 1.5 mm × 1.5 mm, expressed per cornea (symbols) and experimental group (broken lines). Mouse 3L and mouse 4R were excluded on the basis of Peirce's criterion.
Table 3.
Statistical Comparison of Fibril Diameter between Experimental Groups by Single-Factor ANOVA
|
EPI (n = 48) |
EPI/B (n = 60) |
|
| CTRL (n = 36) | ** | |
| EPI (n = 48) | ** |
Individual diameter values within the central 1.5 × 1.5-mm region (n = 12 per cornea) were pooled for each group. Significance was tested at *P < 0.05 and **P < 0.01, using n = 36. Mouse 3L and mouse 4R were excluded on the basis of Peirce's criterion.
Electron Microscopy
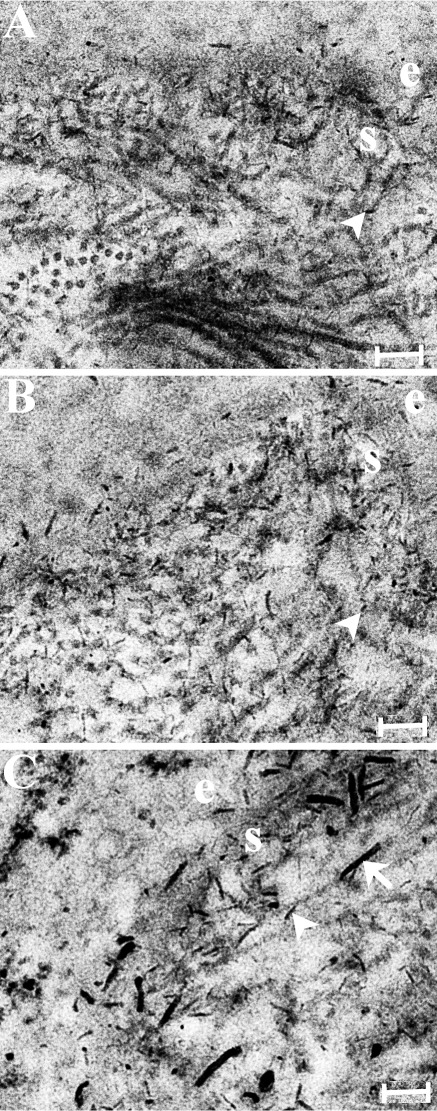
Figure 9 shows electron microscopy images from cuprolinic blue–stained ultrathin corneal sections from the three experimental groups. Proteoglycan–dye complexes were visible as thin, electron-dense filaments in all groups (Fig. 9, arrowheads). Corneas in which the basement membrane was disrupted displayed additional longer, thicker filaments in the subepithelial stroma (Fig. 9C, arrows).
Figure 9.
Transmission electron microscopy with cuprolinic blue staining for the three experimental groups: (A) uninjured control, (B) epithelial debridement only, (C) epithelial debridement with basement membrane disruption. Proteoglycan–dye complexes are visible as thin, electron-dense filaments (arrowheads). Corneas in which the basement membrane was disrupted displayed additional longer, thicker filaments in the subepithelial stroma (C, arrow). e, epithelium; s, stroma. Scale bar: 200 μm.
Quantitative PCR
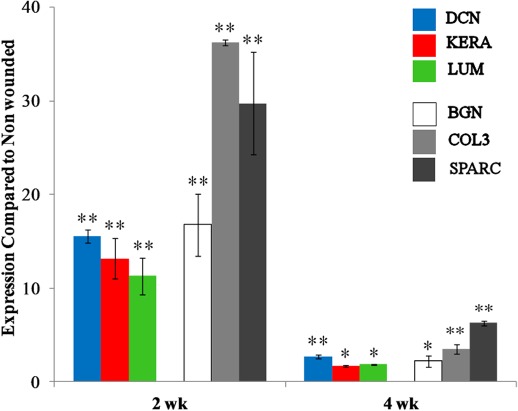
Figure 10 shows stromal gene expression as determined by Q-PCR. The results indicate significant upregulation of mRNA of the quiescent ECM proteins, decorin,32 keratocan,33 and lumican,34 as well as proteins previously associated with wound healing and fibrosis: collagen III35 and SPARC.36 Expression was greater at 2 weeks than at 4 weeks after wounding for all these genes.
Figure 10.
Gene expression of stromal proteins at 2 and 4 weeks after wounding in the EPI/B group, as measured by Q-PCR of mRNA: decorin (DCN), keratocan (KERA), lumican (LUM), biglycan (BGN), collagen III (COL3), and SPARC. Significance was tested at *P < 0.05 and **P < 0.01.
Discussion
This study quantified changes in stromal collagen ultrastructure and light scatter in the mouse cornea 8 weeks after epithelial debridement, both with and without disruption to the BM. An earlier study found stromal haze to be produced in mouse corneas when BM was disrupted, leaving an irregular surface.26 The current data confirm these results, showing that the haze accompanies a long-lasting change in stromal ECM organization. A significant increase in corneal light scatter was observed only when BM was disrupted (Figs. 3, 4), and this was accompanied by increased collagen fibril disorder (Figs. 5, 6) and diameter (Figs. 7, 8)—changes that are consistent with the formation of opaque corneal scar tissue.6,7 Moreover, proteoglycan morphology in the same specimens showed BM disruption in the mouse to correlate with the appearance of abnormally large stromal proteoglycan–dye filaments (Fig. 9). Similar large structures have been observed previously by the same method in rabbit37,38 and human39 corneal scars, and may contribute to fibril disorder by altering stromal hydration within the scar region.38
In contrast, epithelial debridement wounds in which the BM was left intact displayed no significant increase in light scatter overall (Figs. 3, 4). However, interestingly, this group did display increased collagen fibril disorder compared to uninjured controls (Figs. 5, 6). Superficial epithelial debridement has been shown to result in loss of keratocan and lumican expression for up to 12 weeks in mice.25 Therefore it is possible that such a disruption in proteoglycan expression might lead to alteration in stromal hydration and associated collagen disorder without the formation of an opaque fibrotic scar. Such a model is consistent with our observation that the epithelial debridement–only wounds had less of the large “scar-type” collagen fibrils (Figs. 7, 8) and proteoglycans (Fig. 9) in the stroma. Moreover, fibril spacing disorder compounded by the additional presence of larger-diameter scar-type fibrils, as observed in fibrosis, is predicted from modeling studies to result in significantly higher levels of light scatter compared to that resulting from hydration-driven disruption in fibril spacing alone.40
Our ultrastructural findings align well with the established view of the BM as a “fibrotic switch,” whose disruption shifts the balance from a regenerative to a more repair (fibrotic) type of healing response, consistent with previous research on cell activation and fibrotic marker expression in rabbits,9 rats,10 and mice.11 The mRNA expression of a number of stromal ECM components at 2 and 4 weeks after wounding had some unexpected results. At 2 weeks, mRNAs for normal stromal ECM proteins (decorin, lumican, keratocan) were markedly upregulated, and these levels decreased toward normal 4 weeks after wounding (Fig. 10). Keratocan and lumican mRNAs have previously been reported as downregulated in healing wounds. Lumican expression has been reported to decrease but keratocan remained unaffected in chicks,41 while downregulation of both keratocan and lumican has been demonstrated in rabbits42 and mice.25 It should be noted, however, that the earliest time point reported previously using mice was 6 weeks.25 Taken together, these results suggest that the temporal aspects of keratan sulfate proteoglycan control during wound healing in mice may be more complex than previously thought.
The upregulation of mRNA for collagen III35 and biglycan,43 as well as for the matricellular protein SPARC,36 followed a pattern similar to that of the proteoglycans—increased at 2 weeks and less so at 4 weeks (Fig. 10). This upregulation is consistent with a fibrotic response and fits well with the presence of light scattering and collagen fibril disruption in the stroma. The elevation of biglycan may be related to the presence of large proteoglycans at 8 weeks (Fig. 9), since this CS-DS proteoglycan is larger than decorin and is found only in pathological stroma.44 The rapid and transient nature of the response of these fibrotic markers, compared to the longer-term stability of the scar (>8 weeks according to the light scatter and ultrastructural data), suggests that the provisional scar matrix is deposited rapidly after closure of the wound, in the first 2 to 4 weeks.
In summary, this study has demonstrated that mechanical debridement of mouse epithelium in which the BM is removed results in a long-term nonvascularized fibrotic stromal scar. The scarring process involves rapid upregulation in expression of a number of well-recognized fibrotic ECM genes. Stromal collagen organization is disrupted, as determined by x-ray scattering, and proteoglycans show marked changes typical of corneal scars, as observed using transmission electron microscopy. Stromal transparency was reduced and light scatter increased as measured in real time by in vivo OCT. These changes closely mimic experimental scarring models developed in other animals such as rabbits, as well as scars characterized in human corneas. Unlike the primate, the mouse does not possess an anterior limiting lamina, and this makes the epithelial relationship to underlying tissue fundamentally different between mice and humans.45,46 Herein lies a limitation of the mouse model. Nevertheless, the other advantages of using mice as models for human pathology, such as the ability to manipulate the mouse genome, make it a valuable model for the study of corneal scar formation and resolution.
Supplementary Material
Acknowledgments
The authors thank Rob Young and Christian Pinali at Cardiff for assistance with the electron microscopy.
Footnotes
These authors contributed equally and should be considered joint first authors.
5These authors contributed equally to the work.
This work was funded by MRC Grant G0600755 (KMM); NIH Grants EY09368, EY016415, and P30-EY008098 (JLF); Eye and Ear Foundation (Pittsburgh, Pennsylvania); and Research to Prevent Blindness. The Diamond Light Source is supported by STFC and The Wellcome Trust. Keith Meek is a Royal Society-Wolfson Research Merit Award holder.
Disclosure: C. Boote, None; Y. Du, None; S. Morgan, None; J. Harris, None; C.S. Kamma-Lorger, None; S. Hayes, None; K.L. Lathrop, None; D.S. Roh, None; M.K. Burrow, None; J. Hiller, None; N.J. Terrill, None; J.L. Funderburgh, None; K.M. Meek, None
References
- 1. Fini ME, Stramer BM. How the cornea heals: cornea-specific repair mechanisms affecting surgical outcomes. Cornea. 2005;24:S2–S11 [DOI] [PubMed] [Google Scholar]
- 2. Wilson SE, Mohan RR, Ambrosio R, Jr, , Hong J, Lee J. The corneal wound healing response: cytokine-mediated interaction of the epithelium, stroma, and inflammatory cells. Prog Retin Eye Res. 2001;20:625–637 [DOI] [PubMed] [Google Scholar]
- 3. Netto MV, Mohan RR, Ambrosio R, Jr, , Hutcheon AE, Zieske JD, Wilson SE. Wound healing in the cornea: a review of refractive surgery complications and new prospects for therapy. Cornea. 2005;24:509–522 [DOI] [PubMed] [Google Scholar]
- 4. Farrell RA, McCally RL. Corneal transparency. : DM Albert, Jakobiec FA. Principles and Practice of Ophthalmology. Philadelphia: W.B. Saunders Company; 2000:629–643 [Google Scholar]
- 5. Quantock AJ, Young RD. Development of the corneal stroma, and the collagen-proteoglycan associations that help define its structure and function. Dev Dyn. 2008;237:2607–2621 [DOI] [PubMed] [Google Scholar]
- 6. Cintron C, Schneider H, Kublin C. Corneal scar formation. Exp Eye Res. 1973;17:251–259 [DOI] [PubMed] [Google Scholar]
- 7. Rawe IM, Meek KM, Leonard DW, Takahashi T, Cintron C. Structure of corneal scar tissue: an X-ray diffraction study. Biophys J. 1994;67:1743–1748 [DOI] [PMC free article] [PubMed] [Google Scholar]
- 8. Hayashi S, Osawa T, Tohyama K. Comparative observations on corneas, with special reference to Bowman's layer and Descemet's membrane in mammals and amphibians. J Morphol. 2002;254:247–258 [DOI] [PubMed] [Google Scholar]
- 9. Moller-Pedersen T, Cavanagh HD, Petroll WM, Jester JV. Corneal haze development after PRK is regulated by volume of stromal tissue removal. Cornea. 1998;17:627–639 [DOI] [PubMed] [Google Scholar]
- 10. Zieske JD, Guimarães SR, Hutcheon AEK. Kinetics of keratocyte proliferation in response to epithelial debridement. Exp Eye Res. 2001;72:33–39 [DOI] [PubMed] [Google Scholar]
- 11. Stramer BM, Zieske JD, Jung JC, Austin JS, Fini ME. Molecular mechanisms controlling the fibrotic repair phenotype in cornea: implications for surgical outcomes. Invest Ophthalmol Vis Sci. 2003;44:4237–4246 [DOI] [PubMed] [Google Scholar]
- 12. Hayashi Y, Call MK, Chikama T, et al. Lumican is required for neutrophil extravasation following corneal injury and wound healing. J Cell Sci. 2010;123:2987–2995 [DOI] [PMC free article] [PubMed] [Google Scholar]
- 13. Mayo C, Ren R, Rich C, Stepp MA, Trinkaus-Randall V. Regulation by P2X7: epithelial migration and stromal organization in the cornea. Invest Ophthalmol Vis Sci. 2008;49:4384–4391 [DOI] [PMC free article] [PubMed] [Google Scholar]
- 14. Miyazaki K, Okada Y, Yamanaka O, et al. Corneal wound healing in an osteopontin-deficient mouse. Invest Ophthalmol Vis Sci. 2008;49:1367–1375 [DOI] [PubMed] [Google Scholar]
- 15. Ramaesh T, Ramaesh K, Leask R, et al. Increased apoptosis and abnormal wound-healing responses in the heterozygous Pax6+/- mouse cornea. Invest Ophthalmol Vis Sci. 2006;47:1911–1917 [DOI] [PubMed] [Google Scholar]
- 16. Yoshioka R, Shiraishi A, Kobayashi T, et al. Corneal epithelial wound healing impaired in keratinocyte-specific HB-EGF-deficient mice in vivo and in vitro. Invest Ophthalmol Vis Sci. 2010;51:5630–5639 [DOI] [PubMed] [Google Scholar]
- 17. Meek KM, Quantock AJ. The use of X-ray scattering techniques to determine corneal ultrastructure. Prog Retin Eye Res. 2001;20:95–137 [DOI] [PubMed] [Google Scholar]
- 18. Sheppard J, Hayes S, Boote C, Votruba M, Meek KM. Changes in corneal collagen architecture during mouse postnatal development. Invest Ophthalmol Vis Sci. 2010;51:2936–2942 [DOI] [PubMed] [Google Scholar]
- 19. Young RD, Swamynathan S, Boote C, et al. Stromal edema in Klf4 conditional null mouse cornea is associated with altered collagen fibril organization and reduced proteoglycans. Invest Ophthalmol Vis Sci. 2009;50:4155–4161 [DOI] [PMC free article] [PubMed] [Google Scholar]
- 20. Oster G, Riley GP. Scattering from cylindrically symmetric systems. Acta Cryst. 1952;5:272–276 [Google Scholar]
- 21. Worthington CR, Inouye H. X-ray diffraction study of the cornea. Int J Biol Macromol. 1985;7:2–8 [Google Scholar]
- 22. Meek K, Quantock AJ, Boote C, Liu CY, Kao WWY. An X-ray scattering investigation of corneal structure in keratocan deficient mice. Matrix Biol. 2003;22:467–475 [DOI] [PubMed] [Google Scholar]
- 23. Scott JE, Haigh M. Small proteoglycan collagen interactions. Keratan sulphate associates with rabbit corneal collagen fibrils at the ‘a' and ‘c' bands. Biosci Rep. 1985;5:71–81 [DOI] [PubMed] [Google Scholar]
- 24. Du Y, SundarRaj N, Funderburgh ML, Harvey SA, Birk DE, Funderburgh JL. Secretion and organization of a cornea-like tissue in vitro by stem cells from human corneal stroma. Invest Ophthalmol Vis Sci. 2007;48:5038–5045 [DOI] [PMC free article] [PubMed] [Google Scholar]
- 25. Carlson EC, Wang IJ, Liu CY, Brannan P, Kao CWC, Kao WWY. Altered KSPG expression by keratocytes following corneal injury. Mol Vis. 2003;9:615–623 [PubMed] [Google Scholar]
- 26. Mohan RR, Stapleton WM, Sinha S, Netto MV, Wilson SE. A novel method for generating corneal haze in anterior stroma of the mouse eye with the excimer laser. Exp Eye Res. 2008;86:235–240 [DOI] [PMC free article] [PubMed] [Google Scholar]
- 27. Maeda N. Optical coherence tomography for corneal diseases. Eye Contact Lens. 2010;36:254–259 [DOI] [PubMed] [Google Scholar]
- 28. Hanlon SD, Patel NB, Burns AR. Assessment of postnatal corneal development in the C57BL/6 mouse using spectral domain optical coherence tomography and microwave-assisted histology. Exp Eye Res. 2011;93:363–370 [DOI] [PMC free article] [PubMed] [Google Scholar]
- 29. Boote C, Dennis S, Newton RH, Puri H, Meek KM. Collagen fibrils appear more closely packed in the prepupilliary cornea—optical and biomechanical implications. Invest Ophthalmol Vis Sci. 2003;44:2941–2948 [DOI] [PubMed] [Google Scholar]
- 30. Boote C, Hayes S, Young RD, et al. Ultrastructural changes in the retinopathy, globe enlarged (rge) chick cornea. J Struct Biol. 2009;166:195–204 [DOI] [PMC free article] [PubMed] [Google Scholar]
- 31. Borcherding MS, Blacik LJ, Sittig RA, Bizzel JW, Breen M, Weinstein HG. Proteoglycans and collagen fibre organisation in human corneoscleral tissue. Exp Eye Res. 1975;21:59–70 [DOI] [PubMed] [Google Scholar]
- 32. Li W, Vergnes JP, Cornuet PK, Hassell JR. cDNA clone to chick corneal chondroitin/dermatan sulfate proteoglycan reveals identity to decorin. Arch Biochem Biophys. 1992;296:190–197 [DOI] [PubMed] [Google Scholar]
- 33. Corpuz LM, Funderburgh JL, Funderburgh ML, Bottomley GS, Prakash S, Conrad GW. Molecular cloning and tissue distribution of keratocan. Bovine corneal keratan sulfate proteoglycan 37A. J Biol Chem. 1996;271:9759–9763 [DOI] [PubMed] [Google Scholar]
- 34. Blochberger TC, Vergnes JP, Hempel J, Hassell JR. cDNA to chick lumican (corneal keratan sulfate proteoglycan) reveals homology to the small interstitial proteoglycan gene family and expression in muscle and intestine. J Biol Chem. 1992;267:347–352 [PubMed] [Google Scholar]
- 35. Bleckmann H, Schnoy N, Kresse H. Electron microscopic and immunohistochemical examination of scarred human cornea re-treated by excimer laser. Graefes Arch Clin Exp Ophthalmol. 2002;240:271–278 [DOI] [PubMed] [Google Scholar]
- 36. Berryhill BL, Kane B, Stramer B, Fini EM, Hassell JR. Increased SPARC accumulation during corneal repair. Exp Eye Res. 2003;77:85–92 [DOI] [PubMed] [Google Scholar]
- 37. Hassell JR, Cintron C, Kublin C, Newsome DA. Proteoglycan changes during the restoration of transparency in corneal scars. Arch Biochem Biophys. 1983;222:362–369 [DOI] [PubMed] [Google Scholar]
- 38. Rawe IM, Zabel RW, Tuft SJ, Chen V, Meek KM. A morphological study of rabbit corneas after laser keratectomy. Eye. 1992;6:637–642 [DOI] [PubMed] [Google Scholar]
- 39. Dawson DG, Kramer TR, Grossniklaus HE, Waring GO, III, , Edelhauser HF. Histologic, ultrastructural, and immunofluorescent evaluation of human laser assisted in situ keratomileusis corneal wounds. Arch Ophthalmol. 2005;123:741–756 [DOI] [PubMed] [Google Scholar]
- 40. Meek KM, Leonard DW, Connon CJ, Dennis S, Khan S. Transparency, swelling and scarring in the corneal stroma. Eye. 2003;17:927–936 [DOI] [PubMed] [Google Scholar]
- 41. Sundarraj N, Fite D, Belak R, et al. Proteoglycan distribution during healing of corneal stromal wounds in chick. Exp Eye Res. 1998;67:433–442 [DOI] [PubMed] [Google Scholar]
- 42. Funderburgh JL, Cintron C, Covington HI, Conrad GW. Immunoanalysis of keratan sulfate proteoglycan from corneal scars. Invest Ophthalmol Vis Sci. 1988;29:1116–1124 [PubMed] [Google Scholar]
- 43. Funderburgh JL, Funderburgh ML, Mann MM, Corpuz L, Roth MR. Proteoglycan expression during transforming growth factor beta-induced keratocyte-myofibroblast transdifferentiation. J Biol Chem. 2001;276:44173–44178 [DOI] [PMC free article] [PubMed] [Google Scholar]
- 44. Funderburgh JL, Hevelone ND, Roth MR, et al. Decorin and biglycan of normal and pathologic human corneas. Invest Ophthalmol Vis Sci. 1998;39:1957–1964 [PubMed] [Google Scholar]
- 45. Rehbinder C. Fine-structure of mouse cornea. Z Versuchstierkd. 1978;20:28–34 [PubMed] [Google Scholar]
- 46. Henriksson JT, McDermott AM, Bergmanson JPG. Dimensions and morphology of the cornea in three strains of mice. Invest Ophthalmol Vis Sci. 2009;50:3648–3654 [DOI] [PMC free article] [PubMed] [Google Scholar]
Associated Data
This section collects any data citations, data availability statements, or supplementary materials included in this article.


