

Abstract
G-protein-coupled receptor (GPCR)-kinase interacting protein-1 (GIT1) is a multi-function scaffold protein. However, little is known about its physiological role in the heart. Here we sought to identify the cardiac function of GIT1. Global GIT1 knockout (KO) mice were generated and exhibited significant cardiac hypertrophy that progressed to heart failure. Electron microscopy revealed that the hearts of GIT1 KO mice demonstrated significant morphological abnormities in mitochondria, including decreased mitochondrial volume density, cristae density and increased vacuoles. Moreover, mitochondrial biogenesis-related gene peroxisome proliferator-activated receptor γ (PPARγ) co-activator-1α (PGC-1α), PGC-1β, mitochondrial transcription factor A (Tfam) expression, and total mitochondrial DNA were remarkably decreased in hearts of GIT1 KO mice. These animals also had impaired mitochondrial function, as evidenced by reduced ATP production and dissipated mitochondrial membrane potential (Ψm) in adult cardiomyocytes. Concordant with these mitochondrial observations, GIT1 KO mice showed enhanced cardiomyocyte apoptosis and cardiac dysfunction. In conclusion, our findings identify GIT1 as a new regulator of mitochondrial biogenesis and function, which is necessary for postnatal cardiac maturation.
Keywords: GIT1, PGC-1, Mitochondrial biogenesis, Heart failure, Hypertrophy
1. Introduction
Adjustment of mitochondrial number and functional capacity according to cardiac energy demands is critical for postnatal cardiac development and cardiac disease [1,2]. Peroxisome proliferator-activated receptor γ (PPARγ) co-activator-1α (PGC-1α) was first identified for its important role in adaptive thermogenesis in adipose tissue [3]. PGC-1α gene expression is highly expressed in the mouse heart after birth [4]. PGC-1α coactivates transcription factors via binding to interact proteins such as PPARα, PPARγ, estrogen-related receptor (ERR), retinoid X receptor (RXR), and nuclear respiratory factors (NRFs) [5]. Cardiac overexpression of PGC-1α dramatically increases nuclear and mitochondrial-related gene expression, switches the metabolic energy substrate from glucose to fatty acid, and increases mitochondrial number and respiration rate [4].
The G-protein-coupled receptor (GPCR)-kinase interacting protein-1 (GIT1) is a multi-domain scaffold protein. Major functions of GIT1 include regulation of cytoskeletal dynamics during cell spreading and migration, receptor internalization, and synapse formation [6–8]. To study GIT1 function in vivo, GIT1 knockout (KO) mice were generated and they exhibited approximately 60% perinatal mortality. Pathological examination showed that the major abnormality in GIT1 KO mice was impaired lung vasculature development, evident by markedly reduced numbers of pulmonary blood vessels and increased alveolar spaces. This phenotype is presumably explained by the crucial role of GIT1 in the vascular endothelial growth factor (VEGF) pathway [9]. Surprisingly, GIT1 KO mice also demonstrated cardiomyocyte mitochondrial abnormalities and cardiac dysfunction. In this report, we reveal that GIT1 is a novel regulator of mitochondrial biogenesis in the heart.
2. Material and methods
2.1. Generation of GIT1 KO mice
GIT1 knockout mice (C57BL/6 background) were generated as described previously [9]. All animal experiments were conducted in accordance with experimental protocols that were approved by the Institutional Animal Care and Use Committee at the University of Rochester.
2.2. Immunohistochemistry
GIT1 WT mice at different ages were perfusion fixed with 10% paraformaldehyde as described [9]. The hearts were harvested, embedded in paraffin, and cross-sections (6 μm) were prepared. GIT1 expression was evaluated using anti-rabbit GIT1 (Invitrogen) polyclonal antibody, with hematoxylin counterstain. High temperature (120 °C) and pressure conditions were used for antigen retrieval with 10 mmol/L citrate buffer (pH 6.0) for 20 min. Primary antibodies were incubated at 4 °C overnight, followed by incubation with the secondary antibody for 30 min and ABC complex for 30 min. The peroxidase-binding sites were verified by the 3,3′ diaminobenzidine (DAB) in chromogen solution (Dako Cytomation Inc). Cardiac sections (2–3 months) were stained with FITC-conjugated WGA (Sigma) at 10 μg/mL for 2 h at room temperature. Myocyte areas were calculated using NIH Image J software and averaged from 50 myocytes per section for each animal.
2.3. Electron microscopy
Neonates(P5) were anesthetized and perfused with saline and paraformaldehyde/glutaraldehyde fixative (4% paraformaldehyde and 2.5% glutaraldehyde). Then hearts were fixed in paraformaldehyde/glutaraldehyde fixative and embedded. Mitochondrial volume densities were determined from electron micrographs as described previously [10]. For each animal, ten different fields at the magnification of 7500× were quantified in blinded fashion. Data were expressed as mean volume density of mitochondria in each field.
2.4. Adult cardiomyocyte isolation
Adult cardiomyocytes were isolated as described [11]. Briefly, GIT1 WT and KO mice (2–3 months) were anesthetized with 0.5 mL of heparin (100 U/mL) and 0.5 mL of ketamine/xylazine. The heart was isolated and perfused with perfusion buffer (5 mmol/L NaHCO3, 30mmol/L taurine, 10 mmol/L BDM, 5 mmol/L glucose, pH 7.4) and digestion buffer (120 mg collagenase type II in 50 mL perfusion buffer). Then the heart was removed and teased apart into small pieces using stopping buffer (10% FBS, 12.5 μmol/L CaCl2 in perfusion buffer). The cardiomyocyte pellet was harvested in stopping buffer. Calcium recovery was performed to a final concentration of 1.2mmol/L. The final pellet was resuspended in plating medium (MEM, 2.5% FBS, 1× penicillin/streptomycin, 2 mmol/L L-glutamine) and plated onto laminin-coated plates. All the experiments were finished in 24 h.
2.5. Immunofluorescence
Cardiomyocytes were isolated as described above and cultured overnight. Cells were fixed with 4% formaldehyde for 10 min, washed with phosphate-buffered saline three times, permeabilized with 0.05% Triton for 5 min, and blocked with 10% normal goat serum for 1 h. Cells were incubated with monoclonal α-actinin (Sarcomeric) antibody (Sigma) diluted in phosphate-buffered saline followed by Alexa Fluor 488 goat anti-mouse for green fluorescence (Molecular Probes, Inc.) in phosphate-buffered saline at a final concentration of 1.5–2 μg/mL each.
2.6. Quantitative reverse transcriptase PCR analysis (qRT-PCR)
Total heart tissue RNA from hearts of GIT1 WT and KO mice (P1) was obtained using TRIzol reagent (Invitrogen) according to the manufacturer’s protocol. Genomic/mitochondrial DNA was isolated using Trizol, followed by back extraction with 4 M guanidine thiocyanate, 50 mM sodium citrate, and 1 M tris, and an alcohol precipitation. Target gene mRNA expression and mitochondrial DNA content were determined by qRT-PCR (Applied Biosystems). The sequences of sense and antisense primers, corresponding PCR conditions, and cycle counts were as follows:
PGC-1α: 5′-TACGCACAACTCAGCAAGTCCTCA-3′ and 5′-TAGTCATGGTCACCAAACAGCCGA-3′; Tfam: 5′AGCCATAGTGCCCATCAGTTCTGT-3′ and 5′-AACGCAGAGAAACCCTGTCTCGAA-3′; PGC-1β 5′-TGAGATCCGTGCCAGTCTCACAAA-3′ and 5′-AAATACGGTGTCATACTCCGGGCT-3′;
ND 5: 5′-TGG ATG ATG GTA CGG ACG AA-3′ and 5′-TGC GGT TAT AGA GGA TTG CTT GT-3′;
lipoprotein lipase (LPL): 5′-ATGGATGGACGGTAACGGGAATGT-3′
and 5′-TGGATAATGTTGCTGGGCCCGATA-3′; 45 s at 94 °C, 45 s at 55 °C, and 45 s at 72 °C, 35 cycles. β actin cDNA was amplified as a control.
2.7. Assessment of mitochondrial function
Cellular ATP synthesis was determined by PhosphoWorks™ Luminometric ATP Assay Kit (AAT bioquest, Inc) according to the manufacturer’s protocol. In brief, adult cardiomyocytes from GIT1 WT and KO mice were isolated as described above. The cells were seeded into 96 well plates coated with laminin (3000/well). After the cells were cultured for 7–8 h, the culture media was discarded. Then 100 ul ATP assay solution was added and incubated for 20 min at room temperature. The luminescence intensity was detected by the illuminometer. The value of the luminescence intensity was normalized by the protein concentration in each well.
The mitochondrial membrane potential was analyzed using tetramethylrhodamine ethyl ester perchlorate (TMRE) (Molecular Probes) as reported [12]. Similarly, adult cardiomyocytes were isolated and seeded in 96 well plates and cultured for 7–8 h. Cells were incubated with 100 nM TMRE for 30 min at 37 °C. After incubation, the cells were washed once with pre-warmed Hank’s balanced salt solution (HBSS). TMRE fluorescence was measured at 549/574 nm excitation/emission and normalized by the protein concentration in each well. There are 10 wells per group and measurements were performed at least three times.
2.8. TUNEL analysis
GIT1 WT and KO mice were anesthetized with an intraperitoneal injection of ketamine (130 mg/kg) and xylazine (8.8 mg/kg) in saline (10 mL/kg). The mice were perfused with heparinized saline (1 unit heparin/mL saline) and fixed with 10% buffered formalin. The hearts were embedded, and 5 μm cryo-sections were prepared. Terminal deoxynucleotidyl transferase dUTP nick end labeling (TUNEL) was performed as described before [13]. Random images (10 per section) were captured and morphometric analyses were conducted in a blinded fashion.
2.9. Echocardiographic assay
Echocardiographic assay was performed using VisualSonics Vevo 770 echocardiography machine equipped with a 30 MHz frequency probe (VisualSonics). Echocardiography (M-mode) was obtained in conscious mice. The diastolic anterior wall thickness, diastolic posterior wall thickness, LV end-systolic dimension (LVESD), LV end-diastolic dimension (LVEDD), and ejection fraction were measured by the American Society for Echocardiology “leading-edge” method from three consecutive cardiac cycles. LV fractional shortening was calculated as follows: [(LVEDD—LVESD)/LVEDD]×100%.
2.10. Immunoblotting
Western blotting was performed as published [14]. Results were normalized to tubulin.
2.11. Statistical analysis
All values are expressed as means ± SE from three to six independent experiments. The significance of the results-was assessed by Student’s t-test. A p value<0.05 was considered statistically significant.
3. Results
3.1. GIT1 KO mice develop cardiac hypertrophy
GIT1 KO mice were generated as previously described [9]. Because these animals exhibited impaired pulmonary vascular development, we evaluated their hemodynamic condition and found no pulmonary hypertension in mice that survived to adulthood [9]. We also found that blood pressure and heart rate measurements were similar in GIT1 KO and WT mice (Supplemental Table 1). The hearts of GIT1 KO mice appeared larger than WT at 2 months (Fig. 1A). The heart weight (HW) to body weight (BW) ratio was significantly increased in GIT1 KO compared to WT mice at all time points measured, particularly at one month (7.17±0.6% in KO vs 3.92±0.8% in the WT group, Fig. 1B), whereas the body weight between the two groups was comparable (data not shown). In addition, cardiomyocyte cross-sectional areas were increased about 44% compared to that of WT mice (2–3 months, Figs. 1C–E). We next measured the time course and localization of GIT1 expression in WT hearts. GIT1 was most highly expressed postnatally (P5) in cardiomyocytes (Figs. 2A–B, D and E), endothelial cells and vascular smooth muscle cells (data not shown). Thereafter, cardiomyocyte GIT1 expression decreased over time (2 months, Figs. 2B and D), suggesting a role for GIT1 in cardiac development immediately after birth. In contrast, there was no expression of GIT1 in KO heart tissues (Figs. 2C–D). To determine whether the cardiac vasculature was impaired in GIT1 KO mice, we performed immunohistochemistry for platelet endothelial cell adhesion molecule-1 (PECAM-1, an endothelial cell marker) on 2 month old WT and GIT1 KO hearts (Supplemental Fig. 1A–B). The vessel density measured by PECAM-1 expression did not differ between GIT1 WT and KO mice (Supplemental Fig. 1C). We also assayed for several markers of endothelial cell function that we showed previously differed in GIT1 KO mice lung vasculature: VEGFR2, phospho-Phospholipase C γ (Y783) and phospho-ERK1/2. There were no significant differences in VEGFR2 expression or phosphorylation of PLCγ and ERK1/2 between GIT1 KO and GIT1 WT (Supplemental Fig. 1D–I). Together, these data suggest that the heart vasculature of GIT1 KO mice developed normally, and does not explain the cardiac hypertrophy.
Fig. 1.

GIT1 KO mice developed cardiac hypertrophy. A. The gross appearance of the isolated hearts from WT and GIT1 KO mice (2–3 months). B. The heart weight/body weight ratios of WT mice and GIT1 KO mice at different ages (*P<0.05 vs. WT mice). C–D. Cardiomyocyte areas of WT and GIT1 KO mice were measured by FITC-WGA staining. Bar=50 μm. E. Quantification of the cardiomyocyte cross-sectional area (mean ± SE; *P<0.05 vs. WT mice).
Fig. 2.

GIT1 was highly expressed in postnatal cardiomyocytes. A–C. GIT1 staining in hearts of GIT1 WT mice at P5 (A), 3 months (B) and KO mice at 3 months(C). Brown staining indicates positive cells. Bar=20 μm. D. GIT1 expression in hearts at different ages of GIT1 WT and KO mice was detected by western blot. E. Quantification of the relative expression of GIT1 normalized to tubulin (WT P2–3=1.0). *P<0.05 compared with WT P2–3 group (mean ± SE; n=3).
3.2. Abnormal mitochondrial morphology in the hearts of GIT1 KO mice
To further investigate the cause of the cardiac hypertrophy in the GIT1 KO mice, we examined the ultrastructural cardiomyocyte features by electron microscopy (EM) at P5. Cardiac mitochondria of the GIT1 KO mice exhibited a variety of ultrastructural abnormalities including increased vacuoles and reduced cristae density (Figs. 3A–B). Quantitative morphometry (Fig. 3C) confirmed a significant reduction of mitochondrial volume density in GIT1 KO mice (Mitochondrial volume density of WT and GIT1 KO mice was respectively 0.53±0.28 and 0.35±0.10um2/um2, P<0.05, compared to WT group). Furthermore, we measured total mitochondrial DNA as a marker of mitochondrial biogenesis. Using the ND5/LPL ratio [1], we found that mitochondrial DNA was reduced 29% in GIT1 KO mice (Fig. 3D), further confirming that mitochondrial biogenesis of GIT1 KO mice was impaired. In addition, it is known that one important function of GIT1 is regulation of cytoskeleton dynamics during cell spreading and migration [8,15]. We wondered whether the mitochondria abnormities are due to the cytoskeleton structure changes. Therefore, the α-actinin (α-sarcomeric actin) staining was performed on adult cardiomyocytes from WT and GIT1 KO mice (2–3 months). Supplemental Fig. 2 suggested that the cardiomyocytes from both WT and KO mice showed normal structure except for the increased size of KO cells. This data demonstrated that the abnormal mitochondrial morphology in KO mice was not caused by the changes of cytoskeleton structure.
Fig. 3.

Impaired mitochondrial biogenesis and mitochondrial function in GIT1 KO mice. A–B shows the changed mitochondria of left ventricular myocytes from GIT1 KO mice hearts at P5. The mitochondria of GIT1 KO mice showed swelling and cristae disorganization. Bars: 100 nm. Arrow indicates vacuolar abnormalities within mitochondria of the GIT1 KO mice. C. Quantification of mitochondrial cellular volume density. (*P<0.05 vs. GIT1 WT mice). D. Levels of ND5 expression (normalized to lipoprotein lipase (LPL) DNA content (n=3, *P<0.05 vs. GIT1 WT mice).
3.3. Mitochondrial biogenesis related genes were decreased in hearts of GIT1 KO mice
PGC-1α is a critical regulator of mitochondrial biogenenesis [16–18]. Based on the observed mitochondrial abnormalities in GIT1 KO cardiomyocytes, we determined whether expression of the PGC-1 protein family was altered in GIT1 KO mice. Because PGC-1α is highly expressed in postnatal hearts, we harvested cardiac tissue from WT and KO mice at P1 and measured PGC-1α, PGC-1β and Tfam (PGC-1α target gene) mRNA expression by quantitative reverse transcriptase PCR (qRT-PCR). Concordant with mitochondrial biogenesis, PGC-1α, PGC-1β and Tfam mRNA expression in the hearts of GIT1 KO mice were 56.3±7.1, 46.2±6.1 and 57±6.8% lower than WT mice (Fig. 4AP<0.5). PGC-1α protein expression was also significantly diminished in GIT1 KO relative to WT mice (Fig. 4B), correlating with the mRNA data. On the other hand, loss of GIT1 did not affect the expression of other important mitochondrial biogenesis-related transcription factors, NRF1, NRF2, ERRα and RXR (data not shown). PGC-1α is also an essential regulator of mitochondrial biogenesis in skeletal muscle [19]. Surprisingly, we found there are not obvious changes in PGC-1α expression in skeletal muscle of WT and GIT1 KO mice at 1–2 months (Supplemental Fig. 3). In summary, our data suggest that GIT1 is a crucial and specific regulator of PGC-1 family in heart.
Fig. 4.

Decreased mitochondrial biogenesis related gene expression in hearts of GIT1 KO mice. A. Levels of mRNA expression of mitochondrial genes in WT and GIT1 KO hearts (P1) were examined using qRT-PCR. The graphs show the relative levels of the PGC-1α, PGC-1β and Tfam mRNAs normalized to the level of GAPDH mRNA in hearts of WT and GIT1 KO mice. (mean ± SE; n=3, *P<0.05 vs. WT group). B. PGC-1α protein expression in GIT1 WT and KO mice hearts (P2–3) was assayed by western blot. Right panel shows relative level of PGC-1α protein normalized to tubulin (*P<0.05 vs. WT group).
3.4. Defect of mitochondrial function in GIT1 KO mice hearts
The major function of the mitochondria is to produce ATP via oxidative phosphorylation to provide the energetic needs of the beating heart. Building on our observations of decreased mitochondrial biogenesis in GIT1 KO mouse hearts, we hypothesized that mitochondrial function in these hearts would also be impaired. To exclude effects from other cell types and the secondary effects of cardiac dysfunction, we measured ATP production and mitochondrial membrane potential in isolated adult cardiomyocytes from WT and GIT1 KO mice at 1 month. Supplemental Fig. 4 demonstrates that the cardiac function of GIT1 KO mice was similar to WT mice at 1 month. As expected, ATP production by adult cardiomyocytes from GIT1 KO mice was decreased by 43±5.3% compared to WT (Fig. 5A). In addition, we used the membrane potential sensitive dye tetra-methylrhodamine ethyl ester (TMRE) to assess the mitochondrial potential. Fig. 5B demonstrates substantially dissipated mitochondrial membrane potential in cardiomyocytes of GIT1 KO mice. These results indicate that GIT1 is important for maintaining mitochondrial function in cardiomyocytes.
Fig. 5.
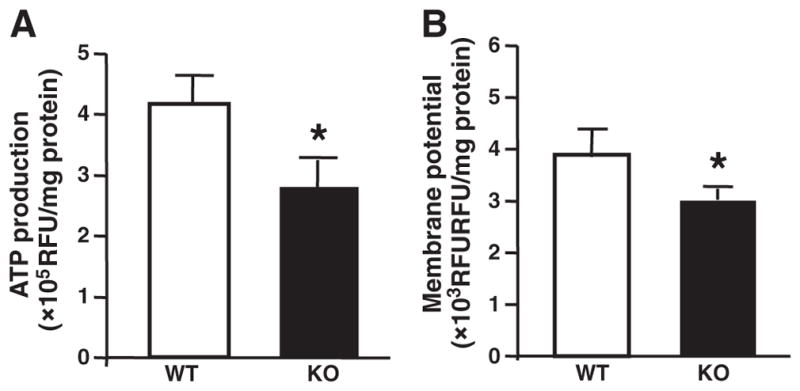
Impaired mitochondrial function in hearts of GIT1 KO mice. A. Basal ATP levels. The total cellular ATP concentration in adult cardiomyocytes of GIT1 KO mice was decreased compared to WT group (1 month). B. Mitochondrial membrane potential under basal conditions. In adult cardiomyocytes of GIT1 KO mice (1 month), a significant drop of the membrane potential was observed. (mean ± SE; n=4, * P<0.05 vs. WT group).
3.5. Enhanced apoptosis in hearts of GIT1 KO mice
Dissipated mitochondrial potential is associated with increased cardiomyocyte apoptosis [20]. Therefore, we assessed apoptosis in GIT1 KO hearts using the terminal deoxynucleotidyl transferase dUTP nick end labeling (TUNEL) assay. Figs. 6A–C show that apoptotic cells in GIT1 KO mice were increased 7.0±0.3 fold compared to WT mice (2–3 months, P<0.05). Anti-apoptotic protein Bcl-2 is an important negative regulator of mitochondrial-related apoptosis. Therefore, we assessed Bcl-2 expression by immunoblot. Figs. 6D and E demonstrate significantly decreased Bcl-2 expression in GIT1 KO mice compared to WT mice (49.1±7.9% decrease P<0.05). Collectively, these data demonstrate increased apoptotic cardiomyocyte death upon genetic ablation of GIT1.
Fig. 6.

Enhanced apoptosis in hearts of GIT1 KO mice. A–B. TUNEL analysis of cardiomyocyte apoptosis. Apoptotic (TUNEL-positive) nuclei were stained green. A: GIT1 WT group (3 months); no apoptotic cells. B: GIT1 KO group; significant increase in apoptotic cells. C. Quantification of apoptotic cells in hearts of WT and GIT1 KO mice (n=3, *P<0.05 vs. WT group). D. Expression of Bcl-2 in hearts of WT and GIT1KO mice. E. Quantitation of the relative change of Bcl-2 normalized to tubulin (WT 3 months=1.0) (*P<0.05 vs. WT group).
3.6. Cardiac function was impaired in GIT1 KO mice at 2–3 months
Defects in mitochondrial biogenesis, mitochondrial function, and increased apoptosis may cause cardiac dysfunction. Therefore, cardiac function of WT and GIT1 KO mice (2–3 months) was assayed by echocardiography [21]. The FS% (Fig. 7A) and EF% (Fig. 7B) of GIT1 KO mice were reduced 14.7±3.5% and 23.1±4.8% respectively compared to WT mice. Furthermore, the left ventricle internal dimension at systole (LVID,s) of GIT1 KO mice was remarkably increased (1.93± 0.313 vs. 1.43±0.15 for WT animals, Fig. 7C, P<0.05, n=7). In addition, Fig. 7D shows that left ventricle posterior wall thickness at systole (LVPW,s; 1.15±0.21 mm) and diastole (LVPW,d; 0.90± 0.33 mm) of GIT1 KO mice also decreased (P<0.05, compared to WT group; LVPW,s; 1.88±0.31 mm; LVPW,d; 1.47±0.25 mm;). Interestingly, the FS% and EF% of GIT1 KO mice at 1 month were similar to age matched WT mice (Supplemental Fig. 4). These data demonstrate that significant cardiac dysfunction appeared in GIT1 KO mice at 2–3 months.
Fig. 7.

GIT1 KO mice developed cardiac dysfunction at 2–3 months. A. Left ventricular Ejection fraction (EF%). B. Left ventricular fractional shortening (FS%). C. Left ventricular inner-dimension in systole; *P<0.05 vs GIT1 WT mice. D. Left ventricular posterior wall in systole (LVPW,s); left ventricular posterior wall in diastole (LVPW,d); Left ventricular anterior wall in systole (LVAW,s); left ventricular anterior wall in diastole (LVAW,d).
4. Discussion
The major finding of this study is the identification of GIT1 as a novel regulator of cardiac biogenesis, which is essential for maintaining normal postnatal mitochondrial integrity and cardiac function. The GIT1 KO mice demonstrated four important cardiac phenotypes. First, GIT1 was highly expressed postnatally (P2–3 days) and GIT1 KO exhibited increased cardiomyocyte diameter and heart weight/body weight ratio. Second, mitochondria in GIT1 KO exhibited multiple abnormalities including cristae swelling, decreased volume density, decreased ATP production, and decreased membrane potential. Third, these mitochondrial defects were likely caused by a decrease in PGC-1α and PGC-1β, key regulators of mitochondrial biogenesis. Fourth, the GIT1 KO exhibited significant cardiac dysfunction characterized by dilation, impaired EF and increased cardiomyocyte apoptosis.
Previously we showed that GIT1 KO mice demonstrate disrupted postnatal lung vascular development [9]. In contrast, the vasculature in heart, brain and kidney were normal, suggesting that the cardiac defects were not related to vascular abnormalities [22].We do not believe that the lung phenotype caused cardiac dysfunction in GIT1 KO mice for the following reasons: 1) PGC-1α protein and mRNA expression was downregulated in GIT1 KO at P1. In contrast, VEGF mediated lung vascular development is just initiated at that point and doesn’t peak until P5 [23–25]. 2) GIT1 KO mice showed about 35% increase in cardiomyocyte size in both left ventricle and right ventricle as early as P5, suggesting a biventricular mechanism. 3) Our recently published data showed that the pulmonary artery pressure and right ventricle pressure in GIT1 KO mice at 2–3 months of age were similar to the age-matched WT mice [9]. Thus the cardiac hypertrophy in GIT1 KO mice is not consequent to pulmonary hypertension. We also don’t believe that increased blood pressure is a major contributor to GIT1 KO cardiac hypertrophy, since blood pressure as well as heart rate were similar in WT and GIT1 KO mice (Supplemental Table 1).
The cardiac phenotype of the GIT1 KO was somewhat unexpected because Premont’s group found no expression of GIT1 in the heart. Specifically, this group used mice with β-galactosidase (β-Gal) reporters inserted into the two GIT genes to visualize GIT1 and GIT2 gene expression in mouse tissues [26]. β-Gal staining showed that GIT2 was expressed inmost cells of the body, while GIT1 was highly restricted to brain, vessels (both EC and VSMC), lung bronchi and liver bile ducts. There was no expression of GIT1 in heart, skeletal, or smooth muscle cells (except vascular). However, the expression of GIT1 in neonatal heart was not investigated in the Premont study. We discovered that GIT1 is highly expressed in neonatal cardiomyocytes with lesser expression in adult cardiomyocytes. No compensation of GIT2 in hearts of GIT1 KO mice was observed (data not shown). These findings demonstrate a novel role for GIT1 in postnatal cardiac maturation.
After birth, there is a dramatic increase in mitochondrial biogenesis, and a transition of major mitochondrial metabolism substrates from glucose and lactate to fatty acids. The coactivator PGC-1α has been identified as the most important regulator of mitochondrial biogenesis and substrate transition in this period [5,27,28]. PGC-1α is highly expressed in mitochondrial-enriched tissues such as heart. PGC-1α coactivates nuclear respiratory factor 1 (NRF-1) and NRF2, which are crucial for expression of Tfam. Tfam then binds to the promoter enhancer of the mitochondrial DNA (mtDNA) and drives the transcription and replication of mitochondrial DNA [16–18]. Our data showed that Tfam was remarkably inhibited by deletion of GIT1,while NRF1 and NRF2 expression were not altered (data not shown). These results imply that GIT1 mediated PGC-1 signaling targets specific genes. Consistent with reduced expression of mitochondrial biogenesis-related genes, GIT1 KO mice displayed profound abnormalities in mitochondrial morphology in heart, including decreased mitochondrial DNA, mitochondrial volume density, reduced cristae density and increased vacuoles. Accordingly, adult cardiomyocytes from GIT1 KO mice produced less ATP and had significantly more dissipated mitochondrial potentials compared to WT, which is evidence of the disrupted mitochondrial function in the KO animals. Interestingly, the mitochondrial morphology in brain, kidney and lung was not affected by loss of GIT1 (data not shown) and PGC-1 expression in skeletal muscle was not altered in GIT1 KO mice. These data suggest the effects of GIT1 deletion on mitochondria are restricted to cardiomyocytes.
The key role of PGC-1 regulated genes in mitochondrial biogenesis in the postnatal heart is supported by the fact that the PGC-1αβ double KO mice die quickly after birth due to impaired mitochondrial function [1]. The present study supports a key role for GIT1 in regulating PGC-1α gene expression. Specifically, we showed altered mitochondria ultra-structure, biogenesis, and reduced mitochondrial potential. Moreover, the severe lung phenotype obviously increases the oxidative stress and the GIT1 KO mice quickly develop cardiac dysfunction from 2 to 3 months old. The exact mechanisms by which GIT1 regulates PGC-1α expression remains under investigation, though evidence suggests that the ARF-GAP domain of GIT1 may play a critical role (unpublished data).
In summary, our study identifies GIT1 as a novel regulator of cardiac mitochondrial biogenesis and cell survival, as well as a new pathway for regulation of PGC-1α mediated gene expression.
Supplementary Material
Acknowledgments
We acknowledge technical assistance by Dr. Karen L. Bentley for the electron microscopy experiments.
Sources of funding
This work was supported by Scientist Development Grant from American Heart Associate to Jinjiang Pang (0835626D). This work was also supported by grants from the NIH to B.C.B. (HL63462).
Footnotes
Supplementary materials related to this article can be found online at doi:10.1016/j.yjmcc.2011.06.020.
Disclosures
The authors declare no conflicts.
References
- 1.Lai L, Leone TC, Zechner C, Schaeffer PJ, Kelly SM, Flanagan DP, et al. Transcriptional coactivators PGC-1alpha and PGC-lbeta control overlapping programs required for perinatal maturation of the heart. Genes Dev. 2008 Jul 15;22(14):1948–61. doi: 10.1101/gad.1661708. [DOI] [PMC free article] [PubMed] [Google Scholar]
- 2.Finck BN, Lehman JJ, Leone TC, Welch MJ, Bennett MJ, Kovacs A, et al. The cardiac phenotype induced by PPARalpha overexpression mimics that caused by diabetes mellitus. J Clin Invest. 2002 Jan;109(1):121–30. doi: 10.1172/JCI14080. [DOI] [PMC free article] [PubMed] [Google Scholar]
- 3.Puigserver P, Wu Z, Park CW, Graves R, Wright M, Spiegelman BM. A cold-inducible coactivator of nuclear receptors linked to adaptive thermogenesis. Cell. 1998 Mar 20;92(6):829–39. doi: 10.1016/s0092-8674(00)81410-5. [DOI] [PubMed] [Google Scholar]
- 4.Lehman JJ, Barger PM, Kovacs A, Saffitz JE, Medeiros DM, Kelly DP. Peroxisome proliferator-activated receptor gamma coactivator-1 promotes cardiac mitochondrial biogenesis. J Clin Invest. 2000 Oct;106(7):847–56. doi: 10.1172/JCI10268. [DOI] [PMC free article] [PubMed] [Google Scholar]
- 5.Finck BN, Kelly DP. PGC-1 coactivators: inducible regulators of energy metabolism in health and disease. J Clin Invest. 2006 Mar;116(3):615–22. doi: 10.1172/JCI27794. [DOI] [PMC free article] [PubMed] [Google Scholar]
- 6.Bagrodia S, Bailey D, Lenard Z, Hart M, Guan JL, Premont RT, et al. A tyrosine-phosphorylated protein that binds to an important regulatory region on the cool family of p21-activated kinase-binding proteins. J Biol Chem. 1999;274:22393–400. doi: 10.1074/jbc.274.32.22393. [DOI] [PubMed] [Google Scholar]
- 7.Lamorte L, Rodrigues S, Sangwan V, Turner CE, Park M. Crk associates with a multimolecular paxillin/GIT2/{beta}-PIX complex and promotes Rac-dependent relocalization of paxillin to focal contacts. Mol Biol Cell. 2003 Jul;14(7):2818–31. doi: 10.1091/mbc.E02-08-0497. [DOI] [PMC free article] [PubMed] [Google Scholar]
- 8.Manabe R, Kovalenko M, Webb DJ, Horwitz AR. GIT1 functions in a motile, multi-molecular signaling complex that regulates protrusive activity and cell migration. J Cell Sci. 2002 Apr 1;115(Pt 7):1497–510. doi: 10.1242/jcs.115.7.1497. [DOI] [PubMed] [Google Scholar]
- 9.Pang J, Hoefen R, Pryhuber GS, Wang J, Yin G, White RJ, et al. G-protein-coupled receptor kinase interacting protein-1 is required for pulmonary vascular development. Circulation. 2009 Mar 24;119(11):1524–32. doi: 10.1161/CIRCULATIONAHA.108.823997. [DOI] [PMC free article] [PubMed] [Google Scholar]
- 10.Russell LK, Mansfield CM, Lehman JJ, Kovacs A, Courtois M, Saffitz JE, et al. Cardiac-specific induction of the transcriptional coactivator peroxisome proliferator-activated receptor gamma coactivator-1alpha promotes mitochondrial biogenesis and reversible cardiomyopathy in a developmental stage-dependent manner. Circ Res. 2004 Mar 5;94(4):525–33. doi: 10.1161/01.RES.0000117088.36577.EB. [DOI] [PubMed] [Google Scholar]
- 11.Casey LM, Pistner AR, Belmonte SL, Migdalovich D, Stolpnik O, Nwakanma FE, et al. Small molecule disruption of G beta gamma signaling inhibits the progression of heart failure. Circ Res. 2010 Aug 20;107(4):532–9. doi: 10.1161/CIRCRESAHA.110.217075. [DOI] [PMC free article] [PubMed] [Google Scholar]
- 12.Si Y, Shi H, Lee K. Metabolic flux analysis of mitochondrial uncoupling in 3T3-L1 adipocytes. PLoS One. 2009;4(9):e7000. doi: 10.1371/journal.pone.0007000. [DOI] [PMC free article] [PubMed] [Google Scholar]
- 13.Pang JJ, Xu RK, Xu XB, Cao JM, Ni C, Zhu WL, et al. Hexarelin protects rat cardiomyocytes from angiotensin II-induced apoptosis in vitro. Am J Physiol Heart Circ Physiol. 2004 Mar;286(3):H1063–9. doi: 10.1152/ajpheart.00648.2003. [DOI] [PubMed] [Google Scholar]
- 14.Pang J, Yan C, Natarajan K, Cavet ME, Massett MP, Yin G, et al. GIT1 mediates HDAC5 activation by angiotensin II in vascular smooth muscle cells. Arterioscler Thromb Vasc Biol. 2008 May;28(5):892–8. doi: 10.1161/ATVBAHA.107.161349. [DOI] [PMC free article] [PubMed] [Google Scholar]
- 15.Brown MC, Cary LA, Jamieson JS, Cooper JA, Turner CE. Src and FAK kinases cooperate to phosphorylate paxillin kinase linker, stimulate its focal adhesion localization, and regulate cell spreading and protrusiveness. Mol Biol Cell. 2005 Sep;16(9):4316–28. doi: 10.1091/mbc.E05-02-0131. [DOI] [PMC free article] [PubMed] [Google Scholar]
- 16.Fisher RP, Lisowsky T, Parisi MA, Clayton DA. DNA wrapping and bending by a mitochondrial high mobility group-like transcriptional activator protein. J Biol Chem. 1992 Feb 15;267(5):3358–67. [PubMed] [Google Scholar]
- 17.Garesse R, Vallejo CG. Animal mitochondrial biogenesis and function: a regulatory cross-talk between two genomes. Gene. 2001 Jan 24;263(1–2):1–16. doi: 10.1016/s0378-1119(00)00582-5. [DOI] [PubMed] [Google Scholar]
- 18.Larsson NG, Wang J, Wilhelmsson H, Oldfors A, Rustin P, Lewandoski M, et al. Mitochondrial transcription factor A is necessary for mtDNA maintenance and embryogenesis in mice. Nat Genet. 1998 Mar;18(3):231–6. doi: 10.1038/ng0398-231. [DOI] [PubMed] [Google Scholar]
- 19.Wu H, Kanatous SB, Thurmond FA, Gallardo T, Isotani E, Bassel-Duby R, et al. Regulation of mitochondrial biogenesis in skeletal muscle by CaMK. Science. 2002 Apr 12;296(5566):349–52. doi: 10.1126/science.1071163. [DOI] [PubMed] [Google Scholar]
- 20.Olivetti G, Abbi R, Quaini F, Kajstura J, Cheng W, Nitahara JA, et al. Apoptosis in the failing human heart. N Engl J Med. 1997 Apr 17;336(16):1131–41. doi: 10.1056/NEJM199704173361603. [DOI] [PubMed] [Google Scholar]
- 21.Xu XB, Pang JJ, Cao JM, Ni C, Xu RK, Peng XZ, et al. GH-releasing peptides improve cardiac dysfunction and cachexia and suppress stress-related hormones and cardiomyocyte apoptosis in rats with heart failure. Am J Physiol Heart Circ Physiol. 2005 Oct;289(4):H1643–51. doi: 10.1152/ajpheart.01042.2004. [DOI] [PubMed] [Google Scholar]
- 22.Menon P, Deane R, Sagare A, Lane SM, Zarcone TJ, O’Dell MR, et al. Impaired spine formation and learning in GPCR kinase 2 interacting protein-1 (GIT1) knockout mice. Brain Res. 2010 Mar 4;1317:218–26. doi: 10.1016/j.brainres.2009.11.084. [DOI] [PMC free article] [PubMed] [Google Scholar]
- 23.deMello DE, Sawyer D, Galvin N, Reid LM. Early fetal development of lung vasculature. Am J Respir Cell Mol Biol. 1997 May;16(5):568–81. doi: 10.1165/ajrcmb.16.5.9160839. [DOI] [PubMed] [Google Scholar]
- 24.Hislop A. Developmental biology of the pulmonary circulation. Paediatr Respir Rev. 2005 Mar;6(1):35–43. doi: 10.1016/j.prrv.2004.11.009. [DOI] [PubMed] [Google Scholar]
- 25.Hislop AA. Airway and blood vessel interaction during lung development. J Anat. 2002 Oct;201(4):325–34. doi: 10.1046/j.1469-7580.2002.00097.x. [DOI] [PMC free article] [PubMed] [Google Scholar]
- 26.Schmalzigaug R, Phee H, Davidson CE, Weiss A, Premont RT. Differential expression of the ARF GAP genes GIT1 and GIT2 in mouse tissues. J Histochem Cytochem. 2007 Oct;55(10):1039–48. doi: 10.1369/jhc.7A7207.2007. [DOI] [PubMed] [Google Scholar]
- 27.Abramson JL, Hooper WC, Jones DP, Ashfaq S, Rhodes SD, Weintraub WS, et al. Association between novel oxidative stress markers and C-reactive protein among adults without clinical coronary heart disease. Atherosclerosis. 2005 Jan;178(1):115–21. doi: 10.1016/j.atherosclerosis.2004.08.007. [DOI] [PubMed] [Google Scholar]
- 28.Soyal S, Krempler F, Oberkofler H, Patsch W. PGC-1alpha: a potent transcriptional cofactor involved in the pathogenesis of type 2 diabetes. Diabetologia. 2006 Jul;49(7):1477–88. doi: 10.1007/s00125-006-0268-6. [DOI] [PubMed] [Google Scholar]
Associated Data
This section collects any data citations, data availability statements, or supplementary materials included in this article.