

Abstract
The current study examined the long-term trend in sex ratio at birth between 1929 and 1982 using retrospective birth histories of 310 101 Chinese women collected in a large, nationally representative sample survey in 1982. The study identified an abrupt decline in sex ratio at birth between April 1960, over a year after the Great Leap Forward Famine began, and October 1963, approximately 2 years after the famine ended, followed by a compensatory rise between October 1963 and July 1965. These findings support the adaptive sex ratio adjustment hypothesis that mothers in good condition are more likely to give birth to sons, whereas mothers in poor condition are more likely to give birth to daughters. In addition, these findings help explain the lack of consistent evidence reported by earlier studies based on the 1944–1945 Dutch Hunger Winter or the 1942 Leningrad Siege.
Keywords: sex ratio at birth, famine, natural selection, maternal nutrition
1. Introduction
Evolutionary theories suggest that parents can adjust offspring sex ratio adaptively to achieve optimal survival and reproductive results [1,2]. The most influential adaptive sex ratio adjustment hypothesis, which was proposed by Trivers and Willard (TW), stated that, because the reproductive success of male offspring tends to be more variable and resource-sensitive than that of female offspring, parental investment in sons of good quality yields greater reproductive returns than comparable investment in daughters of the same quality, whereas parental investment in sons of poor quality yields lower reproductive returns than comparable investments in daughters of the same quality [1]. This leads to the prediction that for human and non-human vertebrates, healthy, well-nourished and high-status mothers are more likely to give birth to sons, whereas unhealthy, poorly nourished and low-status mothers are more likely to give birth to daughters [3–7]. Another important adaptive sex ratio adjustment hypothesis was proposed by Myers [2]. Myers agreed with TW on the prediction regarding the adaptive sex ratio adjustment but disagreed with their explanation. According to Myers, mothers under nutritional stress are more likely to give birth to daughters because daughters are nutritionally less expensive than sons and thus have a better chance to survive the harsh environment [2].
The empirical tests of the abovementioned adaptive sex ratio adjustment hypotheses have primarily focused on the effect of maternal nutritional condition [8–18]. Because social status and health condition are determined by a large number of genetic and environmental factors, they are difficult to experimentally manipulate for causal analysis. Nutrition, in contrast, can be manipulated in controlled experiments. In fact, some of the most important animal-based evidence supporting the adaptive sex ratio adjustment hypothesis comes from experimental studies [16–18]. Owing to additional legal and ethical restrictions on the use of human subjects in scientific research, however, human-based empirical evidence mainly comes from observational studies. One observational study using human subjects compared the sex ratio of offspring between women with a good diet and women with a poor diet [10], whereas other observational studies compared the sex ratio of offspring between women with normal weight or body mass index (BMI) and those with low body weight or BMI [13,19,20]. Research has also estimated the relationship between nutritional condition and sex ratio at birth at the national level [15]. These observational studies lead to inconsistent findings regarding whether poor maternal nutritional conditions reduce the proportion of male births among human. One possible explanation for the inconsistent results is omitted variable bias [21]. Women's conditions (e.g. weight, body mass, diet) and reproductive outcomes may be jointly determined by genetic and environmental factors, many of which cannot be directly observed and controlled for in statistical analysis. Without randomization, the estimated relationship between women's conditions and reproductive outcomes may be confounded by these unobserved determinants [22].
Famine provides an opportunity to tackle the problem. Famine serves as a ‘natural experiment’ that mimics a randomized experiment because the mechanism of determining an individual's nutritional condition (exposed to famine-induced malnutrition or not) is exogenous and largely independent of individual-level outcomes [23]. The effect of maternal nutritional condition on offspring sex ratio at birth can be assessed by comparing the sex ratio at birth between those who were born during the famine and those were born either before or after the famine. Unfortunately, existing famine-based empirical evidence is also inconsistent. Studies based on the 1944–1945 Dutch Hunger Winter and the 1942 Leningrad Siege reported (i) no association [9,24], (ii) a negative association [25] and (ii) a positive association [14] between maternal famine exposure and offspring's sex ratio at birth. There are a number of possible reasons for these inconsistent findings.
First, both the Dutch Hunger Winter and Leningrad Siege lasted for a relatively short period of time (seven months in Holland and six months in Leningrad). Therefore, the possibility that the duration of these famines was too brief to produce a consistent effect on sex ratio at birth cannot be ruled out [15]. Second, as both famines were regional in scale, they impacted relatively small populations, making it difficult to obtain study samples with large enough sample sizes to produce reliable effect estimates. Third, none of the existing studies paid sufficient attention to the potentially confounding effect of the long-term secular trend in sex ratio at birth, which has been documented in a number of studies [26,27]. Comparing birth cohorts (i.e. those who were born before, during and after the famine year) outside of their historical context results in the risk of mistakenly interpreting the effect of the long-term secular trend as part of the causal effect of interest. Depending on the direction and magnitude of the secular trend and the causal effect of interest, such confounding effects can lead to either false-positive or false-negative findings.
The commonly used dummy variable regression approach does not work well with long-term secular trend data. As Greenland [28] stated, breaking a continuous explanatory variable (e.g. time of birth) into an arbitrary number of subgroups (e.g. pre-famine, famine and post-famine cohorts) and including dummy variables that represent these subgroups into regression analysis assumes no within-group variation. This is a strong assumption and is not biologically reasonable, especially when the subgroup is defined broadly. When the subgroup is narrowly defined such that the no within-group variation assumption is less problematic, the number of subgroups to be included in the analysis is often too large to be tractable. As the number of subgroups increases, the number of cases within each group decreases, making it increasingly difficult to obtain reliable effect estimates. An alternative strategy is to conduct ‘break point’ or ‘change point’ analysis to capture abrupt changes in the long-term secular trend in sex ratio at birth [29,30]. Break points refer to the points on the regression line at which the regression function is continuous but first derivatives are discontinuous [29]. There are many forms of break-point analysis, the simplest of which is based on linear spline regression models [31]. Compared with quadratic, cubic or even higher order spline models, the main strength of a linear spline model is the interpretability of the spline coefficients, as these coefficients represent the differences in the slope coefficients of the regression lines before and after the break points [32].
The current study uses the Chinese Great Leap Forward Famine of 1959–1961 as a natural experiment to test the adaptive sex ratio adjustment hypothesis proposed by TW and Myers. Combining data from a large, nationally representative sample survey and linear spline-based break-point analysis, this study identified the following three break points on the otherwise smooth secular trend in sex ratio at birth between 1929 and 1982: (i) a sudden decline in sex ratio at birth beginning in April 1960, over a year after the famine began; (ii) a sharp increase beginning in October 1963, nearly 2 years after the famine ended; and (iii) a slowdown in July 1965, nearly 4 years after the famine ended, followed by a long-term gradual increase. Such a V-shaped curve provides evidence that supports the adaptive hypothesis and suggests that more than six or seven months of cumulative famine exposure may be required to observe the hypothesized changes in sex ratio at birth.
2. Material and methods
The Great Leap Forward Movement (November 1957–January 1961) was initiated by senior Chinese leaders to boost industrial productivity and accelerate the pace of economic development through mass mobilization. This effort, however, ended disastrously with a severe famine that lasted over 3 years and affected hundreds of millions of people [33,34]. It is difficult to pinpoint the exact beginning and ending dates of the famine because of the vast territory involved and the presence of significant regional variations in the famine impact. Famine conditions began in the autumn of 1958 in some parts of the country and then became widespread in the beginning (January) of 1959 [35]. The famine continued in most parts of China for 3 years until the end (December) of 1961, causing over 30 million deaths and 33 million fertility losses [34,36,37], making it one of the most disastrous catastrophes in modern human history. The Great Leap Forward Famine has been used to study the relationship between prenatal malnutrition and mortality [38,39], schizophrenia [40], BMI [41], height [41,42] and disability [43]. It also provides a sensible test case for adaptive sex ratio adjustment hypothesis. In particular, the famine's unusually long duration and broad population impact provide an opportunity to understand why earlier studies based on the 1944–1945 Dutch Hunger Winter and the 1942 Leningrad Siege did not find consistent evidence for the hypothesized adaptive effects.
The data used in the present study were obtained from the 1982 one-per-thousand fertility survey conducted by the Chinese State Family Planning Commission. Conducted two months after the 1982 Chinese Census, the one-per-thousand fertility survey used the census as the sampling frame to collect complete retrospective birth histories from a nationally representative sample of 310 101 Chinese women aged 15–67 through face-to-face interviews. This survey was the first national fertility survey conducted in China since 1949, and it generated high-quality data with excellent population coverage [44,45]. A number of influential publications in the 1980s and 1990s were based on the one-per-thousand survey data, covering a wide range of research topics, including sex ratio at birth [46,47]. Because no earlier survey or census data are available in China and the official statistics for the 1960s and 1970s are fragmented and unreliable owing to the breakdown of the statistical system during the Cultural Revolution (1966–1976), the 1982 one-per-thousand fertility survey is the best data source to examine the demographic consequences of the Great Leap Forward Famine.
The current study focused on the 830 045 live-born children (born between September 1929 and July 1982) of the 310 101 surveyed women. The dependent variable, the sex of each child, was reported by the selected women. It was coded such that 1 = male and 0 = female. Retrospective information is subject to recall bias. However, because giving birth is such a significant event in a woman's life, recall bias is much less of a concern in this particular case. Furthermore, it is unlikely that the trend in sex ratio at birth was influenced by the one-child family planning policy because (i) the policy was in its very early stage in 1982 (when the survey was conducted), and its demographic consequences, including an increase in sex-selective abortion, did not become apparent until a few years later [48] and (ii) highly effective prenatal sex determination technology, such as the ultrasound machine, first appeared in China in the early 1980s; however, for several years, the technology was not sufficiently available to have a substantial impact on sex ratio at birth at the population level [49].
Children's birth cohort, defined by the year and month of birth, was used to approximate the key explanatory variable of maternal famine exposure status. The 36 single-month birth cohorts born between January 1959 and December 1961 represented the directly exposed group and the remaining cohorts composed of the unexposed group. To partial out the influence of changes in cohort composition, the analysis also controlled for variables including birth order, mother's age at childbirth, mother's education, ethnicity (ethnic Han versus others), place of residence (urban versus rural) and province.
To identify the number and location of break points at which significant deviations from the long-term secular linear trend in sex ratio at birth occurred, the current study relied on linear splines logistic regression models of the following form:
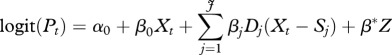 |
2.1 |
where Pt denotes the probability of having male births, Xt denotes the birth cohort, expressed as year and month of birth starting with Xt = September 1929, Sj denotes the location (year and month) of the jth break point and Dj denotes a set of dummy variables with values of 0 before reaching the designated break point Sj and a value of 1 thereafter. The intercept, α0, represents the log odds of the probability of having a male birth for the year and month zero, which is outside the relevant value range and is thus not meaningful. Its only purpose is to help define the regression line for the period between the initial point (September 1929) and the first break point. Whereas β0 represents the slope of change in the log odds of Pt for the period between September 1929 and the first break point, βj represents additional change to the slope coefficient added by the period between the (j−1)th and the jth break points. Z represents a vector of control variable and β* denotes their coefficients.
The sandwich robust estimator was used to correct for the possible clustering effect induced by the fact that each woman may have multiple children [50].
Unlike some of the more sophisticated alternatives, the linear spline regression model (as depicted in equation (2.1)) does not automatically produce an estimate of the globally optimal number or location of break points. Rather, these parameters are obtained through an iterative process of estimating and comparing a large number of models with different initially assigned break points. The main advantages of this approach are simplicity and robustness, as it is easy to implement with the existing software and can achieve robust results when other methods fail. The iterative model selection procedure relies on the following propositions [31]: (i) the linear effect model (i.e. model with zero break points) is nested in linear spline models (i.e. a model with one or more break points) and (ii) spline models with K break points are nested in spline models with these same K break points plus additional ones. Given these propositions, the likelihood-ratio tests can be used to determine the presence, number and location of statistically significant break points, given a set of initial values for the break points. Models with different sets of initial values for break points are generally not nested in one another; therefore, the likelihood-ratio test is not applicable. However, Akaike information criteria (AIC) can be used to choose between these non-nested models [51].
The following estimation and model selection procedures were used to identify the globally optimal number and locations of break points at which significant deviations from the long-term secular trend in sex ratio at birth occurred [52]: (i) define n = 1, 2, 3, … N(N > 20) equally spaced break points; (ii) for each of these N sets of initially defined break points, estimate all possible linear spline logistic regression models with n or less break points, and identify the optimal number of break points using likelihood-ratio test; (iii) choose the globally optimal number of break points from these N locally optimal number of break points (i.e. given the initially assigned break points) based on AIC. This process is time-consuming; however, some of the operations can be automated by the user-contributed command ‘mvrs’ in the statistical software Stata [52].
For comparison purposes, the results from two dummy variable regression models comparing single-year cohort difference in sex ratio at birth among the cohorts born before, during and after the famine are also included in the appendix, table 3.
3. Results
Figure 1 shows the number of births in each month between September 1929 and July 1982 recorded in the data. The very small number of births in the 1930s and earlier is an artefact of the sample selection criteria employed in the 1982 one-per-thousand fertility survey because the oldest women in the sample, those who were 67 in 1982, were only 14 in 1929. The upward trend in the number of births in the 1930s, 1940s and 1950s were driven by the fact that more and more women in the sample grew up and became reproductively active. Similarly, the downward trend in the number of births in the 1970s and after were driven by the fact that more and more women in the sample grew old and ceased to be reproductively active. The sudden and unexpected decline in the number of births around 1960, however, cannot be explained by changes in the number of women of reproductive age. Instead, it suggests that the Great Leap Forward Famine had a significant fertility-inhibiting effect.
Figure 1.

Total number of births in each month between 1929 and 1982 to women in the 1982 one-per-thousand fertility survey.
Figure 2 reports the monthly trend in the proportion of male births. To ensure the legibility of the figure, the very early cohorts with a small number of births were excluded from figure 2. The solid line, which was produced by non-parametric local polynomial smoothing method [53], suggests that the proportion of male births increased in the first half of the 1950s, reached the peak level around 1958, then began to decline; the decline stopped around 1963, then followed by a gradual increase. The timing of the decline in the proportion of male births coincides with the timing of the Great Leap Forward Famine, suggesting that women during the famine were less likely to give birth to sons.
Figure 2.

Proportion of male births among babies born to women in the 1982 one-per-thousand fertility survey. Open circle, observed; solid line, smoothed.
Table 1 reports model selection information from 38 linear spline logistic regression models. The first column of the table reports the initial number of equally spaced break points; the second column reports the locally optimal (i.e. given the initial values) number of break points based on the results of likelihood-ratio test; the third column reports the locations of the identified break points; and the fourth column reports the associated AIC values. The baseline model with no break point yielded an AIC value of 1 149 329. This value was higher than that in any other models with break points, suggesting that the linear trend model fits the data poorly, and significant deviations from the long-term secular trend in sex ratio at birth do exist. Among the models listed in table 1, AIC indicates that the best-fit model began with 90 equally spaced break points (AIC = 1 149 308), followed by the model that began with 19 and 100 equally spaced break points (AIC = 1 149 309). All of the best-fit models resulted in three break points based on the likelihood-ratio test and were relatively close together.
Table 1.
Model comparison of linear spline logistic regression models on the sex of offspring with different numbers and locations of break points.
| no. of break points |
location of break points | AIC | |
|---|---|---|---|
| initial | final | ||
| 0 | 0 | — | 1 149 329 |
| 1 | 1 | 07/1965 | 1 149 316 |
| 2 | 1 | 07/1970 | 1 149 320 |
| 3 | 1 | 07/1965 | 1 149 316 |
| 4 | 1 | 08/1962 | 1 149 315 |
| 5 | 1 | 07/1965 | 1 149 316 |
| 6 | 3 | 03/1951, 06/1957, 05/1963 | 1 149 310 |
| 7 | 1 | 07/1965 | 1 149 316 |
| 8 | 2 | 03/1959, 10/1963 | 1 149 314 |
| 9 | 2 | 11/1957, 08/1962 | 1 149 313 |
| 10a | — | — | — |
| 11 | 1 | 01/1963 | 1 149 315 |
| 12 | 1 | 04/1964 | 1 149 314 |
| 13 | 2 | 05/1960, 05/1963 | 1 149 313 |
| 14 | 1 | 06/1964 | 1 149 315 |
| 15 | 1 | 08/1963 | 1 149 314 |
| 16 | 1 | 09/1964 | 1 149 315 |
| 17 | 1 | 10/1963 | 1 149 314 |
| 18 | 1 | 03/1963 | 1 148 315 |
| 19 | 3 | 01/1960, 12/1963, 07/1965 | 1 149 309 |
| 20a | — | — | — |
| 21 | 3 | 08/1959, 01/1964, 07/1965 | 1 149 310 |
| 22 | 1 | 07/1963 | 1 149 314 |
| 23 | 1 | 03/1964 | 1 149 314 |
| 24 | 2 | 07/1960, 09/1963 | 1 149 313 |
| 25 | 2 | 03/1958, 04/1964 | 1 149 314 |
| 30 | 1 | 06/1963 | 1 149 314 |
| 40 | 2 | 01/1960, 12/1963 | 1 149 314 |
| 50 | 1 | 09/1963 | 1 149 314 |
| 60 | 1 | 12/1963 | 1 149 314 |
| 70 | 1 | 10/1963 | 1 149 314 |
| 80 | 1 | 12/1963 | 1 149 314 |
| 90 | 3 | 04/1960, 10/1963, 07/1965 | 1 149 308 |
| 100 | 3 | 01/1960, 12/1963, 03/1965 | 1 149 309 |
aThe model cannot be estimated given the initial number and location of change points.
Further model selection exercises suggested that the AIC value of 1 149 308 is the lowest possible value that could be achieved from these data; therefore, the linear spline model beginning with 90 equally spaced break points yielded the best-fit model. Based on this model, three break points located in April 1960, October 1963 and July 1965 were identified. Table 2 reports break point coefficients from the best-fit model in the form of estimated difference in the slope of the regression lines before and after the break points. Between September 1929 and April 1960, the log odds of having a male birth gradually decreased at a rate of 0.00011 per month. The trend of having a male birth changed significantly, however, between April 1960 and October 1963, as the log odds of having a male birth declined rapidly at a rate of 0.00103 (i.e., (−0.00011) + (−0.00092)) per month. The coefficients for the other two periods can be interpreted similarly.
Table 2.
Estimated slope and changes in slope from the preceding interval based on the best-fit linear spline logistic regression on the sex of offspring (n = 830 045). Model adjusted for province, ethnicity, maternal education, place of residence, maternal age and birth order.
| slope (first row) and changes in slope (other rows) in log odds ratio | 95% CI | |
|---|---|---|
| 1929–04/1960 | −0.00011 | [−0.00021, −0.00001] |
| 04/1960–10/1963 | −0.00092 | [−0.00153, −0.00030] |
| 10/1963–07/1965 | 0.00246 | [0.00094, 0.00399] |
| 07/1965–1982 | −0.00139 | [−0.00251, −0.00028] |
Results from spline models are best presented by plotting the predicted values. Figure 3 shows the predicted proportion of male births and associated 95% confidence intervals (CIs) produced by the best-fit model reported in table 2. As shown in figure 3, the proportion of male births gradually declined between before April 1960 from 0.527 to 0.521. In April 1960 (over a year after the Great Leap Forward Famine began), the proportion of male births began to show an abrupt decline from 0.521 in April 1960 to 0.510 in October 1963. More specifically, the decline in the proportion of male births that occurred between April 1960 and October 1963 (42 months) exceeded the total decline that occurred between September 1929 and April 1960 (approx. 370 months). The rapid decline in the proportion of male births ended in October 1963, roughly 2 years after the famine ended, and was followed by a sudden compensatory increase. In less than 2 years, the proportion of male births rose from 0.510 to 0.518, approaching the pre-famine level. This compensatory increase ended in July 1965 and was followed by a long-term gradual increase, leading to a proportion of male births of 0.520 in 1982.
Figure 3.

Predicted monthly trend in the proportion of male births among babies born to women in the 1982 one-per-thousand fertility based on the best-fit linear spline logistic regression model. Solid line, predicted value; dashed line, 95% CI.
The V-shaped curve, as shown in figure 3, confirms the descriptive findings shown in figure 2. The sudden decline in the proportion of male births in April 1960 occurred to those who were conceived around July 1959, half a year after the famine began. This result suggests that the response to famine-induced malnutrition was triggered only after the adverse effect accumulated to a certain level. Similarly, given that the proportion of male births rebounded in October 1963 (being observed for those who were conceived in January 1963, approximately a year after the famine ended), a similar conclusion could be reached. The 1 year lag between the end of the famine and the beginning of the compensatory increase may indicate the amount of time it took for most women to recover fully from the famine and reach a normal body condition, for which they were expected to produce a similar sex ratio at birth as before the famine.
It is informative to compare results from break-point analysis against results from dummy variable regression models, as reported in the appendix, table 3. The unadjusted model in the appendix, table 3 included single year birth cohort as the only explanatory variable, whereas the adjusted model also included a number of control variables, including province, ethnicity, maternal education, place of residence, maternal age and birth order. The two models yielded consistent results with only the following exception: the difference in the odds of having a male birth between the 1962 cohort and the 1956 reference cohort was statistically non-significant in the unadjusted model but was statistically significant in the adjusted model. These results agree with the results of break-point analysis. Without knowing the overall trend and the V-shaped pattern in the proportion of male births obtained from break-point analysis, it is not intuitive to explain why the 1962, 1963 and 1964 birth cohorts (who were born after the famine) had a statistically significant lower level of odds of having a male birth but the 1959, 1960 and 1961 birth cohorts (who were born during the famine) did not.
4. Discussion
This study identified a V-shaped pattern in the sex ratio at birth around the time of the Chinese Great Leap Forward Famine. The fact that (i) only three break points in the long-term trend in the sex ratio at birth in China between September 1929 and July 1982 (635 single month birth cohorts in total) were identified and (ii) the identified break points closely matches the timing of the 1959–1961 Great Leap Forward Famine suggests that the famine-induced variation in maternal nutritional condition is likely to be the primary cause for the abrupt changes in sex ratio at birth around that short period of time.
That the abrupt decline in the proportion of male births first occurred to those who were conceived more than half a year after the famine began suggests that the earlier studies based on the Dutch Hunger Winter and Leningrad Siege failed to recover consistent evidence regarding the relationship between maternal famine exposure and offspring sex ratio at birth because the duration of the famines was insufficient. These famines either never reached the first break point at which the sex ratio began to decline drastically (in the Leningrad Siege case) or barely reached the first break point and ended before the change became detectable (in the Dutch Hunger Winter case). Furthermore, it is possible that more time would be required to observe the adaptive sex ratio adjustment effects in these other famine contexts because the severity of these famines was much less than that of the Great Leap Forward Famine in China.
This study has several limitations. First, it uses retrospective fertility history information, which is subject to under-reporting and recall bias. However, as discussed above, because giving birth is a significant event in a woman's life, recall bias is much less of a concern. Although sex differential under-reporting of birth is a known phenomenon in China, there is no compelling reason to believe that the pattern of under-reporting changed so drastically during the short period of time around the Great Leap Forward Famine that it produced the V-shaped curve in the proportion of male births presented in figure 3.
Second, the results reported in this study are consistent with both the TW hypothesis and the Myers hypothesis. Unfortunately, owing to data limitation, it is impossible to conduct further tests to identify the exact evolutionary mechanism that has produced the observed relationship between famine exposure and changes in sex ratio at birth.
Third, also owing to data limitation, the current study cannot directly assess whether the famine-induced changes in sex ratio at birth occur around the time of conception (i.e. selective fertilization) or at later gestational stages (i.e. selective attrition). While selective fertilization is clearly adaptive in nature [54], selective attrition is not necessarily so. To be more specific, the reason why male foetuses have a lower chance to survive during the famine could simply be that they are more vulnerable to adverse environmental conditions [55,56]. Indirect evidence suggests that, however, this is unlikely to be the case here. Earlier study shows that the famine-induced increase in foetal attrition began in 1959 and ended in 1962 [57], which means that: (i) the increase in foetal attrition in 1959 did not cause an immediate change in sex ratio at birth, and (ii) the observed changes in sex ratio at birth in 1962–1965 were not caused by changes in foetal attrition. In other words, although selective foetal attrition may have played a role in shaping the sex ratio at birth among the 1960–1961 birth cohorts, selective attrition alone cannot explain the changes in sex ratio at birth in the 1962–1965 cohorts. Future studies should focus on the relationship between changes in foetal attrition and changes in sex ratio at birth directly to assess the relative importance of famine-induced selective attrition in producing the observed changes in sex ratio at birth.
In conclusion, this study provides empirical evidence suggesting that the 1950–1961 Great Leap Forward in China led to a decrease in the proportion of male births during the period. Such results support the adaptive sex ratio adjustment hypothesis that mothers in good condition are more likely to give birth to sons, whereas mothers in poor condition are more likely to give birth to daughters.
Acknowledgements
This study is derived from a Chinese Academy of Social Sciences (CASS) key research project entitled ‘The Past, Present, and Future Pattern of Sex Ratio at Birth in China—Some Policy Implications’. I obtained the data from the State Family Planning Commission (SFPC) through CASS for the purpose of this project. I thank both SFPC and CASS for their support to the project. I also thank Queens College, City University of New York for their support during manuscript preparation. I am grateful for the constructive comments and suggestions made by the editor and three anonymous reviewers of Proceedings of the Royal Society B. All remaining errors are mine.
Appendix A
Table 3.
Estimated cohort difference in sex ratio at birth near the time of the Chinese Great Leap Forward Famine as estimated from the 1982 one-per-thousand fertility survey data.
| n | male (%) | sex ratio | unadjusted |
adjusteda |
|||
|---|---|---|---|---|---|---|---|
| odds ratio | 95% CIb | odds ratio | 95% CI | ||||
| 1956c | 20 296 | 52.41 | 1.101 | — | — | — | — |
| 1957 | 23 205 | 52.74 | 1.116 | 1.006 | 0.988–1.020 | 1.006 | 0.990–1.022 |
| 1958 | 21 217 | 52.18 | 1.091 | 0.995 | 0.978–1.010 | 0.995 | 0.975–1.010 |
| 1959 | 16 697 | 51.70 | 1.070 | 0.986 | 0.968–1.010 | 0.986 | 0.966–1.010 |
| 1960 | 15 915 | 52.34 | 1.098 | 0.999 | 0.975–1.020 | 0.999 | 0.980–1.020 |
| 1961 | 13 447 | 51.99 | 1.083 | 0.992 | 0.971–1.010 | 0.991 | 0.972–1.010 |
| 1962 | 24 900 | 51.60 | 1.066 | 0.984 | 0.966–1.000 | 0.983* | 0.968–0.999 |
| 1963 | 31 528 | 51.24 | 1.051 | 0.978** | 0.961–0.994 | 0.976** | 0.959–0.992 |
| 1964 | 26 497 | 51.24 | 1.051 | 0.978** | 0.962–0.993 | 0.976** | 0.958–0.993 |
| 1965 | 26 578 | 51.83 | 1.076 | 0.989 | 0.971–1.010 | 0.987 | 0.972–1.000 |
| 1966 | 28 049 | 51.81 | 1.075 | 0.989 | 0.973–1.000 | 0.986 | 0.971–1.000 |
aAdjusted for province, ethnicity, maternal education, place of residence, maternal age and birth order.
b95% CIs were calculated using the bootstrap method.
cThe reference category is the 1956 birth cohort.
*p < 0.05.
**p < 0.01.
References
- 1.Trivers R. L., Willard D. E. 1973. Natural selection of parental ability to vary the sex ratio of offspring. Science 179, 90–92 10.1126/science.179.4068.90 (doi:10.1126/science.179.4068.90) [DOI] [PubMed] [Google Scholar]
- 2.Myers J. H. 1978. Sex ratio adjustment under food stress: maximization of quality or numbers of offspring? Am. Nat. 112, 381–388 10.1086/283280 (doi:10.1086/283280) [DOI] [Google Scholar]
- 3.Pollet T. V., Fawcett T. W., Buunk A. P., Nettle D. 2009. Sex-ratio biasing towards daughters among lower-ranking co-wives in Rwanda. Biol. Lett. 5, 765–768 10.1098/rsbl.2009.0394 (doi:10.1098/rsbl.2009.0394) [DOI] [PMC free article] [PubMed] [Google Scholar]
- 4.Cameron E. Z. 2004. Facultative adjustment of mammalian sex ratios in support of the Trivers–Willard hypothesis: evidence for a mechanism. Proc. R. Soc. Lond. B 271, 1723–1728 10.1098/rspb.2004.2773 (doi:10.1098/rspb.2004.2773) [DOI] [PMC free article] [PubMed] [Google Scholar]
- 5.Bereczkei T., Dunbar R. I. M. 1997. Female-biased reproductive strategies in a Hungarian Gypsy population. Proc. R. Soc. Lond. B 264, 17–22 10.1098/rspb.1997.0003 (doi:10.1098/rspb.1997.0003) [DOI] [Google Scholar]
- 6.Almond D., Edlund L. 2007. Trivers–Willard at birth and one year: evidence from US natality data 1983–2001. Proc. R. Soc. B 274, 2491–2496 10.1098/rspb.2007.0524 (doi:10.1098/rspb.2007.0524) [DOI] [PMC free article] [PubMed] [Google Scholar]
- 7.Grant V. J. 1996. Sex determination and the maternal dominance hypothesis. Hum. Reprod. 11, 2371–2375 [DOI] [PubMed] [Google Scholar]
- 8.Andersson R., Bergström S. 1998. Is maternal malnutrition associated with a low sex ratio at birth? Hum. Biol. 70, 1101–1106 [PubMed] [Google Scholar]
- 9.Cramer J., Lumey L. 2011. Maternal preconception diet and the sex ratio. Hum. Biol. 82, 103–107 10.3378/027.082.0106 (doi:10.3378/027.082.0106) [DOI] [PubMed] [Google Scholar]
- 10.Mathews F., Johnson P. J., Neil A. 2008. You are what your mother eats: evidence for maternal preconception diet influencing foetal sex in humans. Proc. R. Soc. B 275, 1661–1668 10.1098/rspb.2008.0105 (doi:10.1098/rspb.2008.0105) [DOI] [PMC free article] [PubMed] [Google Scholar]
- 11.Meikle D., Thornton M. 1995. Premating and gestational effects of maternal nutrition on secondary sex ratio in house mice. J. Reprod. Fertil. 105, 193–196 10.1530/jrf.0.1050193 (doi:10.1530/jrf.0.1050193) [DOI] [PubMed] [Google Scholar]
- 12.Rosenfeld C. S., Roberts R. M. 2004. Maternal diet and other factors affecting offspring sex ratio: a review. Biol. Reprod. 71, 1063–1070 10.1095/biolreprod.104.030890 (doi:10.1095/biolreprod.104.030890) [DOI] [PubMed] [Google Scholar]
- 13.Stein A. D., Barnett P. G., Sellen D. W. 2004. Maternal undernutrition and the sex ratio at birth in Ethiopia: evidence from a national sample. Proc. R. Soc. Lond. B 271(Suppl. 3), S37–S39 10.1098/rsbl.2003.0086 (doi:10.1098/rsbl.2003.0086) [DOI] [PMC free article] [PubMed] [Google Scholar]
- 14.Stein A. D., Zybert P. A., Lumey L. 2004. Acute undernutrition is not associated with excess of females at birth in humans: the Dutch Hunger Winter. Proc. R. Soc. Lond. B 271(Suppl. 4), S138–S141 10.1098/rsbl.2003.0123 (doi:10.1098/rsbl.2003.0123) [DOI] [PMC free article] [PubMed] [Google Scholar]
- 15.Williams R. J., Gloster S. P. 1992. Human sex ratio as it relates to caloric availability. Biodemogr. Soc. Biol. 39, 285–291 10.1080/19485565.1992.9988823 (doi:10.1080/19485565.1992.9988823) [DOI] [PubMed] [Google Scholar]
- 16.Rutstein A., Slater P., Graves J. 2004. Diet quality and resource allocation in the zebra finch. Proc. R. Soc. Lond. B 271(Suppl. 5), S286–S289 10.1098/rsbl.2003.0154 (doi:10.1098/rsbl.2003.0154) [DOI] [PMC free article] [PubMed] [Google Scholar]
- 17.Bradbury R., Blakey J. 1998. Diet, maternal condition, and offspring sex ratio in the zebra finch, Poephila guttata. Proc. R. Soc. Lond. B 265, 895–899 10.1098/rspb.1998.0375 (doi:10.1098/rspb.1998.0375) [DOI] [Google Scholar]
- 18.Kilner R. 1998. Primary and secondary sex ratio manipulation by zebra finches. Anim. Behav. 56, 155–164 10.1006/anbe.1998.0775 (doi:10.1006/anbe.1998.0775) [DOI] [PubMed] [Google Scholar]
- 19.Gibson M. A., Mace R. 2003. Strong mothers bear more sons in rural Ethiopia. Proc. R. Soc. Lond. B 270(Suppl. 1), S108–S109 10.1098/rsbl.2003.0031 (doi:10.1098/rsbl.2003.0031) [DOI] [PMC free article] [PubMed] [Google Scholar]
- 20.Cagnacci A., Renzi A., Arangino S., Alessandrini C., Volpe A. 2004. Influences of maternal weight on the secondary sex ratio of human offspring. Hum. Reprod. 19, 442–444 10.1093/humrep/deh071 (doi:10.1093/humrep/deh071) [DOI] [PubMed] [Google Scholar]
- 21.Clarke K. A. 2005. The phantom menace: omitted variable bias in econometric research. Conflict Manage. Peace Sci. 22, 341–352 10.1080/07388940500339183 (doi:10.1080/07388940500339183) [DOI] [Google Scholar]
- 22.Murnane R. J., Willett J. B. 2011. Methods matter: improving causal inference in educational and social science research. New York, NY: Oxford University Press [Google Scholar]
- 23.Meyer B. D. 1995. Natural and quasi-experiments in economics. J. Business Econ. Stat. 13, 151–161 [Google Scholar]
- 24.Antonov A. 1947. Children born during the siege of Leningrad in 1942. J. Pediatr. 30, 250–259 10.1016/S0022-3476(47)80160-X (doi:10.1016/S0022-3476(47)80160-X) [DOI] [PubMed] [Google Scholar]
- 25.Roseboom T. J., Van der Meulen J. H. P., Ravelli A. C. J., Osmond C., Barker D. J. P., Bleker O. P. 2001. Effects of prenatal exposure to the Dutch famine on adult disease in later life: an overview. Mol. Cell. Endocrinol. 185, 93–98 10.1016/S0303-7207(01)00721-3 (doi:10.1016/S0303-7207(01)00721-3) [DOI] [PubMed] [Google Scholar]
- 26.Jongbloet P. H., Zielhuis G. A., Groenewoud H., Pasker-De Jong P. 2001. The secular trends in male: female ratio at birth in postwar industrialized countries. Environ. Health Perspect. 109, 749–752 10.1289/ehp.01109749 (doi:10.1289/ehp.01109749) [DOI] [PMC free article] [PubMed] [Google Scholar]
- 27.Grech V., Vassallo-Agius P., Savona-Ventura C. 2003. Secular trends in sex ratios at birth in North America and Europe over the second half of the 20th century. J. Epidemiol. Commun. Health 57, 612–615 10.1136/jech.57.8.612 (doi:10.1136/jech.57.8.612) [DOI] [PMC free article] [PubMed] [Google Scholar]
- 28.Greenland S. 1995. Dose–response and trend analysis in epidemiology: alternatives to categorical analysis. Epidemiology 6, 356–365 10.1097/00001648-199507000-00005 (doi:10.1097/00001648-199507000-00005) [DOI] [PubMed] [Google Scholar]
- 29.Muggeo V. M. R. 2003. Estimating regression models with unknown break points. Stat. Med. 22, 3055–3071 10.1002/sim.1545 (doi:10.1002/sim.1545) [DOI] [PubMed] [Google Scholar]
- 30.Czajkowski M., Gill R., Rempala G. 2008. Model selection in logistic joinpoint regression with applications to analyzing cohort mortality patterns. Stat. Med. 27, 1508–1526 10.1002/sim.3017 (doi:10.1002/sim.3017) [DOI] [PubMed] [Google Scholar]
- 31.Molinari N., Daures J. P., Durand J. F. 2001. Regression splines for threshold selection in survival data analysis. Stat. Med. 20, 237–247 10.1002/1097-0258(20010130)20:2<237::AID-SIM654>3.0.CO;2-I (doi:10.1002/1097-0258(20010130)20:2<237::AID-SIM654>3.0.CO;2-I) [DOI] [PubMed] [Google Scholar]
- 32.Marsh L., Cormier D. R. 2002. Spline regression models. Thousand Oaks, CA: Sage Publications [Google Scholar]
- 33.Kung J. K., Lin J. Y. 2003. The causes of China's Great Leap Famine, 1959–1961. Econ. Dev. Cultural Change 52, 51–73 10.1086/380584 (doi:10.1086/380584) [DOI] [Google Scholar]
- 34.Peng X. 1987. Demographic consequences of the Great Leap Forward in China's provinces. Popul. Dev. Rev. 13, 639–670 10.2307/1973026 (doi:10.2307/1973026) [DOI] [Google Scholar]
- 35.Dikötter F. 2010. Mao's Great Famine: the history of China's most devastating catastrophe, 1958–1962 . New York, NY: Walker & Co [Google Scholar]
- 36.Ashton B., Hill K., Piazza A., Zeitz R. 1984. Famine in China, 1958–61. Popul. Dev. Rev. 10, 613–645 10.2307/1973284 (doi:10.2307/1973284) [DOI] [Google Scholar]
- 37.Lin J. Y., Yang D. T. 2000. Food availability, entitlements and the Chinese famine of 1959–61. Econ. J. 110, 136–158 10.1111/1468-0297.00494 (doi:10.1111/1468-0297.00494) [DOI] [Google Scholar]
- 38.Song S. 2009. Does famine have a long-term effect on cohort mortality? Evidence from the 1959–1961 Great Leap Forward Famine in China. J. Biosoc. Sci. 41, 469–491 10.1017/S0021932009003332 (doi:10.1017/S0021932009003332) [DOI] [PubMed] [Google Scholar]
- 39.Song S. 2010. Mortality consequences of the 1959–1961 Great Leap Forward Famine in China: debilitation, selection, and mortality crossovers. Soc. Sci. Med. 71, 551–558 10.1016/j.socscimed.2010.04.034 (doi:10.1016/j.socscimed.2010.04.034) [DOI] [PubMed] [Google Scholar]
- 40.Song S., Wang W., Hu P. 2009. Famine, death, and madness: schizophrenia in early adulthood after prenatal exposure to the Chinese Great Leap Forward Famine. Soc. Sci. Med. 68, 1315–1321 10.1016/j.socscimed.2009.01.027 (doi:10.1016/j.socscimed.2009.01.027) [DOI] [PubMed] [Google Scholar]
- 41.Huang C., Li Z., Wang M., Martorell R. 2010. Early life exposure to the 1959–1961 Chinese famine has long-term health consequences. J. Nutr. 140, 1874–1878 10.3945/jn.110.121293 (doi:10.3945/jn.110.121293) [DOI] [PubMed] [Google Scholar]
- 42.Chen Y., Zhou L. A. 2007. The long-term health and economic consequences of the 1959–1961 famine in China. J. Health Econ. 26, 659–681 10.1016/j.jhealeco.2006.12.006 (doi:10.1016/j.jhealeco.2006.12.006) [DOI] [PubMed] [Google Scholar]
- 43.Mu R., Zhang X. 2010. Why does the Great Chinese Famine affect the male and female survivors differently? Mortality selection versus son preference. Econ. Hum. Biol. 9, 92–105 10.1016/j.ehb.2010.07.003 (doi:10.1016/j.ehb.2010.07.003) [DOI] [PubMed] [Google Scholar]
- 44.Lavely W., Lee J., Feng W. 1990. Chinese demography: the state of the field. J. Asian Stud. 49, 807–834 10.2307/2058237 (doi:10.2307/2058237) [DOI] [Google Scholar]
- 45.Coale A. J. 1984. Rapid population change in China, 1952–1982. Washington, DC: National Academy Press [Google Scholar]
- 46.Arnold F., Zhaoxiang L. 1986. Sex preference, fertility, and family planning in China. Popul. Dev. Rev. 12, 221–246 10.2307/1973109 (doi:10.2307/1973109) [DOI] [Google Scholar]
- 47.Coale A. J., Banister J. 1994. Five decades of missing females in China. Demography 31, 459–479 10.2307/2061752 (doi:10.2307/2061752) [DOI] [PubMed] [Google Scholar]
- 48.Scharping T. 2003. Birth control in China 1949–2000: population policy and demographic development. Longdon and New York: Routledge [Google Scholar]
- 49.Chu J. 2001. Prenatal sex determination and sex-selective abortion in rural central China. Popul. Dev. Rev. 27, 259–281 10.1111/j.1728-4457.2001.00259.x (doi:10.1111/j.1728-4457.2001.00259.x) [DOI] [Google Scholar]
- 50.White H. 1982. Maximum likelihood estimation of misspecified models. Econometrica: J. Econometr. Soc. 50, 1–25 [Google Scholar]
- 51.Akaike H. 1973. Information theory as an extension of the maximum likelihood principle. In Second International Symposium on Information Theory (eds Petrov B. N., Csaki F.), pp. 267–281 Budapest, Hungary: Akademiai Kiado [Google Scholar]
- 52.Royston P., Sauerbrei W. 2007. Multivariable modeling with cubic regression splines: a principled approach. Stata J. 7, 45–70 [Google Scholar]
- 53.Fan J. 1992. Design-adaptive nonparametric regression. J. Am. Stat. Assoc. 87, 998–1004 10.2307/2290637 (doi:10.2307/2290637) [DOI] [Google Scholar]
- 54.Cameron E. Z., Lemons P. R., Bateman P. W., Bennett N. C. 2008. Experimental alteration of litter sex ratios in a mammal. Proc. R. Soc. B 275, 323–327 10.1098/rspb.2007.1401 (doi:10.1098/rspb.2007.1401) [DOI] [PMC free article] [PubMed] [Google Scholar]
- 55.Davis D. L., Gottlieb M. B., Stampnitzky J. R. 1998. Reduced ratio of male to female births in several industrial countries. J. Am. Med. Assoc. 279, 1018–1023 10.1001/jama.279.13.1018 (doi:10.1001/jama.279.13.1018) [DOI] [PubMed] [Google Scholar]
- 56.Eriksson J. G., Kajantie E., Osmond C., Thornburg K., Barker D. J. P. 2010. Boys live dangerously in the womb. Am. J. Hum. Biol. 22, 330–335 [DOI] [PMC free article] [PubMed] [Google Scholar]
- 57.Cai Y., Wang F. 2005. Famine, social disruption, and involuntary fetal loss: evidence from Chinese survey data. Demography 42, 301–322 10.1353/dem.2005.0010 (doi:10.1353/dem.2005.0010) [DOI] [PubMed] [Google Scholar]