Abstract
Time-resolved cardiac imaging is particularly interesting in the interventional setting since it would provide both image guidance for accurate procedural planning and cardiac functional evaluations directly in the operating room. Imaging the heart in vivo using a slowly rotating C-arm system is extremely challenging due to the limitations of the data acquisition system and the high temporal resolution required to avoid motion artifacts. In this paper, a data acquisition scheme and an image reconstruction method are proposed to achieve time-resolved cardiac cone-beam computed tomography imaging with isotropic spatial resolution and high temporal resolution using a slowly rotating C-arm system. The data are acquired within 14 s using a single gantry rotation with a short scan angular range. The enabling image reconstruction method is the prior image constrained compressed sensing (PICCS) algorithm. The prior image is reconstructed from data acquired over all cardiac phases. Each cardiac phase is then reconstructed from the retrospectively gated cardiac data using the PICCS algorithm. To validate the method, several studies were performed. Both numerical simulations using a hybrid motion phantom with static background anatomy as well as physical phantom studies have been used to demonstrate that the proposed method enables accurate reconstruction of image objects with a high isotropic spatial resolution. A canine animal model scanned in vivo was used to further validate the method.
Index Terms: Cardiac cone-beam CT, compressed sensing, high temporal resolution, interventional imaging
I. Introduction
Cardiovascular disease (CVD) is the primary cause of death for both men and women in western civilization. The American Heart Association reported that CVD accounted for 33.6% of the deaths in the United States in 2007 [1]. In 2011, more than one million Americans are expected to experience an acute coronary event. Imaging techniques offering comprehensive assessment of anatomy, pathology, and function are often required for effective patient management. Cardiac diagnostic computed tomography (CT) angiography has recently emerged as a leading tool for the noninvasive assessment of coronary artery disease and the preprocedural planning of several cardiovascular interventions. However, generating fully 3D tomo-graphic images to verify and guide therapeutic interventions in the operating room remains a challenge. It is no exaggeration to say that high-quality, noninvasive cardiac imaging guidance is vitally important for safe and effective catheter-based interventions, specifically for preprocedural planning, intraprocedural guidance, and postprocedural follow-up.
Currently, the majority of catheter-based procedures are performed with X-ray fluoroscopic guidance (XRF) which offers reduced information due to mere 2D projection imaging. A major limitation when using standard XRF is poor depiction of complex 3D anatomic structures such as blood vessels and cardiac chambers. In response to this limitation, 3D imaging modalities such as magnetic resonance imaging (MRI), CT, 3D ultrasound, or electromagnetic navigation systems merged with XRF are currently under investigation [2]; however, accurate 3D-2D image registration remains difficult. Three major interventional applications deserve emphasis because they require superior image guidance: 1) percutaneous coronary artery intervention (PCI) for obstructive atherosclerosis, 2) pulmonary vein isolation (PVI) for paroxysmal atrial fibrillation [3]–[7], and 3) percutaneous intramyocardial stem cell injection for acute myocardial infarction. It is highly desirable that the same imaging platform be able to acquire high quality 3D tomographic images and also be able to default to real-time fluoroscopic mode to enable catheter-based interventions. Using such a platform, immediately acquired and automatically registered time-resolved 3D tomographic images could facilitate procedural guidance, and may ultimately reduce the overall ionizing radiation dose, as well as the dose of nephrotoxic iodinated contrast for certain interventions. In addition, preprocedural, intraprocedural, and postprocedural 3D cardiac cone-beam CT evaluation could be easily performed. Ideally, such an imaging platform should be based on current X-ray C-arm systems used in interventional suites.
A limiting factor is that the gantry rotation speed of current C-arm interventional X-ray systems is slow (3–10 s/rotation). Therefore, it prevents one from obtaining high quality tomo-graphic images provided that the conventional cardiac CT imaging paradigm [8] is used. Angiographic C-arm systems have been modified by several vendors to enable cone-beam CT data acquisitions, which provide soft tissue contrast for improved image guidance directly in the interventional suite. This represents a major advancement over the conventional rotational angiography data acquisition, where only high contrast iodine filled vessels are reconstructed. However, due to the slow gantry rotation speed, the C-arm cone-beam CT is primarily used in neuro-interventions and is difficult to apply during cardiac interventions.
Recently, an interesting data acquisition scheme [9] was explored as an attempt to address the need for tomographic imaging in cardiac interventions. In this scheme, multiple back-and-forth gantry rotations were combined with a multi-sector cardiac image reconstruction method to enable cardiac imaging. The preliminary results from numerical simulations and initial animal studies are promising. However, the prolonged data acquisition time increases the likelihood of loosing synchronization between the gantry rotation and the cardiac motion. As a result, data inconsistency for a given cardiac phase is exacerbated and final image quality is degraded. In order to combat the data inconsistency in the segmented data sets, a motion compensation method was also proposed for this data acquisition method [10], [11]. Further investigations are required to assess the final outcome of this method.
In this paper, an innovative cardiac C-arm cone beam CT imaging method is proposed. Instead of multiple sweeps of the C-arm gantry, cone-beam data are acquired using a single sweep over a short-scan angular range. This single rotation acquisition method eliminates the dead period in the multiple sweep acquisition scheme, where data acquisition stops before the rotation direction is reversed. This acquisition method does not require synchronization between the gantry rotation and the cardiac motion. The data acquisition method is coupled with an iterative image reconstruction algorithm called prior image constrained compressed sensing (PICCS) [12]. This method allows the user to narrow the cardiac window to achieve higher temporal resolution tomographic imaging. The proposed cardiac imaging method automatically enables the reconstruction of a time-resolved cone-beam CT road-map for cardiac intervention (i.e., a 4D volumetric imaging method). Clinically, the introduction of this method has the potential to eliminate the need for 3D-2D registration during procedures. This will be advantageous in terms of imaging system space and resource allocation, in addition to a more efficient patient throughput from a definitive diagnosis to a successful treatment.
PICCS has been applied to many medical imaging problems since its inception. In the interventional imaging field, it has been employed to offer 3D surgical guidance on a C-arm system from a tomosynthetic acquisition [13]. In the context of image-guided radiation therapy, PICCS was used to reconstruct streak-free 4D cone beam CT images from retrospectively-gated respiratory datasets [14]–[16]. In diagnostic CT imaging, it has been shown that PICCS enables an improvement in temporal resolution for cardiac CT imaging [17], [18] and also allows one to reduce the radiation dose imparted during multidetector CT scans [19], [20]. In neuro-interventional imaging, PICCS has been shown to reduce the radiation dose for 3D angiography on the C-arm system [21]. In dual energy CT imaging, the application of the PICCS algorithm reduces hardware constraints in kVp switching data acquisition [22]. PICCS was also formulated as a nonconvex objective function to moderately improve the potential undersampling factor [23], [24]. In this paper, based upon the limitation of the current C-arm cone-beam CT data acquisition system, a single sweep data acquisition protocol and a PICCS image reconstruction algorithm were combined to enable time-resolved cardiac cone-beam CT imaging in an interventional suite. The additional innovations of the current paper lie in the systematic quantitative evaluation performed with respect to reconstruction accuracy, noise level, and sharpness of moving objects. Furthermore, PICCS parameters are optimized in terms of these metrics.
The paper is divided as follows. The PICCS algorithm and its application to cardiac C-arm CT are described in Sections II-A and II-B, respectively. The methodological details of the evaluation studies are presented in Section II-C. The evaluation metrics are described in Section II-D. The results and discussion follow in Section III.
II. Methods and Materials
A. Brief Review of Prior Image Constrained Compressed Sensing
In recent years, the mathematical possibility of accurate signal and/or image restoration from much fewer samples than is required by the Nyquist–Shannon criterion has attracted considerable attention in information science, signal processing and medical imaging societies. The mathematical foundation is dubbed compressed sensing or compressive sampling (CS) [25]–[27]. In the CS framework, one attempts to store or acquire only the samples that are necessary to reconstruct a compressed version of a signal. The theory states that if a signal can be made sparse in a certain domain that is incoherent with the space in which the sampling is performed, then it is possible to reconstruct the signal accurately from few samples [25]–[27]. The necessary number of data samples for accurate restoration of an image depends on the actual sparsity of the image. The sparser an image is, the fewer data samples are required. In practice, the reconstruction can be done via a nonlinear minimization procedure
| (1) |
where is the reconstructed image with dimensions M × N stored in vector form; ψ is a transformation that sparsifies the image; in the case of CT, is a vector containing the projection dataset acquired using Nd detector elements and Nv projection view-angles; is the system matrix—essentially a forward projection in the case of CT.
The used in (1), defined as
| (2) |
is used to promote sparsity while offering a convex objective function, the minimization of which is tractable.
Although the CS theory is mathematically elegant, two aspects are worthy of emphasis in the context of practical medical imaging applications. The first one is the relevance of mathematical conditions introduced in the rigorous proof of the main conclusions of the CS theory [25]–[27]. In a real application in medical imaging, it is very challenging, if not impossible, to design a data acquisition method that completely satisfies the mathematical conditions of the CS theory. However, the relevance and significance of the CS framework in medical imaging has been achieved by a brute force application of norm minimization or its variants [28]–[33]. The research presented in this paper is also along the same lines. Namely, we focus on the empirical application of the CS method without pursuing the mathematical rigor of the CS theory itself. We are not concerned about whether the data acquisition scheme satisfies the restricted isometry property (RIP) condition. Second, for a real imaging system, a decrease in the number of data samples results in a degradation of noise properties. Thus, the signal to noise ratio (SNR) is fundamentally limited. For a specific application, when the number of data samples is decreased, alternative mechanisms are needed to compensate for the SNR deficit. The original CS method does not solve this physical problem explicitly.
Prior image constrained compressed sensing (PICCS) was developed [12] to address the aforementioned SNR deficit problem and attempt to achieve accurate image reconstruction from vastly undersampled datasets. Taking advantage of an available high-SNR prior image, i.e., an image that is similar to the image one wishes to reconstruct but has a higher SNR, the PICCS method allows the reconstruction to inherit a favorable noise level from the prior image. The inclusion of the prior image xp permits one to further sparsify the target image and thus to further reduce the number of samples to be acquired. Mathematically, the PICCS reconstruction of an image x̂ can be achieved by solving either a nonconstrained minimization [34], [35] or the following constrained minimization problem:
| (3) |
| (4) |
Essentially, this approach aims at minimizing the PICCS objective function fPICCS, while enforcing that the target image vector x to be consistent with the measured data vector y. The sensing system matrix A calculates the ray sum for each X-ray path through the object. The sparsifying transforms ψ1 and ψ2 used in this paper are both the of the local spatial gradient. This is equivalent to the discrete total variation (TV) [36]. Given , the discrete TV of an image vector can be defined as
| (5) |
which results in the objective function
| (6) |
The total variation has been shown to perform particularly well to reduce noise in piecewise-constant images [30], [36]–[42]. Medical images are only approximately piecewise constant, which sometimes results in “patchy” or “blocky” artifacts and an unnatural texture [32]. Within this particular implementation of the PICCS algorithm, the total variation is minimized for both the target image (x) and the difference image between the target and the prior image (x – xp) . Since the prior image is most often generated via an analytical reconstruction algorithm, such as filtered backprojection (FBP), its noise texture is “natural.” When the image is reconstructed using PICCS, the noise texture and noise level are shared with the target image due to the minimization of JTV(x – xp). This addresses the SNR deficit inherent to under-sampled reconstruction problems. To prevent undesired features of the prior image from being copied in the target image—e.g., insufficient temporal resolution in the prior image—the original CS reconstruction term JTV(x) is also included in the PICCS objective function. The relative weight of the two terms is controlled by the parameter , which can be selected depending on the application. A value of α = 0 is equivalent to TV-based compressed sensing. Note that in most clinical applications thus far investigated [13], [14], [17], [19], [21], [22], [43], [44], a value around 0.5 has often yielded acceptable results. In addition to the use of the α parameter in the PICCS objective function, the potential detrimental features of the prior image are further removed by enforcing the consistency of the image with the data (Ax = yconstraint).
In this paper, the PICCS optimization problem is solved iteratively using an alternating minimization procedure [12]. First, the objective function is minimized using the gradient descent algorithm [45], and then the data consistency is enforced using the simultaneous algebraic reconstruction technique (SART) [46]–[49]. The prior image can be used as a seed for the iterative procedure, which in most cases results in much faster convergence of the algorithm when compared with CS alone. One SART updating step is followed by 20 PICCS objective function minimization steps in this paper.
B. Data Acquisition Scheme and Work Flow of the Proposed Cardiac PICCS-CT Method
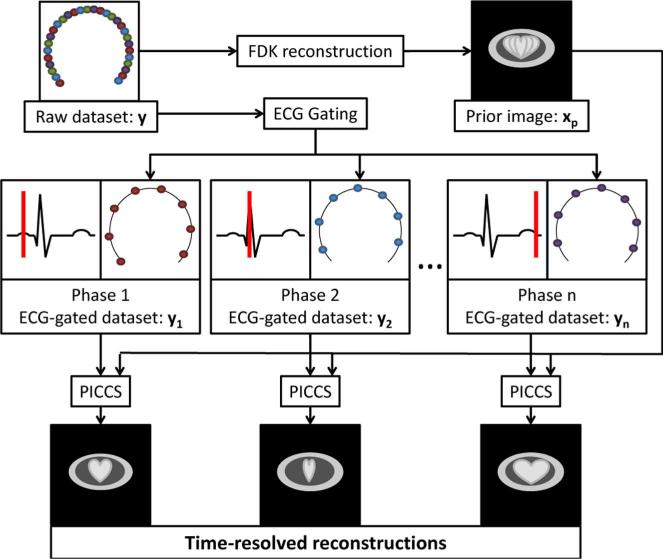
Interventional C-arm systems have a limited speed of rotation, which challenges the current cardiac CT paradigm of sub-second rotation time. The data acquisition scheme proposed in this research uses a single, 14-s rotation to acquire a complete dataset y over a short scan angular range. Projection data are retrospectively gated into different cardiac phases with the narrowest possible gating window. The dataset associated with each phase has about the same number of view angles as the number of heartbeats that occurred during the scan, between 15 and 25. This high level of undersampling would result in severe artifacts if the datasets were reconstructed using an analytical reconstruction algorithm such as filtered back-projection. In this work, the problem of reconstructing images from vastly undersampled data for each cardiac phase is solved by the PICCS algorithm. The prior image is reconstructed from the whole nongated projection dataset using the classical FDK algorithm [50]. The prior image does not suffer from undersampling artifacts, nor does it contain temporally-resolved information. The work flow of the reconstruction procedure is summarized in (Fig. 1).
Fig. 1.
Flowchart of the cardiac PICCS-CT algorithm. The dots in the raw dataset represent X-ray source positions where projections were acquired.
C. Validation Studies
Several experiments were performed to assess the ability of the proposed data acquisition and image reconstruction framework to produce time-resolved cardiac images. The experiments are separated into four categories: 1) numerical phantom, 2) hybrid phantom, 3) physical phantom, and 4) in vivo animal model.
1) Numerical Simulations
Two questions were studied using a numerical phantom.
Does the proposed data acquisition and PICCS-based reconstruction scheme enable recovery of cardiac motion in a simplified 2D numerical phantom for realistic acquisition parameters?
How do motion amplitude irregularities affect the image quality of the reconstructions?
The numerical phantom designed for this experiment contained two low-attenuation cavities which simulated lungs. These were surrounded by regions of medium attenuation simulating soft tissue and regions of high attenuation simulating bone. An ellipsoidal region was positioned within one of the lungs cavities to simulate the heart. The cardiac contraction is simulated by deforming the ellipsoid within a realistic range. See the appendix for the description of the numerical motion phantom.
The scan was simulated with a gantry rotation period of 14 s, during which 600 X-ray projection view angles were acquired. Simulated Poisson noise was added to projection data to simulate a count of 2.5 × 10⁴ photons per detector element. The projection data were retrospectively gated into 40 motion phases, each composed of 15 view angles. A prior image was reconstructed from the full 600-projection dataset using the standard filtered backprojection algorithm. The image matrix had a dimension of 512× 512 voxels, each (1 mm)3 in size.
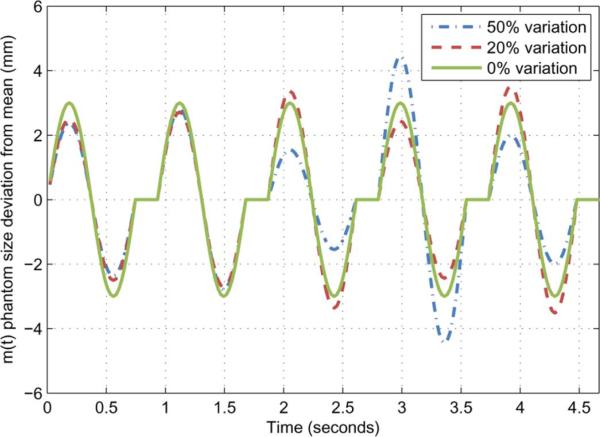
In clinical practice, irregularities in the cardiac motion are possible from one heart beat to the next. Within a single acquisition, it is possible that the heart experiences variations in both its contraction rate and amplitude. Irreproducible variations in the motion amplitude were simulated numerically by adding random changes in the programmed motion pattern for the entire simulated data acquisition. The level of random amplitude irregularities was varied from 10% to 50% (Fig. 14). Images were reconstructed using the PICCS algorithm from each simulated dataset. Variations in heart rates were studied in the in vivo animal experiments described below.
Fig. 14.
Example of deviation from the mean dimension m(t) for the numerical phantom. The amplitude deviation is randomnized for each simulated contraction.
2) Hybrid Numerical Motion Phantom With in Vivo Animal Background Anatomy
The questions which were studied using a hybrid phantom were the following.
Does the PICCS algorithm enable recovery of an object moving at a rate approximately equal to that of cardiac contractions from a 3D cone-beam projection dataset, while maintaining the image texture of the background anatomy?
What is the minimum number of view angles that should be acquired per cardiac phase to allow the motion to be accurately reconstructed?
How does the algorithm performance vary for different motion directions?
How do variations in the PICCS parameter α affect image quality?
One of the common issues with total-variation-based compressed sensing is the introduction of “blocky” or “patchy” artifacts within the reconstructed images. These artifacts, together with a generally overly-smooth texture, may interfere with the diagnostic value of images. In order to assess the impact of the PICCS algorithm on the texture of images, a hybrid phantom study similar to that presented in [18] was performed. The goal of such a study was to have an image with a natural background anatomy as well as an object moving with a known pattern.
A canine was scanned using a GE Innova 4100 (GE Health-care, Waukesha, WI). For the full imaging protocol refer to Section II-C-IV. An image volume was reconstructed using the FDK algorithm without gating and thus, without temporal information or undersampling artifacts. The image volume was then numerically forward projected and combined with the projection of a numerical motion phantom to generate projection data of the hybrid phantom.
The numerical motion phantom was a sphere with a diameter of 6 mm. Its motion pattern was linear and had a peak-to-peak amplitude of 9 mm. The rate of motion was programmed to result in a sampling level similar to that expected in the proposed data acquisition framework. Six rates were simulated: 21, 43, 60, 80, 120, and 180 bpm. Assuming a 14-s scan time, these rates translate into gated projection datasets with 5, 10, 14, 18, 28, and 42 view angles, respectively. The motion direction was varied between the axial direction (superior-inferior, parallel to the gantry axis of rotation) and the in-plane direction (right-left, perpendicular to the gantry axis of rotation).
The combination of the forward projected anatomical dataset ya and the motion phantom projection dataset ym was accomplished by element-wise addition to yield the hybrid projection dataset yh
| (7) |
The resulting dataset was gated and images were reconstructed using PICCS. To evaluate the effect of the PICCS α parameter, reconstructions were computed for α between 0.0 and 1.0 by 0.1 increments for the 14-view-angle projection dataset.
The resulting images were analyzed quantitatively to determine the accuracy of the motion recovery, the noise level, and the sharpness of the moving object. The texture of the underlying anatomy was evaluated qualitatively.
3) Physical Motion Phantom Experiments
The question studied in this section is the following: can the proposed data acquisition and image reconstruction framework accurately reconstruct a three-dimensional physical moving object from projections acquired using a clinical C-arm system?
In order to demonstrate this, a physical phantom was constructed. It consists of an acrylic cylinder surrounded by natural bones to simulate ribs. Natural vertebrae are positioned within the cylinder to mimic the spine. A 3-mm-diameter plastic rod mounted on a linear motion stage is positioned within the cylinder. The stage was programmed to move the rod in a periodic motion pattern over a distance of 8 mm within 0.8 s. The rod was oriented in the axial direction (superior-inferior) and its motion was in-plane (right-left).
The phantom was scanned using a GE Innova 4100 (GE Healthcare, Waukesha, WI). 420 projection view angles were acquired over 14 s and an angular range of 210°. The X-ray tube was set to deliver a current of 200 mA and a potential of 70 kVp over an exposure time of 5 ms/view with 0.3 mm Cu filtration. A passive listening data acquisition computer captured the raw projection data [51]. Reconstruction was done offline; the prior image was reconstructed from all 420 view-angles using the FDK algorithm. The projections were retrospectively gated into 25 temporal phases, each with a temporal window of 33 ms. 16 or 17 cone-beam projections were thus available for each temporal phase. The PICCS algorithm was used to reconstruct an image volume for each temporal phase. The image matrix was 320 × 320 × 160 with an isotropic voxel size of (0.5 mm)3.
The PICCS images produced were analyzed quantitatively to determine the accuracy of the motion recovery, the noise level, and the sharpness of the moving object.
4) In Vivo Animal Experiments
This section studies the following question: does the proposed framework enable the reconstruction of complex cardiac motion and anatomy using realistic scan parameters?
To study this question, an in vivo animal experiment was conducted. A canine was scanned using a GE Innova 4100 (GE Healthcare, Waukesha, WI) with the approval of the Institutional Animal Care and Use Committee (IACUC). The same data acquisition scheme used for the physical motion phantom study (Section II-C3) was used here. The reconstructed image matrix was isotropic and composed of 256 × 256 × 128 voxels of dimension (0.68mm)3. The reconstructed field of view had a diameter of 180 mm.
Radiation dose measurements were performed using the same X-ray tube technique parameters and acquisition protocol. A standard 16 cm acrylic phantom was used with a 0.6 cc Farmer ion chamber. One central and eight peripheral dose measurements were performed [52]. The volume CT dose index (CTDIvol) was calculated to be 5.7 mGy which is very low relative to diagnostic cardiac CT imaging.
The animal model that was used in this study was a one-year-old female beagle. The subject's weight was 9.8 kg and its heart rate averaged 95 bpm during the scan. A variation in heart rate of up to 10 bpm was observed during the scan. To enable cardiac chamber cone beam CT imaging, an intravenous contrast injection scheme was devised to obtain uniform opacification of the chambers. A total of 37 cc of iodixanol-320 (Visipaque, GE Healthcare, Waukesha, WI) was diluted in 113 cc of saline. The dilute contrast agent was injected over 30 s using an automated injector (Medrad, Warrendale, PA). The contrast agent was allowed to equilibrate for 2 min after the end of the injection and before the scan began.
The prior image was reconstructed using the FDK algorithm and the non-gated 420-view-angle dataset. The ECG signal was recorded during the acquisition and was used to gate the projection data retrospectively into 20 cardiac phases. Each gated projection dataset was composed of 20 or 21 projection view angles. View angles were artificially decimated to the limiting level of angular sampling determined in the hybrid phantom section. The PICCS algorithm was applied on each of these datasets to yield time-resolved volumetric (256 × 256 × 128) cardiac images with a voxel size of (0.68 mm)2.
D. Evaluation Metrics
1) Reconstruction Accuracy
The metric that was used to quantify the accuracy of the reconstruction over a region of interest (ROI) is the relative root mean squared error (rRMSE). For an image under study x, it is defined as
| (8) |
where xref is a reference image.
2) Noise Level
The metric that was used to quantify the level of noise in images was the standard deviation
| (9) |
where μ is the mean defined as
| (10) |
ROI is a set of image points in a uniform region, NROI is the number of points in the ROI.
3) Sharpness
In order to evaluate the performance of the PICCS algorithm when imaging moving objects, the blur of the an object was modeled as a convolution of a perfectly sharp and static object with a Gaussian kernel. In simulated datasets, it was possible to obtain a static reference image xref. This allows us to fit the reconstructed image with a shifted, rescaled and Gaussian blurred version of the reference image. The amount of shift and blurring can be used to evaluate the sharpness of the reconstructed images.
Specifically, for an image under study, x of dimension M × N, the model of the motion induced blur was quantified as follows.
1) Select a 1D linear segment ℓ through the object of interest in the image. The unit vector along ℓ is .
2) Solve the least squares problem
where i is the position in the image matrix, and is a multiplicative factor. The blurred image, , is the convolution of the static reference image (without motion blurring) with a normalized Gaussian function of width b and shifted by a distance d in the direction of the line segment ℓ
where Δ1 and Δ2 are the voxel dimension along the image horizontal and vertical axes. The values of b and d that solve the least squares problem above are used as metric of image sharpness. They are respectively referred to as pseudo point spread function width and shift for the rest of this paper.
One may consider the above procedure as the measurement of a pseudo point spread function (pseudo PSF) along the direction of the line segment ℓ. The directionality of the measurements enabled the evaluation of the blur of an object along several orientations.
The pseudo PSF is modeled as a symmetric blur; motion blur present in images may be asymmetric. While the pseudo PSF shift quantifies this effect to some extent, it is possible that the metrics slightly under- or overestimate the amount of blur when asymmetry is present. The results should be interpreted accordingly.
The calculation of the blur metrics was implemented using MATLAB (MathWorks, Natick, MA). The convolution was applied using the function imfilter and the least squares problem was solved using the function fmincon.
III. Results and Discussion
A. Numerical Simulations
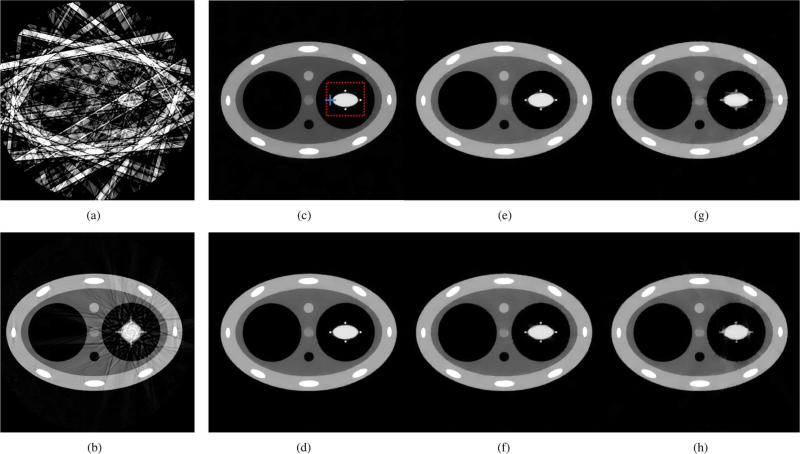
Reconstructions of the numerical phantom are presented in Fig. 2. The complete 600 view-angle dataset was used to reconstruct the prior image shown in Fig. 2(b). Significant blurring appeared around the dynamic heart-simulating region in this prior image and motion artifacts are clearly visible in the form of streaks emanating from the edges of the moving region. Furthermore, the projection data with various levels of amplitude irregularities were gated and reconstructed with FBP and PICCS algorithms. The images reconstructed using FBP suffered from a high level of streaking artifacts as seen in Fig. 2(a). The PICCS parameter α was set to 0.5. Notice that both the blurring of the deforming region and the streaking artifacts visible in the prior image are corrected in the PICCS reconstructions. However, as the level of amplitude irregularity is increased, the moving objects become increasingly blurred.
Fig. 2.
Reconstructions from numerically simulated datasets. The prior image shown was reconstructed using FBP. It was then used in the PICCS algorithm to reconstruct the five images at different motion phases of the phantom. 15 projection view angles were used in the FBP reconstruction (a) and in the PICCS reconstructions (c)–(h). The dotted red line marks the boudary of the ROI used for rRMSE measurements. The solid blue lines indicate the segments used for the pseudo PSF measurements. The display range is [0.01, 0.045] mm–1 . (a) FBP 0% variation. (b) Prior image 0% variation. (c) PICCS 0% variation. (d) PICCS 10% variation. (e) PICCS 20% variation. (f) PICCS 30% variation. (g) PICCS 40% variation. (h) PICCS 50% variation.
The images reconstructed using the PICCS algorithm were analyzed quantitatively. The results are presented in (Table I). As expected, the reconstructions became less accurate as the amplitude fraction irregularity increased. In this situation, the spatial resolution was also degraded as seen by the increase in the pseudo PSF width. It is only at the greatest level of irregularities (beyond 40% variations in amplitude) that the pseudo PSF shift reached a value beyond the voxel size of 1 mm . The noise spatial deviation was constant for the various irregularity levels, which was expected since there was no variation in the noise level of the data or in reconstruction parameters. It is possible to observe a increase of the pseudo PSF width parallel to the motion, and of the rRMSE when the level of irregularity is above 30%.
TABLE I.
Reconstruction Accuracy, Sharpness, and Noise Level Measurements for the Numerical Phantom Study
| Amplitude fraction irregularity (%) | Motion rate† (bpm) | View-angle sampling (view angles) | rRMSE (%) | Pseudo PSF width (mm) |
Pseu do PSF shift (mm) |
Noise standard deviation (10–3mm–1) | ||
|---|---|---|---|---|---|---|---|---|
| Parallel to motion | Perpendicular to motion | Parallel to motion | Perpendicular to motion | |||||
| 0 | 64 | 15 | 5.64 | 1.21 | 0.39 | 0.45 | 0.21 | 8.3 |
| 10 | 64 | 15 | 5.94 | 1.26 | 0.33 | 0.63 | 0.24 | 8.4 |
| 20 | 64 | 15 | 6.90 | 1.51 | 0.17 | 0.57 | 0.23 | 8.4 |
| 30 | 64 | 15 | 7.64 | 1.70 | 0.48 | 0.77 | 0.08 | 8.4 |
| 40 | 64 | 15 | 9.29 | 2.37 | 0.94 | 0.23 | 0.03 | 8.3 |
| 50 | 64 | 15 | 10.5 | 2.64 | 0.77 | 1.54 | 0.84 | 8.4 |
Assuming an acquisition time of 14 seconds.
Both the prior image and the reference images have noise standard deviations of 8.5 × 10⁻³ mm–1.
The ROI used for the rRMSE measurements and the line segments used to evaluate the pseudo PSF are shown in Fig. 2.
In summary, the numerical simulations demonstrate that the PICCS algorithm enables the reconstruction of deforming heart-like structures, even when the motion amplitude is nonreproducibly irregular.
B. Hybrid Numerical Motion Phantom With in Vivo Animal Background Anatomy
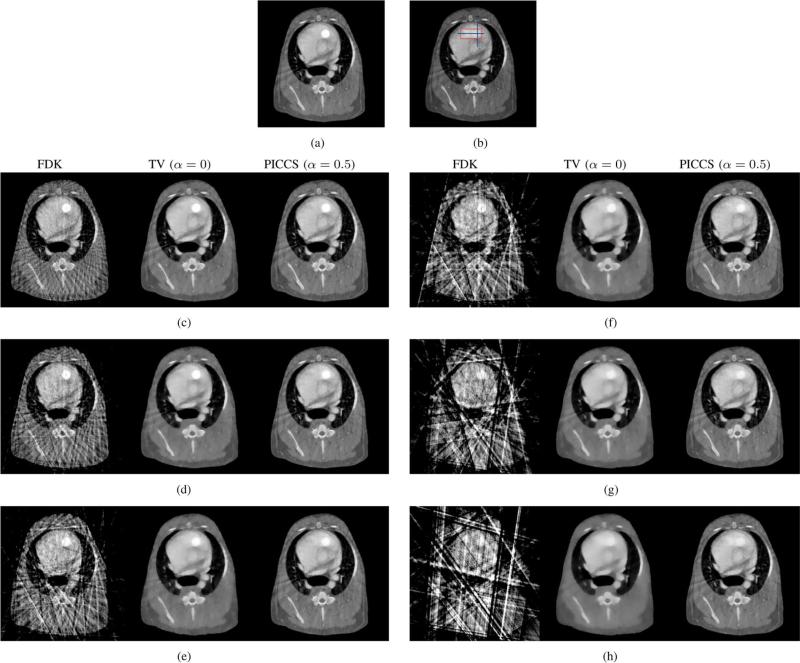
The reference and prior images for each of the motion patterns of the sphere—in-plane and axial—are shown in Figs. 3 and 4. Notice the visible motion blurring (path of the sphere) in the prior images.
Fig. 3.
Reconstructions of the hybrid phantom with axial motion using the FDK, TV-minimization, and PICCS algorithms. The boundaries of the ROIs used for the rRMSE measurements are symbolized by the dotted red line. The solid blue line segments were used for the pseudo PSF measurements. The display range is [0.01, 0.05]mm–1 . (a) Reference image (b) Prior image. (c) 42 view angles. (f) 14 view angles. (d) 28 view angles. (g) 10 view angles. (e) 18 view angles. (h) 5 view angles.
Fig. 4.
Reconstructions of the hybrid phantom with in-plane motion using the FDK, TV-minimization, and PICCS algorithms for the in-plane motion direction. The boundaries of the ROIs used for the rRMSE measurements are symbolized by the dotted red line. The solid blue line segments were used for the pseudo PSF measurements. The display range is [0.01, 0.05]mm–1 . (a) Perpendicular to in-plane motion 18 view angles. (b) Parallel to in-plane motion 18 view angles. (c) Perpendicular to axial motion 18 view angles. (d) Parallel to axial motion 18 view angles. (e) Perpendicular to in-plane motion 5 view angles. (f) Parallel to in-plane motion 5 view angles. (g) Perpendicular to axial motion. (h) Parallel to axial motion 5 view angles.
Images reconstructed using FDK, TV-minimization, and PICCS from gated projection datasets are presented in Fig. 3 for the axial direction, and in Fig. 4 for the in-plane direction. Each image triplet was reconstructed from a dataset with a different level of sampling.
In all cases, the FDK reconstructions were plagued by considerable streaking artifacts due to projection view angle under-sampling. This resulted in a high rRMSE (Table II), which was measured in an ROI which contained only the path of the motion phantom sphere. The noise level of the FDK reconstructions was not measured because the noise standard deviation would not have been meaningful due to the presence of streaks.
TABLE II.
Reconstruction Accuracy and Noise Standard Deviation Measurements for the Hybrid Phantom Study
| Motion direction | Motion rate† (bpm) | View-angle sampling (view angles) | rRMSE (%) |
Noise standard deviation (10–4 mm–1) |
|||
|---|---|---|---|---|---|---|---|
| FDK | TV | PICCS | TV | PICCS | |||
| Axial | 21 | 5 | 29.4 | 8.37 | 7.70 | 4.4 | 6.1 |
| 43 | 10 | 20.8 | 6.33 | 5.83 | 5.1 | 6.4 | |
| 60 | 14 | 16.1 | 5.53 | 4.46 | 5.5 | 6.6 | |
| 80 | 18 | 12.2 | 4.47 | 4.16 | 5.6 | 6.6 | |
| 120 | 28 | 9.39 | 3.63 | 3.54 | 5.7 | 6.6 | |
| 180 | 42 | 7.15 | 3.08 | 2.23 | 6.2 | 6.9 | |
| In plane | 21 | 5 | 21.0 | 6.85 | 6.57 | 4.3 | 6.4 |
| 43 | 10 | 15.7 | 5.15 | 5.01 | 5.0 | 6.5 | |
| 60 | 14 | 10.9 | 4.30 | 4.15 | 5.6 | 6.9 | |
| 80 | 18 | 8.92 | 3.76 | 3.57 | 5.7 | 6.8 | |
| 120 | 28 | 6.70 | 2.91 | 2.78 | 5.8 | 7.0 | |
| 180 | 42 | 5.17 | 2.14 | 2.05 | 6.0 | 7.2 | |
Assuming an acquisition time of 14 seconds.
Note that the rRMSE of the non-gated reconstruction (prior image) with respect to the reference is 10.1% (axial) and 8.19% (in plane).
The ROI used for the rRMSE measurements and the line segments used to evaluate the pseudo PSF are shown in Fig. 3 and 4.
Both the prior image and the reference image have noise standard deviations of 7.2 × 10⁻⁴ mm–1.
TV-minimization images did not suffer from streaking artifacts but all displayed high level of “patchy” artifacts. This leads to a loss in small-scale low contrast structures. This loss will be discussed later in this section in the discussion of the optimization of the PICCS α parameter. The loss was also quantified by a higher rRMSE (Table II) when compared to the PICCS reconstructions. The noise level of these reconstructions was relatively low due to the noise mitigating effect of TV-minimization. However, the potential improvement that this lower noise level could have yielded in terms of image quality was nullified by the presence of “patchy” artifacts. We concluded that the TV-minimization algorithm is not adequate to reconstruct images from projections at the undersampling levels studied.
The PICCS reconstructions did not suffer from streaking artifacts or from “patchy” artifacts. Small scale details were maintained. This greater accuracy was quantified by a reduction in rRMSE with respect to the TV-minimization images, particularly at low sampling levels. The noise level of the PICCS reconstructions was lower or equal to that of the prior image for all sampling levels.
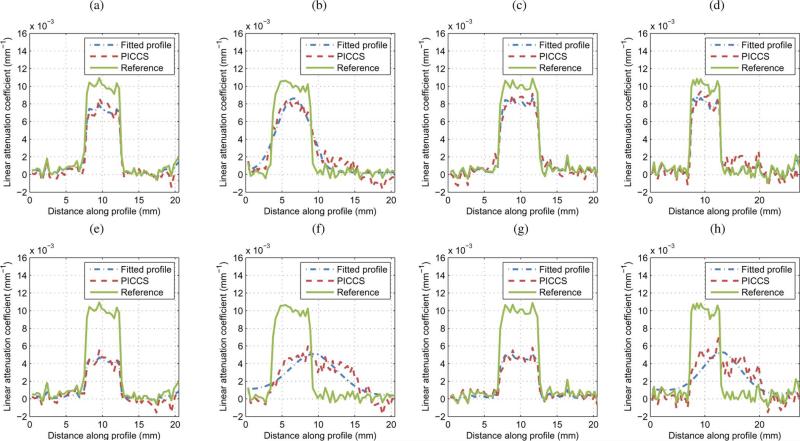
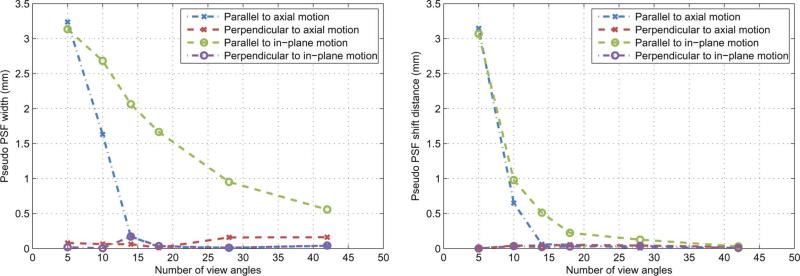
In order to determine a limiting number of projection view angles required for the PICCS algorithm to produce images of an acceptable quality, the reconstructions were analyzed in terms of the sharpness of the moving sphere. A few sample profiles through the reference images, PICCS reconstructions, and fitted Gaussian blurred images are presented in Fig. 5. As expected, the fitted profiles agreed well with the PICCS reconstructions. The pseudo PSF width and shift were measured for all sampling levels. The width is a metric of the spatial resolution for moving objects. The shift is a metric of displacement of the reconstructed object, which could be caused by retaining temporally inconsistent information. For each motion direction—in-plane and axial—the width and shift were measured parallel and perpendicular to the orientation of the phantom translation path. The results are plotted in Fig. 6. Both sharp ness metrics show an improvement with increasing number of view angles. This behavior is expected since an increase in the number of projection view angles allows the algorithm to better constrain the reconstruction. Note that only a small improvement is achieved by increasing projections view angles beyond 14. The only exception is for the pseudo PSF width parallel to in-plane motion. In the case of 14 view angles, the width of the Gaussian blurring kernel is about 2 mm which is 16% of the width of the reference image object. When the number of view angles increased to 42 view angles, the width of the blurring kernel shrinks down to 0.5 mm which is less than 10% of the width of the reference image object. Moreover, the amount of shift (Fig. 6) remains below the pixels size (0.68 mm) for the cases with view angle number above 14. Due to this negligible shift, the visual observation of the reconstructed moving object remains at the correct phyiscal location and the full-width at half-maximum (FWHM) measurements of the moving object is very close to the width of the reference image object when view angle number is above 14. This behavior is visible in the corresponding profile [Fig. 5(b)], where one can notice a loss in sharpness of the PICCS profile relative to the reference.
Fig. 5.
Sample profiles through reconstructions. Each plot shows the profile though the reference image and through the PICCS reconstruction with α = 0.5. Also plotted is the profile though the Gaussian blurred reference profile fitted to the PICCS reconstruction profile. The pseudo point spread function (PSF) width and shift were measured from the fitted profile. The line segments used are shown in Figs. 3 and 4.
Fig. 6.
Sharpness metrics as a function of the number of view-angles included in the reconstruction. There were measured for the moving sphere phantom in the directions parallel and perpendicular to the motion.
The accuracy of the reconstructions improved with increasing number of view angles. This is quantified by the rRMSE (Table II). Most of the improvement is observed below 14 projection view angles.
In summary, we conclude that the PICCS algorithm can accurately reconstruct the position of moving objects when more that 14 view angles are available. A loss of spatial resolution is observed in the direction parallel to the path of objects moving in-plane.
For systems such as the GE Innova 4100, the maximum frame rate is 30 f/s. A 14-s acquisition was used in order to acquire 420 projection view angles. This enabled the reconstructions of a prior image with minimal undersampling artifacts. Some current interventional systems have a maximal frame rate greater than 30 f/s. This has the potential to reduce the acquisition time.
Assuming that a good quality prior image is available, the requirement for 14 projection view angle per gated dataset translates into the number of heartbeats that occurred during the acquisition. Thus, we can calculate that the following regions of applicability based on acquisition time and heart rates (HR).
16-s acquisition: HR > 52.5 bpm.
14-s acquisition: HR > 60 bpm.
12-s acquisition: HR > 70bpm,
10-s acquisition: HR > 84 bpm.
8-s acquisition: HR > 105 bpm.
It may seem paradoxical that higher heart rates improve the temporal resolution and allow one to reduce the acquisition time. However, one must remember that it is the number of view-angle per gated dataset that limits the reconstruction sharpness. Note that there also exists an upper limit for the heart rate, beyond which the gating window is too long to offer an appropriate temporal resolution. However, this should not be a limitation in practice since heart rates in the interventional setting are seldom above 100 bpm. Because of this, we did not judge it relevant to perform an exhaustive study of this effect.
In order to study the effect of the PICCS α parameter on the reconstructed images, reconstructions were computed from α = 0 to 1.0 for the 14-view-angle dataset with the sphere moving axially. Axial and sagittal slices are shown in Fig. 7 for α = 0, 0.5, and 1.0. Notice the loss in small-scale structure in the TV-minimization image. The rRMSE of the reconstructions was measured within two regions of interest (ROI) (Table III). The “soft tissue ROI” included only static soft tissue structures in the dorsal region of the canine, which were accurately reconstructed in the prior image. The rRMSE in that region improved considerably for α > 0.5 and was optimal at α = 1.0; this was expected since at high , the reconstruction is maximally consistent with the prior image. The “cardiac ROI” contained only the volume within which the sphere was translated. The path of the sphere visible in the prior image was also visible in the PICCS reconstructions at high . The rRMSE within that ROI thus shows an optimal value between α = 0.5 and 0.8.
Fig. 7.
Reconstruction of the hybrid phantom with axial motion from 14-view-angle datasets for various levels of the PICCS parameter α. A sagittal view is shown on the first line and an axial view on the second. Arrows 1 and 4 indicate soft tissue structures that are lost in the α = 0 reconstruction but are present in and both α = 0.5 and α = 1.0 images. Arrows 2 and 5 show similar structures in the heart. Arrow 3 indicates the path of the motion phantom sphere that is visible in the prior image and is slightly visible in the reconstruction. The display range is [0.01, 0.05]mm–1.
TABLE III.
Reconstruction Accuracy, Noise Level, and Sharpness Measurements With Respect to Variation in PICCS Parameter α for the Hybrid Phantom Study
| Motion rate† (bpm) | View-angle sampling (view angles) | PICCS α | rRMSE (%) |
Noise standard deviation (10–4 mm–1) | Pseudo PSF width (mm) |
Pseudo PSF shift (mm) |
|||
|---|---|---|---|---|---|---|---|---|---|
| Soft tissue ROI | Cardiac ROI | Parallel to motion | Perpendicular to motion | Parallel to motion | Perpendicular to motion | ||||
| 60 | 14 | 0.0 | 2.50 | 5.53 | 5.4 | 0.06 | 0.03 | 0.00 | 0.00 |
| 0.1 | 2.51 | 5.40 | 5.4 | 0.08 | 0.03 | 0.00 | 0.00 | ||
| 0.2 | 2.42 | 5.19 | 5.4 | 0.01 | 0.03 | 0.00 | 0.00 | ||
| 0.3 | 2.41 | 5.01 | 5.5 | 0.06 | 0.06 | 0.00 | 0.01 | ||
| 0.4 | 2.03 | 4.54 | 5.7 | 0.02 | 0.05 | 0.02 | 0.02 | ||
| 0.5 | 1.80 | 4.46 | 6.0 | 0.07 | 0.05 | 0.04 | 0.03 | ||
| 0.6 | 1.74 | 4.39 | 6.2 | 0.11 | 0.00 | 0.05 | 0.03 | ||
| 0.7 | 1.71 | 4.40 | 6.4 | 0.12 | 0.00 | 0.05 | 0.03 | ||
| 0.8 | 1.69 | 4.41 | 6.6 | 0.11 | 0.01 | 0.05 | 0.03 | ||
| 0.9 | 1.69 | 4.52 | 6.8 | 0.12 | 0.05 | 0.05 | 0.03 | ||
| 1.0 | 1.68 | 4.65 | 6.9 | 0.03 | 0.05 | 0.07 | 0.05 | ||
The noise level increased with α. This behavior was expected because of the noise-mitigating effect of TV-minimization, which dominates at low α. The prior image contained noise since it was reconstructed using the FDK algorithm. As α is increased, the noise level approaches but remains lower than that of the prior image. Therefore, it would be desirable to select α low enough to benefit from noise reduction but high enough to retain a good reconstruction accuracy.
The pseudo PSF width and shift were also evaluated for various values of α. It is possible to notice a slight increase in these values between α = 0.5 and 1.0. However, one must note that the voxel size for these reconstructions was (0.68 mm)3 . All width and shift values were below the voxel dimension for through-plane motion, which means that the spatial resolution was maintained for all values of α at this particular level of view angle sampling.
The accuracy of the algorithm was optimal between α = 0.5and 0.8, while the noise level increased in that range and the sharpness metrics were mostly stable. We concluded that an α value between 0.5 and 0.6 was optimal. A potential limitation of this study is the possible presence of motion due to imperfect breath holding. This effect was not evaluated. It is possible that a conscious patient with cardiac illness would have difficulty holding his or her breath for the duration of the scan.
C. Physical Motion Phantom Experiments
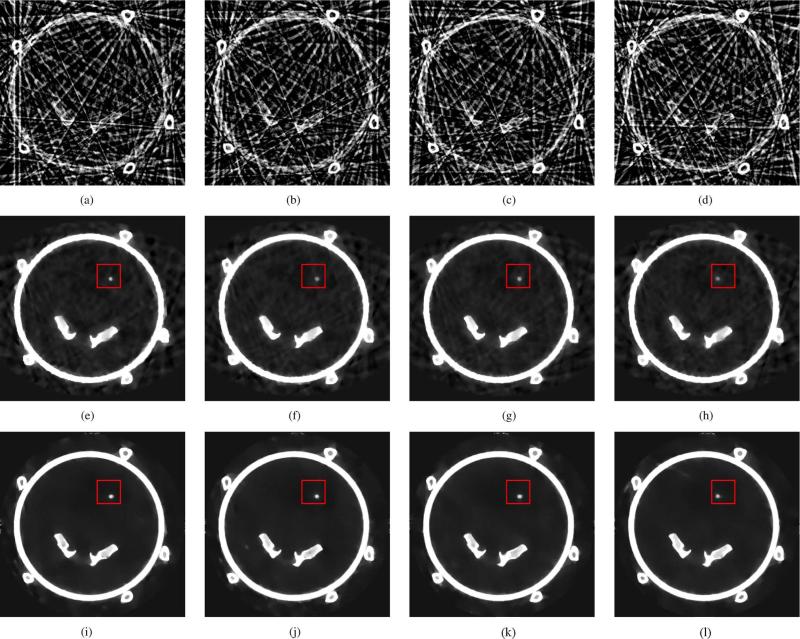
The physical phantom was scanned using a GE Innova 4100 system and images of the various motion phases were reconstructed. The prior image used for the PICCS reconstructions is presented in Fig. 8. Representative FDK, TV-minimization and PICCS reconstructions are presented in Fig. 9. The TV-minimization images were shown here for reference only and were not quantitatively evaluated. The goal of this section being to evaluate whether the findings about the PICCS algorithm from the hybrid phantom study are consistent when applied to a dataset acquired using a clinical interventional system.
Fig. 8.
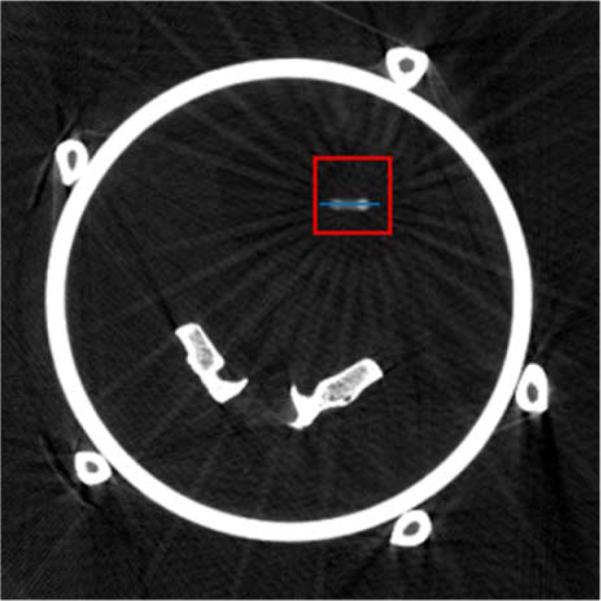
Prior image used for the PICCS reconstructions in the physical motion phantom study. The display range is [0.025, 0.035]mm–1 . The blue line segment was used to draw line profiles shown in Fig. 11. The red squares indicate the boundaries of the ROI used for rRMSE measurements.
Fig. 9.
Reconstructions from the physical motion phantom study. The prior image was reconstructed using all 420 projection view-angles, while the PICCS image was reconstructed from the gated dataset. The red squares indicate the boudaries of the ROI used for rRMSE measurements. The display range is [0.025, 0.040]mm–1 . (a) FDK Phase A. (b) FDK Phase B. (c) FDK Phase C. (d) FDK Phase D. (e)TV (α = 0) Phase A. (f) TV (α = 0) Phase B. (g) TV (α = 0) Phase C. (h) TV (α = 0) Phase D. (i) PICCS (α = 0) Phase A. (j) PICCS (α = 0) Phase B. (k) PICCS (α = 0) Phase D. (l) PICCS (α = 0)Phase D.
The image quality of the FDK reconstructions was inadequate to visualize the rod. However, TV-minimization and PICCS both enable reconstruction of the rod motion. As was observed for the hybrid phantom study, the TV-minimization images showed “patchy” artifacts. While the loss of small low-contrast details is more difficult to observe in this case due to the simplicity of the phantom, we still conclude that TV-minimization results in an image texture that is inadequate at the level of projection view angle sampling used here. The PICCS reconstructions did not show such high level of patchy artifacts. A minimal amount of artifactual contrast enhancement was observed around high contrast objects.
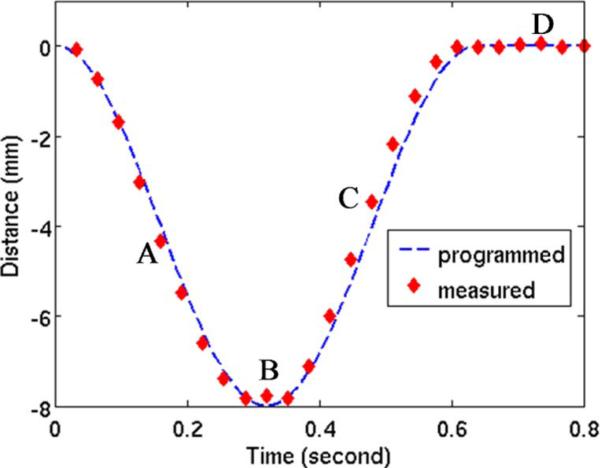
For each phase, the rod motion phantom was segmented and the position of the centroid of the region was measured. The centroid position is compared with the programmed motion pattern in Fig. 10. Overall, the reconstructed position agrees very well with the programmed rod motion. Line profiles through the moving rod are presented in Fig. 11 for several phases. The four phases labeled A, B, C, and D on the centroid position plot Fig. 10 each correspond to one of the four profile plots of Fig. 11. Notice that the PICCS algorithm reduces the motion blur seen in the prior image considerably. The full width at half maximum of the rod phantom agree within a few percent with the 3-mm width of the physical phantom.
Fig. 10.
Centroid position of the motion rod reconstructed using the PICCS algorithm (diamonds) compared with the programmed trajectory of the phantom (dotted line).
Fig. 11.
Line profiles through the PICCS reconstructions, the prior image, and the ground truth attenuation. Each profile plot corresponds to one of the four phases labeled on Fig. 10. The line segment corresponding the profiles is shown in blue in Fig. 8. (a) Phase A. (b) Phase B. (c) Phase C. (d) Phase D.
In order to quantify the sharpness of the PICCS reconstructions, the pseudo PSF width and shift were measured for each of the phases. Results are presented in (Table IV). The voxel size was (0.5mm)3. The vertical direction was perpendicular to the motion of the rod, while the horizontal direction was parallel to the motion. As for the hybrid phantom study, the width and shift are maintained at or below the voxel size, which suggests that the spatial resolution is maintained in the direction perpendicular to the motion. In the direction parallel to the motion, the shift was also maintained to a value close to the pixel size, which further demonstrates that the rod position was correctly reconstructed. As was observed for the hybrid phantom with in-plane motion, the value of the pseudo PSF width parallel to the rod motion was on average higher than in the perpendicular direction. This suggests that there was a loss in spatial resolution in that direction. However, it did not affect the visualization of the rod. As was the case for the hybrid phantom, the noise level of the PICCS reconstructions was below that observed for the prior image.
TABLE IV.
Reconstruction Sharpness and, Noise Level Measurements for the Physical Phantom Study
| Motion Phase | Motion rate† (bpm) | View-angle sampling (view angles) | Pseudo PSF width (mm) |
Pseudo PSF shift (mm) |
Noise standard deviation (10–4mm–1) | ||
|---|---|---|---|---|---|---|---|
| Vertical | Horizontal | Vertical | Horizontal | ||||
| A | 75 | 17 | 0.45 | 1.02 | 0.45 | 0.60 | 2.2 |
| B | 75 | 17 | 0.40 | 0.36 | 0.49 | 0.50 | 2.0 |
| C | 75 | 17 | 0.51 | 1.1 | 0.48 | 0.68 | 2.4 |
| D | 75 | 16 | 0.50 | 0.95 | 0.42 | 0.53 | 1.9 |
Assuming an acquisition time of 14 seconds.
The ROI used for the rRMSE measurements is shown in Fig. 9.
Both the prior image and the reference images have noise standard deviations of 4.6 × 10⁻⁴ mm–1.
To summarize this section, the PICCS algorithm was able to recover temporal information from datasets acquired using a clinical interventional system for sharp, high-contrast objects with motion patterns that are at rates similar to those of cardiac contractions. The findings were consistent with those of the hybrid phantom study.
D. In Vivo Animal Experiments
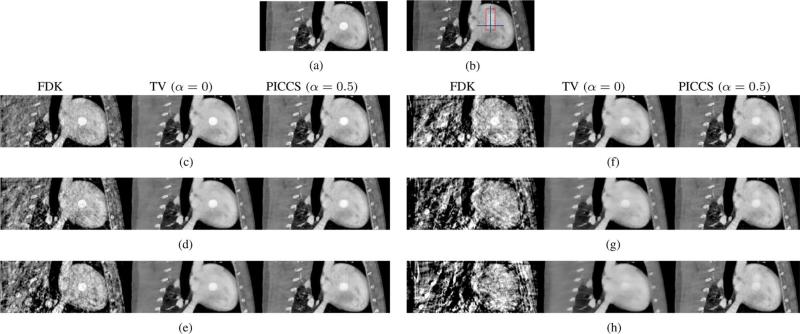
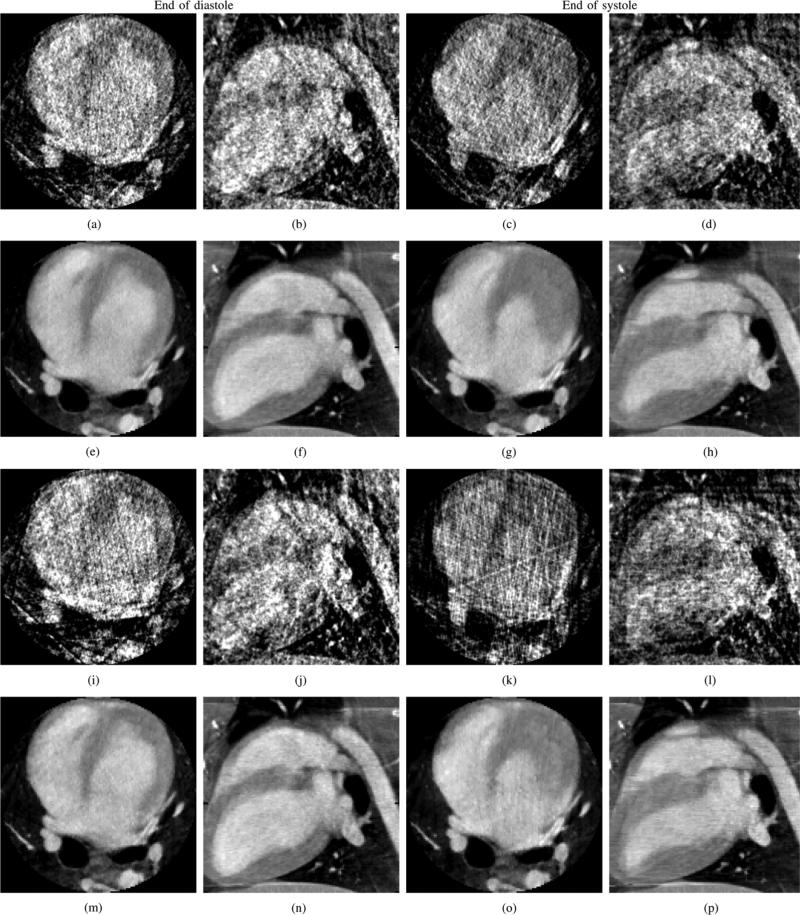
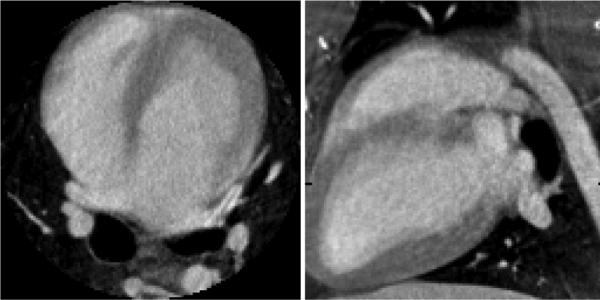
The canine projection datasets were processed using FDK and PICCS algorithms. After gating, 20 cardiac phases were reconstructed. The FDK and PICCS reconstructions at the end of the systole and of the diastole are presented in Fig. 12. The FDK reconstructions were plagued with a high level of streaking artifacts due to undersampling that interfered with the visualization of the cardiac anatomy. The PICCS reconstructions did not show such artifacts and allowed proper appreciation of the cardiac contraction dynamics. The deformation of the myocardium and of the heart chambers was clearly observed. As expected from the results of the previous sections, the chamber's edges were reconstructed with high spatial resolution. The 14 view angle dataset was generated by decimating views from the experimental dataset. The reconstructions of that dataset show a small loss in image quality, as features of the prior image (Fig. 13) remain slightly more visible. These do not interfere with the appreciation of the contraction dynamics.
Fig. 12.
Reconstructions of the gated in vivo datasets with 21 or 14 view angles (va). FDK and PICCS reconstructions are shown. Two cardiac phases are shown: the end of the diastole and the end of the systole. The images are presented in two orthogonal views: axial and sagittal. The display range is [0.010, 0.045]mm–1. (a) FDK, axial, diastole, 21 va. (b) FDK, sagittal, diastole, 21 va. (c) FDK, axial, systole, 21 va. (d) FDK, sagittal, systole, 21 va. (e) PICCS, axial, diastole, 21 va. (f) PICCS, sagittal, diastole, 21 va. (g) PICCS, axial, systole, 21 va. (h) PICCS, sagittal, systole, 21 va. (i) FDK, axial, diastole, 14 va. (j) FDK, sagittal, diastole, 14 va. (k) FDK, axial, systole, 14 va. (l) FDK, sagittal, systole, 14 va. (m) PICCS, axial, diastole, 14 va. (n) PICCS, sagittal, diastole, 14 va. (o) PICCS, axial, systole, 14 va. (p) PICCS, sagittal, systole, 14 va.
Fig. 13.
Prior image used for the in vivo PICCS reconstructions. The display range is [0.01, 0.045]mm–1.
A variation in heart rate of up 10 bpm was observed during the scan. This variation did not affect the ability of the data acquisition and image reconstruction scheme to reconstruct high temporal and spatial resolution cardiac images.
The CTDIvol of the current scan was 5.6 mGy. This is considerably lower than that typically delivered during state-ofthe-art clinical cardiac MDCT scans, around 50 mGy [53]–[55]. This should be kept in mind when inspecting the images reconstructed from this dataset. The signal to noise ratio may be lower than that of clinical CT images, which is a result of the low dose protocol and the performance of data acquisition system, not a limitation of the proposed PICCS framework.
Specific clinical applications have not yet been investigated systematically. However, from the images reconstructed using the PICCS algorithm, it could be possible to perform a quantitative analysis of myocardial wall thickening and left-ventricular function. Furthermore, the proposed protocol offers time-resolved image guidance.
In summary, the PICCS algorithm enables the reconstruction of time-resolved volumetric cardiac datasets from an animal model study. The image quality was only minimally degraded when the number of view angles was reduced from 21 to 14.
IV. Conclusion
In this paper, a data acquisition and image reconstruction scheme has been proposed to achieve time-resolved cardiac cone beam CT for cardiac interventional purpose. From a single gantry rotation scan done over a short scan angular range with a 14 s data acquisition time, about 420 projection view angles were acquired. A prior image without dynamic information is reconstructed from the entire dataset using the FDK algorithm. The projection data are then gated into individual cardiac phases, each composed of more than 14 view angles. The PICCS algorithm is used to reconstruct a time-resolved image series of the heart.
The proposed cardiac CT method was validated using a numerical phantom to show that it enables the reconstruction of image objects with irreproducible motion patterns while maintaining high spatial resolution. The method was tested using a hybrid numerical phantom with in vivo background anatomy to demonstrate that the algorithm can maintain a natural image texture while recovering dynamic information. It was established that more than 14 projection view angles per gated projection datasets must be used to maintain spatial and temporal resolution. The hybrid phantom was also used to demonstrate that a value of between 0.5 and 0.6 is optimal in terms of reconstruction accuracy and noise level. A physical motion phantom was scanned using a clinical interventional system to show that the method was applicable to data acquired in realistic conditions. Finally, an animal model study was performed to demonstrate that realistic cardiac anatomy and motion dynamics could be reconstructed accurately. These validation studies demonstrate that temporally-resolved cardiac imaging can be achieved using a slowly rotating gantry data acquisition system coupled with an advanced PICCS image reconstruction algorithm.
Future work may involve a systematic evaluation of the approach in specific clinical applications. Furthermore, the datasets used in this paper did not suffer from truncation. This phenomenon is very common when using cardiac interventional suites because of the small size of the detector. For analytic reconstruction algorithms such as FDK, truncation generally introduces artifacts in reconstructed images. However, using TV-based compressedsensingalgorithms,ithasbeendemonstratedthatthetruncation problem can be solved for piecewise constant objects [33], [42],[56].AnadaptedversionofthePICCSalgorithmiscurrently being investigated based on these findings.
Acknowledgment
The authors would like to thank D. Cosigny for his expert help with the animal study. Also, stimulating discussions with Dr. C. Riddell at GE Healthcare are gratefully acknowledged. Finally, the authors would like to thank the anonymous reviewers for their thoughtful comments and suggestions.
The work was partially supported by National Institutes of Health through R01 EB009699 and a doctoral scholarship from NSERCCRSNG (P.T.L.).
Appendix
Numerical Phantom Description
The ellipse was modeled as follows:
| (11) |
where (x, y) were Cartesian coordinates within the image, (x0, y0) were the coordinates of the center of the ellipse, a was the mean dimension of the ellipse, and m(t) was the deviation from the mean dimension of the ellipse at time t (Fig. 14).
Four translating disks surrounded the cardiac region to simulate coronary vessels. They were modeled as follows:
| (12) |
| (13) |
| (14) |
| (15) |
where c is the radius of the simulated coronary vessel and is the distance between the center of the coronary vessel and the surface of the deforming ellipse. m(t) is defined as
| (16) |
where m0 is the amplitude and mr is a random number chosen in the range [–vm0, vm0] where v is the fraction variation. f is the frequency of the periodic motion. The parameter which is varied in the numerical phantom study is v. See Fig. 14 for an example of the motion pattern.
Contributor Information
Guang-Hong Chen, Department of Medical Physics, Radiology, Human Oncology, University of Wisconsin-Madison, Madison, WI 53792 USA (gchen7@wisc.edu)..
Pascal Thériault-Lauzier, Department of Medical Physics, University of Wisconsin-Madison, Madison, WI 53792 USA..
Jie Tang, Department of Medical Physics, University of Wisconsin-Madison, Madison, WI 53792 USA..
Brian Nett, Department of Medical Physics, University of Wisconsin-Madison, Madison, WI 53792 USA..
Shuai Leng, Department of Medical Physics, University of Wisconsin-Madison, Madison, WI 53792 USA..
Joseph Zambelli, Department of Medical Physics, University of Wisconsin-Madison, Madison, WI 53792 USA..
Zhihua Qi, Department of Medical Physics, University of Wisconsin-Madison, Madison, WI 53792 USA..
Nicholas Bevins, Department of Medical Physics, University of Wisconsin-Madison, Madison, WI 53792 USA..
Amish Raval, Department of Medicine, University of Wisconsin-Madison, Madison, WI 53792 USA..
Scott Reeder, Department of Radiology, University of Wisconsin-Madison, Madison, WI 53792 USA..
Howard Rowley, Department of Radiology, University of Wisconsin-Madison, Madison, WI 53792 USA..
References
- 1.Roger V, et al. Heart disease and stroke statistics–2011 update: A report from the American Heart Association. Circulation. 2011;123(4):e18–e209. doi: 10.1161/CIR.0b013e3182009701. [DOI] [PMC free article] [PubMed] [Google Scholar]
- 2.Dong J, et al. Initial experience in the use of integrated electroanatomic mapping with three-dimensional MR/CT images to guide catheter ablation of atrial fibrillation. J. Cardiovas. Electrophysiol. 2006;17(5):459–466. doi: 10.1111/j.1540-8167.2006.00425.x. [DOI] [PubMed] [Google Scholar]
- 3.Orlov M, Hoffmeister P, Chaudhry G, Almasry I, Gijsbers G, Swack T, Haffajee C. Three-dimensional rotational angiography of the left atrium and esophagus—A virtual computed tomography scan in the electrophysiology lab? Heart Rhythm. 2007;4(1):37–43. doi: 10.1016/j.hrthm.2006.10.003. [DOI] [PubMed] [Google Scholar]
- 4.Al-Ahmad A, Wigström L, Sandner-Porkristl D, Wang P, Zei P, Boese J, Lauritsch G, Moore T, Chan F, Fahrig R. Time-resolved three-dimensional imaging of the left atrium and pulmonary veins in the interventional suite-a comparison between multisweep gated rotational three-dimensional reconstructed fluoroscopy and multislice computed tomography. Heart Rhythm. 2008;5(4):513–519. doi: 10.1016/j.hrthm.2007.12.027. [DOI] [PubMed] [Google Scholar]
- 5.Nölker G, Gutleben K, Marschang H, Ritscher G, Asbach S, Marrouche N, Brachmann J, Sinha A. Three-dimensional left atrial and esophagus reconstruction using cardiac c-arm computed tomography with image integration into fluoroscopic views for ablation of atrial fibrillation: Accuracy of a novel modality in comparison with multislice computed tomography. Heart Rhythm. 2008;5(12):1651–1657. doi: 10.1016/j.hrthm.2008.09.011. [DOI] [PubMed] [Google Scholar]
- 6.Thiagalingam A, Manzke R, D'avila A, Ho I, Locke A, Ruskin J, Chan R, Reddy V. Intraprocedural volume imaging of the left atrium and pulmonary veins with rotational X-ray angiography: Implications for catheter ablation of atrial fibrillation. J. Cardiovas. Electrophysiol. 2008;19(3):293–300. doi: 10.1111/j.1540-8167.2007.01013.x. [DOI] [PubMed] [Google Scholar]
- 7.Li J, Haim M, Movassaghi B, Mendel J, Chaudhry G, Haffajee C, Orlov M. Segmentation and registration of three-dimensional rotational angiogram on live fluoroscopy to guide atrial fibrillation ablation: A new online imaging tool. Heart Rhythm. 2009;6(2):231–237. doi: 10.1016/j.hrthm.2008.10.038. [DOI] [PubMed] [Google Scholar]
- 8.Ritchie C, Godwin J, Crawford C, Stanford W, Anno H, Kim Y. Minimum scan speeds for suppression of motion artifacts in CT. Radiology. 1992;185(1):37. doi: 10.1148/radiology.185.1.1523332. [DOI] [PubMed] [Google Scholar]
- 9.Lauritsch G, Boese J, Wigstrom L, Kemeth H, Fahrig R. Towards cardiac C-arm computed tomography. IEEE Trans. Med. Imag. 2006 Jul.25(7):922–934. doi: 10.1109/tmi.2006.876166. [DOI] [PubMed] [Google Scholar]
- 10.Prummer M, Wigstrom L, Hornegger J, Boese J, Lauritsch G, Strobel N, Fahrig R. Cardiac C-arm CT: Efficient motion correction for 4D-FBP. IEEE Nucl. Sci. Symp. Conf. Rec. 2006;4:2620–2628. [Google Scholar]
- 11.Prummer M, Hornegger J, Lauritsch G, Wigstrom L, Girard-Hughes E, Fahrig R. Cardiac C-arm CT: A unified framework for motion estimation and dynamic CT. IEEE Trans. Med. Imag. 2009 Nov.28(11):1836–1849. doi: 10.1109/TMI.2009.2025499. [DOI] [PubMed] [Google Scholar]
- 12.Chen G, Tang J, Leng S. Prior image constrained compressed sensing (PICCS): A method to accurately reconstruct dynamic CT images from highly undersampled projection data sets. Med. Phys. 2008;35:660. doi: 10.1118/1.2836423. [DOI] [PMC free article] [PubMed] [Google Scholar]
- 13.Nett B, Tang J, Leng S, Chen G. Tomosynthesis via total variation minimization reconstruction and prior image constrained compressed sensing (PICCS) on a C-arm system. Proc. SPIE. 2008;6913:69132D. doi: 10.1117/12.771294. [DOI] [PMC free article] [PubMed] [Google Scholar]
- 14.Leng S, Tang J, Zambelli J, Nett B, Tolakanahalli R, Chen G. High temporal resolution and streak-free four-dimensional cone-beam computed tomography. Phys. Med. Biol. 2008;53:5653–5673. doi: 10.1088/0031-9155/53/20/006. [DOI] [PMC free article] [PubMed] [Google Scholar]
- 15.Qi Z, Chen G. Extraction of tumor motion trajectories using PICCS-4DCBCT: A validation study. Med. Phys. 2011;38:5530–5538. doi: 10.1118/1.3637501. [DOI] [PMC free article] [PubMed] [Google Scholar]
- 16.Qi Z, Chen G. Performance studies of four-dimensional cone beam computed tomography. Phys. Med. Biol. 2011;56:6709–6721. doi: 10.1088/0031-9155/56/20/013. [DOI] [PMC free article] [PubMed] [Google Scholar]
- 17.Chen G, Tang J, Hsieh J. Temporal resolution improvement using PICCS in MDCT cardiac imaging. Med. Phys. 2009;36:2130–2135. doi: 10.1118/1.3130018. [DOI] [PMC free article] [PubMed] [Google Scholar]
- 18.Tang J, Hsieh J, Chen G. Temporal resolution improvement in cardiac CT using PICCS (TRI-PICCS): Performance studies. Med. Phys. 2010;37:4377–4388. doi: 10.1118/1.3460318. [DOI] [PubMed] [Google Scholar]
- 19.Tang J, Lauzier PT, Chen G. Dose reduction using prior image constrained compressed sensing (DR-PICCS) Proc. SPIE. 2011;7961–91 [Google Scholar]
- 20.Lubner M, Pickhardt P, Tang J, Chen G. Reduced image noise at low-dose multidetector CT of the abdomen with prior image constrained compressed sensing algorithm. Radiology. 2011;260:248–256. doi: 10.1148/radiol.11101380. [DOI] [PubMed] [Google Scholar]
- 21.Nett B, Tang J, Aagaard-Kienitz B, Rowley H, Chen G. Low radiation dose C-arm cone-beam CT based on prior image constrained compressed sensing (PICCS): Including compensation for image volume mismatch between multiple data acquisitions. Proc. SPIE. 2009;7258:725803. [Google Scholar]
- 22.Szczykutowicz T, Chen G. Dual energy CT using slow kVp switching acquisition and prior image constrained compressed sensing. Phys. Med. Biol. 2010;55:6411–6429. doi: 10.1088/0031-9155/55/21/005. [DOI] [PubMed] [Google Scholar]
- 23.Ramirez-Giraldo J, Trzasko J, Leng S, McCollough C, Manduca A. Non-convex prior image constrained compressed sensing (NCPICCS) Proc. SPIE. 2010;7622 doi: 10.1118/1.3560878. [DOI] [PMC free article] [PubMed] [Google Scholar]
- 24.Ramirez-Giraldo J, Trzasko J, Leng S, Yu L, Manduca A, McCollough C. Nonconvex prior image constrained compressed sensing (NCPICCS): Theory and simulations on perfusion CT. Med. Phys. 2011;38:2157–2167. doi: 10.1118/1.3560878. [DOI] [PMC free article] [PubMed] [Google Scholar]
- 25.Candès E, Romberg J, Tao T. Robust uncertainty principles: Exact signal reconstruction from highly incomplete frequency information. IEEE Trans. Inf. Theory. 2006 Feb.52(2):489–509. [Google Scholar]
- 26.Candès E, Romberg J, Tao T. Stable signal recovery from incomplete and inaccurate measurements. Commun. Pure Appl. Math. 2006;59(8):1207–1223. [Google Scholar]
- 27.Donoho D. Compressed sensing. IEEE Trans. Inf. Theory. 2006 Apr.52(4):1289–1306. [Google Scholar]
- 28.Lustig M, Donoho D, Pauly J. Sparse MRI: The application of compressed sensing for rapid MR imaging. Magn. Reson. Med. 2007;58(6):1182–1195. doi: 10.1002/mrm.21391. [DOI] [PubMed] [Google Scholar]
- 29.Lustig M, Donoho D, Santos J, Pauly J. Compressed sensing MRI. IEEE Signal Process. Mag. 2008 Feb.25(2):72–82. [Google Scholar]
- 30.Sidky E, Pan X. Image reconstruction in circular cone-beam computed tomography by constrained, total-variation minimization. Phys. Med. Biol. 2008;53:4777–4807. doi: 10.1088/0031-9155/53/17/021. [DOI] [PMC free article] [PubMed] [Google Scholar]
- 31.Provost J, Lesage F. The application of compressed sensing for photo-acoustic tomography. IEEE Trans. Med. Imag. 2009 Apr.28(4):585–594. doi: 10.1109/TMI.2008.2007825. [DOI] [PubMed] [Google Scholar]
- 32.Tang J, Nett B, Chen G. Performance comparison between total variation (TV)-based compressed sensing and statistical iterative reconstruction algorithms. Phys. Med. Biol. 2009;54:5781–5804. doi: 10.1088/0031-9155/54/19/008. [DOI] [PMC free article] [PubMed] [Google Scholar]
- 33.Yu H, Wang G. Compressed sensing based interior tomography. Phys. Med. Biol. 2009;54:2791–2805. doi: 10.1088/0031-9155/54/9/014. [DOI] [PMC free article] [PubMed] [Google Scholar]
- 34.Thériault-Lauzier P, Tang J, Chen G. Prior image constrained compressed sensing: Implementation and performance evaluation. Med. Phys. 2011 doi: 10.1118/1.3666946. to be published. [DOI] [PMC free article] [PubMed] [Google Scholar]
- 35.Giraldo J, Trzasko J, Leng S, McCollough C, Manduca A. Nonconvex prior image constrained compressed sensing (NC-PICCS) Proc. SPIE. 2010;7622:76222C. [Google Scholar]
- 36.Rudin L, Osher S, Fatemi E. Nonlinear total variation based noise removal algorithms. Physica D: Nonlinear Phenomena. 1992;60(1–4):259–268. [Google Scholar]
- 37.Vogel C, Oman M. Iterative methods for total variation denoising. SIAM J. Sci. Comput. 1996;17(1):227–238. [Google Scholar]
- 38.Song J, Liu Q, Johnson G, Badea C. Sparseness prior based iterative image reconstruction for retrospectively gated cardiac microCT. Med. Phys. 2007;34:4476–4483. doi: 10.1118/1.2795830. [DOI] [PMC free article] [PubMed] [Google Scholar]
- 39.Sidky E, Pan X, Reiser I, Nishikawa R, Moore R, Kopans D. Enhanced imaging of microcalcifications in digital breast tomosyn-thesis through improved image-reconstruction algorithms. Med. Phys. 2009;36:4920–4932. doi: 10.1118/1.3232211. [DOI] [PMC free article] [PubMed] [Google Scholar]
- 40.Bian J, Siewerdsen J, Han X, Sidky E, Prince J, Pelizzari C, Pan X. Evaluation of sparse-view reconstruction from flat-panel-detector cone-beam CT. Phys. Med. Biol. 2010;55:6575–6599. doi: 10.1088/0031-9155/55/22/001. [DOI] [PMC free article] [PubMed] [Google Scholar]
- 41.Choi K, Wang J, Zhu L, Suh T, Boyd S, Xing L. Compressed sensing based cone-beam computed tomography reconstruction with a first-order method. Med. Phys. 2010;37:5113–5125. doi: 10.1118/1.3481510. [DOI] [PMC free article] [PubMed] [Google Scholar]
- 42.Yang J, Yu H, Jiang M, Wang G. High-order total variation minimization for interior tomography. Inverse Problems. 2010;26:035013. doi: 10.1088/0266-5611/26/3/035013. [DOI] [PMC free article] [PubMed] [Google Scholar]
- 43.Szczykutowicz T, Hsieh J, Chen G. The dependence of image quality on the number of high and low kVp projections in dual energy CT using the prior image constrained compressed sensing (PICCS) algorithm. Proc. SPIE. 2010;7622:762221. [Google Scholar]
- 44.Chen G, Tang J, Nett B, Leng S, Zambelli J, Qi Z, Bevins N, Reeder S, Rowley H. High temporal resolution cardiac cone-beam CT using a slowly rotating C-arm gantry. Proc. SPIE. 2009;7258:72580C. [Google Scholar]
- 45.Nocedal J, Wright S. Numerical Optimization. Springer; New York: 1999. [Google Scholar]
- 46.Gordon R, Bender R, Herman G. Algebraic reconstruction techniques (ART) for three-dimensional electron microscopy and xray photography* 1. J. Theoret. Biol. 1970;29(3):471–481. doi: 10.1016/0022-5193(70)90109-8. [DOI] [PubMed] [Google Scholar]
- 47.Andersen A, Kak A. Simultaneous algebraic reconstruction technique (SART): A superior implementation of the ART algorithm. Ultrason. Imag. 1984;6(1):81–94. doi: 10.1177/016173468400600107. [DOI] [PubMed] [Google Scholar]
- 48.Gabor TC, et al. On some optimization techniques in image reconstruction from projections. Appl. Numerical Math. 1987;3(5):365–391. [Google Scholar]
- 49.Herman G. Image Reconstruction From Projections. 2nd ed. Springer; New York: 2009. [Google Scholar]
- 50.Feldkamp L, Davis L, Kress J. Practical cone-beam algorithm. JOSA A. 1984;1(6):612–619. [Google Scholar]
- 51.Chen G, Zambelli J, Nett B, Supanich M, Riddell C, Belanger B, Mistretta C. Design and development of C-arm based cone-beam CT for image-guided interventions: Initial results. Proc. SPIE. 2006;6142:614210. [Google Scholar]
- 52.Fahrig R, Dixon R, Payne T, Morin R, Ganguly A, Strobel N. Dose and image quality for a cone-beam C-arm CT system. Med. Phys. 2006;33:4541–4550. doi: 10.1118/1.2370508. [DOI] [PubMed] [Google Scholar]
- 53.Hunold P, Vogt F, Schmermund A, Debatin J, Kerkhoff G, Budde T, Erbel R, Ewen K, Barkhausen J. Radiation exposure during cardiac CT: Effective doses at multi-detector row CT and electron-beam CT. Radiology. 2003;226(1):145–152. doi: 10.1148/radiol.2261011365. [DOI] [PubMed] [Google Scholar]
- 54.Hausleiter J, Meyer T, Hadamitzky M, Huber E, Zankl M, Martinoff S, Kastrati A, Schomig A. Radiation dose estimates from cardiac multislice computed tomography in daily practice: Impact of different scanning protocols on effective dose estimates. Circulation. 2006;113(10):1305–1310. doi: 10.1161/CIRCULATIONAHA.105.602490. [DOI] [PubMed] [Google Scholar]
- 55.Feuchtner GM, Jodocy D, Klauser A, Haberfellner B, Aglan I, Spoeck A, Hiehs S, Soegner P, Jaschke W. Radiation dose reduction by using 100-kv tube voltage in cardiac 64-slice computed tomography: A comparative study. Eur. J. Radiol. 2010;75(1):e51–e56. doi: 10.1016/j.ejrad.2009.07.012. [DOI] [PubMed] [Google Scholar]
- 56.Yu H, Yang J, Jiang M, Wang G. Supplemental analysis on compressed sensing based interior tomography. Phys. Med. Biol. 2009;54:N425–N432. doi: 10.1088/0031-9155/54/18/N04. [DOI] [PMC free article] [PubMed] [Google Scholar]


