Abstract
The relationship between neurodegeneration and the two hallmark proteins of Alzheimer's disease, amyloid-β (Aβ) and tau, is still unclear. Here, we examined 286 non-demented participants (107 cognitively normal older adults and 179 memory impaired individuals) who underwent longitudinal MR imaging and lumbar puncture. Using mixed effects models, we investigated the relationship between longitudinal entorhinal cortex atrophy, CSF p-tau181p and CSF Aβ1-42. We found a significant relationship between elevated entorhinal cortex atrophy and decreased CSF Aβ1-42 only with elevated CSF p-tau181p. Our findings indicate that Aβ-associated volume loss occurs only in the presence of phospho-tauin humans at risk for dementia.
INTRODUCTION
A fundamental tenet of the amyloid hypothesis is that amyloid-β (Aβ) deposition triggers the neurodegenerative process underlying Alzheimer's disease (AD) 1. The presence of Aβ initiates downstream loss of dendritic spines and synapses 2 and functional disruption of neuronal networks 3. However in humans, amyloid plaques are present in cognitively normal older adults 4, correlate poorly with memory decline 5 and immunotherapy-induced plaque removal may not prevent progressive neurodegeneration 6 suggesting that other entities may be required for AD-related degeneration. Recent studies using mouse models show that tau reduction can block Aβ-induced cognitive impairment 7 and tau potentiates Aβ-associated synaptic toxicity 8. Though these experimental findings suggest a link between tau and Aβ, it is unknown whether tau (specifically, phospho-tau or p-tau) interacts with Aβ to effect dendritic and synaptic degeneration in humans at risk for AD.
In humans, structural MRI and CSF biomarkers allow for the indirect assessment of the cellular changes underlying AD in vivo. Structural MRI provides measures of cerebral atrophy, which reflects loss of dendrites and synapses 9. Low CSF levels of Aβ strongly correlate with high binding of the amyloid PET ligand Pittsburgh Compound B (PiB) 10 and with increased intracranial plaques 11. High concentrations of CSF p-tau correlate with AD-specific neurofibrillary pathology 12 and elevated total tau correlates with neuronal and axonal damage 13. Here, we investigated whether an interaction between increased CSF p-tau181p and decreased CSF Aβ1-42 is associated with increased cerebral atrophy over time in non-demented older individuals at risk for developing AD.
SUBJECTS AND METHODS
Selection of participants and analysis methods for MRI and CSF biomarkers are briefly summarized here, with details provided in Supplemental Information.
We evaluated healthy older controls (HC, n = 107) and individuals diagnosed with amnestic mild cognitive impairment (MCI, n = 179) from the Alzheimer's Disease Neuroimaging Initiative. Using recently proposed CSF cutoffs 14, we classified all participants based on high (>23 pg/ml, “positive”) and low (<23 pg/ml, “negative”) ptau181p levels and based on low (<192 pg/ml, “positive”) and high (>192 pg/ml, “negative”) Aβ1-42 levels (Table 1). We restricted participants to those with CSF data and quality-assured baseline and follow-up MRI scans (6 months to 3.5 years, mean of 2.14 years, standard deviation 0.75 years) available as of January 2011.
We examined 1,177 T1-weighted MRI scans. We performed quantitative surface-based analysis of all MRI scans using an automated region-of-interest labeling technique and focused on the entorhinal cortex, a medial temporal lobe region that is selectively affected in the earliest stages of AD 5. We additionally examined other neuroanatomic regions affected in later stages of the disease process (see Supplemental Methods and Results). Using a recently developed method from our laboratory 15, we assessed longitudinal sub-regional change in gray matter volume (atrophy) on serial MRI scans.
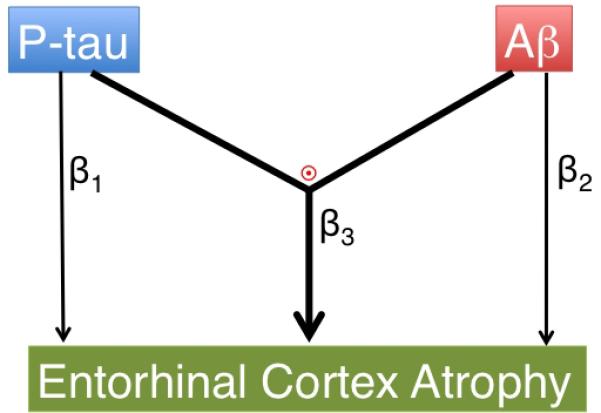
We asked whether a statistical interaction between CSF p-tau181p and CSF Aβ1-42 status is associated with entorhinal cortex atrophy over time (Figure 1). We examined the main and interactive effects of CSF p-tau181p and CSF Aβ1-42 on entorhinal cortex atrophy while controlling for age, sex, group status (MCI vs. HC), and disease severity (CDR-Sum of Boxes), using the following mixed effects model: Δv= β0 + β1CSF_p-tau181p_status × Δt + β2CSF_Aβ1-42_status × Δt + β3[CSF_ptau181p_status × CSF_Aβ1-42_status × Δt] + co-variates × + ε Here, Δv = entorhinal cortex atrophy (millimeters3) and Δt = change in time from baseline MRI scan (years). We also investigated whether an interaction between increased CSF ptau181p and decreased CSF Aβ1-42 is associated with longitudinal clinical decline as assessed with the Alzheimer's Disease Assessment Scale-cognitive subscale (ADAS-cog) (see Supplemental Results).
Figure 1.

Diagrammatic representations of the primary hypotheses evaluated in the current study: (β1) main effect of p-tau on entorhinal cortex atrophy, (β2) main effect of Aβ on entorhinal cortex atrophy, and (β3 and  ) an interactive effect between p-tau and Aβ is associated with entorhinal cortex atrophy.
RESULTS
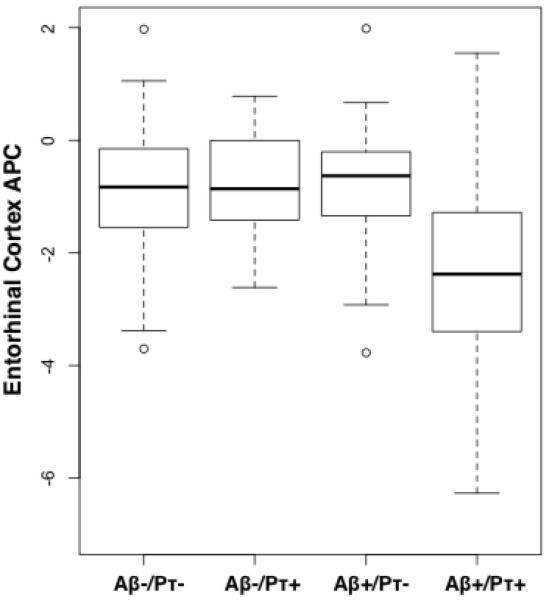
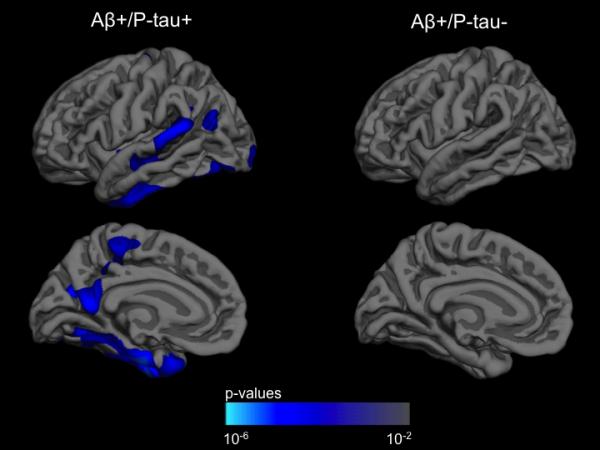
Across all participants, the interaction between CSF p-tau181p and CSF Aβ1-42 status on entorhinal cortex atrophy was significant (β3 = -0.01, standard error (SE) = 0.004, p = 0.002) indicating elevated atrophy over time in individuals with positive CSF p-tau181p and positive CSF Aβ1-42 status (Figure 2a). With this interaction term in the model, neither the main effect of CSF p-tau181p nor CSF Aβ1-42 was significantly different from zero. Follow-up analyses demonstrated that CSF Aβ1-42 status was associated with elevated entorhinal cortex atrophy only among CSF p-tau181p positive individuals (β-coefficient = -0.01, SE = 0.003, p = 0.0002) (Figure 2b). There was no association between CSF Aβ1-42 status and entorhinal cortex atrophy among CSF p-tau181p negative individuals (β-coefficient = -0.0007, SE = 0.002, p = 0.75). Similar results were obtained when CSF p-tau181p and CSF Aβ1-42 were treated as continuous rather than categorical variables (see Supplemental Results).
Figure 2.


(a) Box and whisker plots for all participants illustrating entorhinal cortex atrophy rate, measured as annualized percent change (APC), based on CSF Aβ1-42 (Aβ) and CSF p-tau181p (pτ) status for all participants. For each plot, thick black lines show the median value. Regions above and below the black line show the upper and lower quartiles, respectively. The dashed lines extend to the minimum and maximum values with outliers shown as open circles. As illustrated, the Aβ +/pτ + individuals demonstrated the largest cortical atrophy rate (i.e. more negative percent change). (b) ANCOVA results for all participants displayed across the lateral and medial hemispheres of the cerebral cortex. The cortex-wide ANCOVA co-varied for age, gender, group status (MCI vs. HC) and CDR-SB. The strongest association between CSF Aβ1-42 status and cortical atrophy rate, measured as annualized percent change, was observed in the entorhinal/medial temporal cortex and present only among p-tau positive individuals. Among p-tau negative individuals, CSF Aβ1-42 status was not associated with rate of cortical atrophy. For illustration, only the left hemisphere is visualized.
Subgroup analyses within the MCI cohort demonstrated that CSF Aβ1-42 status was associated with elevated entorhinal cortex atrophy only among CSF p-tau181p positive individuals (β-coefficient = -0.02, SE = 0.0066, p = 0.003). There was no association between CSF Aβ1-42 status and entorhinal cortex atrophy among CSF p-tau181p negative MCI individuals (β-coefficient = -0.005, SE = 0.004, p = 0.30) (Table 1a).
Table 1a.
Demographic, clinical, and imaging data for all Mild Cognitive Impairment (MCI) individuals in this study. MMSE = Mini-mental status exam, CDR-SB = Clinical Dementia Rating-Sum of Boxes score, APC = Annualized Percent Change, SE = Standard error of the mean, CI = Confidence Interval
| Aβ -/P-tau - (n = 36) | Aβ -/P-tau + (n = 9) | Aβ +/P-tau - (n = 15) | Aβ +/P-tau + (n = 119) | |
|---|---|---|---|---|
| Age, Mean (SE) | 74.2 (1.4) | 80.4 (1.9) | 76.9 (1.5) | 74.1 (0.6) |
| Female, % | 24 | 29 | 31 | 38 |
| Education Years, Mean (SE) | 15.9 (0.5) | 16.1 (1.1) | 16.5 (0.7) | 15.6 (0.3) |
| MMSE, Mean (SE) | 27.3 (0.3) | 25.8 (0.6) | 27.0 (0.5) | 26.8 (0.2) |
| CDR-SB, Mean (SE) | 1.3 (0.1) | 1.3 (0.2) | 1.8 (0.3) | 1.6 (0.1) |
| Years Between MRI Scans, Mean (SE) | 2.0 (0.1) | 1.8 (0.1) | 2.1 (0.2) | 2.1 (0.1) |
| Entorhinal Cortex APC, Mean (95% CI) | -1.4 (-1.0, -1.8) | -1.1 (0.1, -2.3) | -1.1 (-0.3, -1.9) | -2.6 (-2.4, -2.8) |
Consistent with the MCI results, subgroup analyses within the HC cohort demonstrated that CSF Aβ1-42 status was associated with entorhinal cortex atrophy only in CSF p-tau181p positive individuals (β-coefficient = -0.009, SE = 0.003, p = 0.007). There was no association between CSF Aβ1-42 status and entorhinal cortex atrophy among CSF p-tau181p negative HC individuals (β-coefficient = 0.002, SE = 0.002, p = 0.32) (Table 1b).
Table 1b.
Demographic, clinical, and imaging data for all healthy older controls (HC) in this study. MMSE = Mini-mental status exam, APC = Annualized Percent Change, SE = Standard error of the mean, CI = Confidence Interval
| Aβ -/P-tau - (n = 46) | Aβ -/P-tau + (n = 19) | Aβ +/P-tau - (n = 20) | Aβ +/P-tau + (n = 21) | |
|---|---|---|---|---|
| Age, Mean (SE) | 74.3 (0.6) | 78.0 (1.4) | 74.9 (1.1) | 78.2 (1.0) |
| Female, % | 24 | 29 | 31 | 38 |
| Education Years, Mean (SE) | 15.5 (0.4) | 15.5 (0.4) | 14.8 (0.8) | 16.7 (0.6) |
| MMSE, Mean (SE) | 29.1 (0.1) | 28.8 (0.3) | 29.1 (0.2) | 29.3 (0.2) |
| Years Between MRI Scans, Mean (SE) | 2.3 (0.1) | 2.3 (0.2) | 2.3 (0.1) | 2.4 (0.2) |
| Entorhinal Cortex APC, Mean (95% CI) | -0.6 (-0.4, -0.8) | -0.6 (-0.2, -1.0) | -0.6 (-0.2, -1.0) | -1.2 (-0.8, -1.6) |
Supplementary analyses demonstrated a similar pattern of results in regions affected later in the disease process, with CSF Aβ1-42 status associated with increased atrophy only among CSF p-tau181p positive individuals. Similarly, CSF Aβ1-42 status was associated with a worsening ADAS-cog score over time only among CSF p-tau181p positive individuals (See Supplemental Results).
We also examined the possibility that a nonspecific form of tau, total tau (t-tau), which correlates strongly with p-tau (Spearman's rho = 0.82, p < 0.001), interacts with Aβ to influence AD-associated entorhinal cortex atrophy. We classified all participants based on high (“positive”) and low (“negative”) t-tau levels using a CSF cutoff value of 93 pg/ml 14. Using the same mixed effects framework described above, we found that neither the main effect of CSF t-tau status nor its interaction with CSF Aβ1-42 significantly differed from zero. Treating t-tau and Aβ1-42 as continuous variables did not change these results.
DISCUSSION
Here, we show for the first time that in non-demented humans at risk for AD, Aβ-associated entorhinal cortex degeneration occurs only in the presence of p-tau. In the absence of p-tau, the effect of Aβ on entorhinal cortex volume loss is not significantly different from zero. Our results also indicate that Aβ is associated with accelerated clinical decline only in the presence of p-tau.
Though several cross-sectional studies have found a significant relationship between Aβ deposition and cortical thickness 18, 19, the role of p-tau in modulating this relationship has not been examined. Our longitudinal data indicate that in non-demented individuals Aβ deposition by itself is not associated with neurodegeneration; the presence of p-tau likely represents a critical link between Aβ deposition and accelerated volume loss in the entorhinal cortex and other AD-vulnerable regions.
These findings point to p-tau as an important marker of AD-associated neurodegeneration. Though CSF p-tau and t-tau are highly correlated, p-tau may represent a more specific marker of the disease process. Elevations in CSF t-tau are seen in a number of neurologic disorders characterized by neuronal and axonal damage whereas increased CSF p-tau correlates with cognitive decline in MCI, increased neurofibrillary pathology in AD, and can distinguish AD from other neurodegenerative diseases. 20 Our results are consistent with these prior observations and indicate that the interaction between p-tau and Aβ likely reflects underlying AD pathobiology.
Recent work using neuronal cultures and mouse models suggests that a synergistic interaction between tau and Aβ effects neurodegeneration. Specifically, Aβ triggers tau hyperphosphorylation 16 leading to tau dissociation from microtubules and increased tau accumulation in the somatodendritic compartment 8. Accumulated tau interacts with tyrosine protein kinases, such as FYN, leading to sensitization of NMDA receptors and rendering neurons susceptible to Aβ-associated toxicity.17 Our human findings are consistent with this experimentally-derived pathobiologic cascade.
Limitations of our study include its observational nature, which precludes conclusions regarding causation and the use of CSF biomarkers, which provide an indirect assessment of amyloid and neurofibrillary pathology. Finally, we primarily focused on CSF biomarkers of the two pathologic hallmarks of AD. Additional markers, such as the e4 allele of apolipoprotein E (APOE ε4) or other p-tau isoforms, may also interact with Aβ to predict entorhinal cortex volume loss.
From a clinical perspective, this work illustrates the importance and feasibility of testing hypotheses generated from experimental models in humans. Although substantial progress has been made in understanding the cellular and molecular mechanisms of neurodegeneration, problems arise in translating these findings into the clinical setting. Our results indicate that an analytic framework that integrates multiple biomarkers to test experimental hypotheses in living individuals may help bridge the translational divide between basic research and clinical medicine. By elucidating various aspects of AD biology, the combination of longitudinal MRI and CSF biomarkers may additionally be useful for detecting and quantifying the biochemical effects of therapeutic interventions.
Supplementary Material
Acknowledgements
The authors would like to thank Roberto Malinow, Edward Koo, and Anne Fagan for helpful discussions. This research was supported by grants from the National Institutes of Health (R01AG031224; K01AG029218; K02 NS067427; T32 EB005970). Data collection and sharing for this project was funded by the Alzheimer's Disease Neuroimaging Initiative (ADNI) (National Institutes of Health Grant U01 AG024904). ADNI is funded by the National Institute on Aging, the National Institute of Biomedical Imaging and Bioengineering, and through generous contributions from the following: Abbott, AstraZeneca AB, Bayer Schering Pharma AG, Bristol-Myers Squibb, Eisai Global Clinical Development, Elan Corporation, Genentech, GE Healthcare, GlaxoSmithKline, Innogenetics, Johnson and Johnson, Eli Lilly and Co., Medpace, Inc., Merck and Co.,Inc., Novartis AG, Pfizer Inc, F. Hoffman-La Roche, Schering-Plough, Synarc, Inc., and Wyeth, as well as non-profit partners the Alzheimer's Association and Alzheimer's Drug Discovery Foundation, with participation from the U.S. Food and Drug Administration. Private sector contributions to ADNI are facilitated by the Foundation for the National Institutes of Health (www.fnih.org). The grantee organization is the Northern California Institute for Research and Education, and the study is coordinated by the Alzheimer's Disease Cooperative Study at the University of California, San Diego. ADNI data are disseminated by the Laboratory for Neuro Imaging at the University of California, Los Angeles. This research was also supported by NIH grants P30 AG010129, K01 AG030514, and the Dana Foundation.
Footnotes
Disclosure Statement
Dr. Anders M. Dale is a founder and holds equity in CorTechs Labs, Inc, and also serves on the Scientific Advisory Board. The terms of this arrangement have been reviewed and approved by the University of California, San Diego in accordance with its conflict of interest policies.
Dr. Linda K. McEvoy's spouse is CEO of CorTechs Labs, Inc.
References
- 1.Hardy J, Selkoe DJ. Science. 2002;297:353–6. doi: 10.1126/science.1072994. [DOI] [PubMed] [Google Scholar]
- 2.Spires-Jones TL, et al. Am J Patho. 2007;l 171:1304–11. doi: 10.2353/ajpath.2007.070055. [DOI] [PMC free article] [PubMed] [Google Scholar]
- 3.Kuchibhotla KV, et al. Neuron. 2008;59:214–225. doi: 10.1016/j.neuron.2008.06.008. [DOI] [PMC free article] [PubMed] [Google Scholar]
- 4.Crystal H, et al. Neurology. 1988;38:1682–7. doi: 10.1212/wnl.38.11.1682. [DOI] [PubMed] [Google Scholar]
- 5.Arriagada PV, et al. Neurology. 1992;42:631–9. doi: 10.1212/wnl.42.3.631. [DOI] [PubMed] [Google Scholar]
- 6.Holmes C, et al. Lancet. 2008;372:216–23. doi: 10.1016/S0140-6736(08)61075-2. [DOI] [PubMed] [Google Scholar]
- 7.Roberson ED, et al. Science. 2007;316:750–4. doi: 10.1126/science.1141736. [DOI] [PubMed] [Google Scholar]
- 8.Ittner LM, et al. Cell. 2010;142:387–97. doi: 10.1016/j.cell.2010.06.036. [DOI] [PubMed] [Google Scholar]
- 9.Freeman SH, et al. J Neuropathol Exp Neurol. 2008;67:1205–12. doi: 10.1097/NEN.0b013e31818fc72f. [DOI] [PMC free article] [PubMed] [Google Scholar]
- 10.Fagan AM, et al. Ann Neurol. 2006;59:512–519. doi: 10.1002/ana.20730. [DOI] [PubMed] [Google Scholar]
- 11.Strozyk D, et al. Neurology. 2007;60:652–6. doi: 10.1212/01.wnl.0000046581.81650.d0. [DOI] [PubMed] [Google Scholar]
- 12.Buerger K, et al. Brain. 2006;129:3035–41. doi: 10.1093/brain/awl269. [DOI] [PubMed] [Google Scholar]
- 13.Hesse C, et al. J Alzheimer Disease. 2000;2:199–206. doi: 10.3233/jad-2000-23-402. [DOI] [PubMed] [Google Scholar]
- 14.Shaw LM, et al. Ann Neurol. 2009;65:403–13. doi: 10.1002/ana.21610. [DOI] [PMC free article] [PubMed] [Google Scholar]
- 15.Holland D, Dale AM. Med Image Anal. 2011 Feb 23; doi: 10.1016/j.media.2011.02.005. [DOI] [PMC free article] [PubMed] [Google Scholar]
- 16.Jin M, et al. Proc Natl Acad Sci USA. 2011;108:5819–24. doi: 10.1073/pnas.1017033108. [DOI] [PMC free article] [PubMed] [Google Scholar]
- 17.Ittner LM, Gotz J. Nat Rev Neurosci. 2011;12:65–72. doi: 10.1038/nrn2967. [DOI] [PubMed] [Google Scholar]
- 18.Mormino EC, et al. Brain. 2009;132:1310–23. doi: 10.1093/brain/awn320. [DOI] [PMC free article] [PubMed] [Google Scholar]
- 19.Becker JA, et al. Ann Neurol. 2010 Nov 17; [Google Scholar]
- 20.Hampel H, et al. Exp Gerontol. 2010;45:30–40. doi: 10.1016/j.exger.2009.10.010. [DOI] [PMC free article] [PubMed] [Google Scholar]
Associated Data
This section collects any data citations, data availability statements, or supplementary materials included in this article.


