

Abstract
We study the drying of stratum corneum, the skin's outermost layer and an essential barrier to mechanical and chemical stresses from the environment. Even though stratum corneum exhibits structural features across multiple length-scales, contemporary understanding of the mechanical properties of stratum corneum is based on the assumption that its thickness and composition are homogeneous. We quantify spatially resolved in-plane traction stress and deformation at the interface between a macroscopic sample of porcine stratum corneum and an adherent deformable elastomer substrate. At length-scales greater than a millimeter, the skin behaves as a homogeneous elastic material. At this scale, a linear elastic model captures the spatial distribution of traction stresses and the dependence of drying behavior on the elastic modulus of the substrate. At smaller scales, the traction stresses are strikingly heterogeneous and dominated by the heterogeneous structure of the stratum corneum.
Introduction
The outermost layer of the epidermis or stratum corneum (SC) plays an essential role as a chemical and physical barrier. However, there is a low-level of steady-state water loss across the skin (1). Furthermore, as the external humidity changes, there can be a net change of water concentration in the SC, driving swelling and shrinkage. Swollen SC drives spontaneous wrinkling observed on the fingertips of a child who has spent too much time in the bath (2). Shrinking skin leads to the sensation of tightness felt after washing one's face on a cool dry day. In the presence of pathological skin conditions and/or extreme chemical or physical environments, the shrinkage of skin can lead to flaking and cracking (3–9). Previous studies characterizing the mechanics of the SC have used macroscopic testing equipment designed for homogenous materials (10–20). Such measurements, however, ignore the essential heterogeneity of SC, which has a rich topography across many length-scales (21). We suspect that local topographical features play an important role in defining the global mechanical response of the SC. This is a familiar concept from basic mechanics—where it is well known that the global failure of a material can be determined by the concentration of stress around defects, which for example, can nucleate cracks (22).
In this article, we take a first step toward understanding the influence of structural heterogeneities on the mechanics of skin. We apply traction force microscopy (23–30) to quantify the local variation of traction stresses in drying porcine SC (31). At length-scales <1 mm, local variation of stresses are correlated to native topographical features within the skin.
Materials and Methods
Preparation of the stratum corneum
SC samples are excised from the belly region of a pig (32). The full thickness skin is immersed consecutively in two water baths at 60°C for 1 min and 4°C for 30 s to loosen the epidermis from the dermis. The epidermis is then isolated by gently pushing it away from the underlying tissue in the direction of the hair growth. Detachment of the SC is performed by placing the epidermis on gauze soaked in an enzymatic trypsin solution (0.25% wt/vol catalogue No. T-0303 (Sigma, St. Louis, MO) in 0.01 M phosphate-buffered saline (GIBCO Life Technologies, Grand Island, NY) 1×, pH 7.4) at 25°C for 5 h. The SC is then gently tweezed from the remaining epidermal region, washed with deionized water (Direct-Q; Millipore, Billerica, MA) and then trypsin inhibitor (0.4% wt/vol catalogue No. T-9128 (Sigma) in deionized water) and allowed to dry to ambient conditions (25°C, 40% relative humidity (R.H.)) on gauze for at least 24 h. To ensure a consistent sample geometry, the SC is placed on filter paper and cut to size using a circular hole punch R = 3.1 ± 0.25 mm. Moreover, to achieve good subsequent adherence of the SC with the elastomer, hairs are removed by gentle tweezing. The SC is then placed on parafilm in a humidity chamber with a recorded relative humidity of 99% for 24 h to equilibrate. All SC samples are taken from the same source and exhibit similar topographical features.
Before testing, the SC is removed from the humidity chamber and carefully placed on an elastomer-coated coverslip, ensuring the underside of the SC is face down. A damp cotton swab is then used to lightly press the SC sample down onto the elastomer. Care is taken to ensure no creases or air bubbles form during this stage and that the SC is completely adhered to the elastomer. The sample and elastomer are placed back into the humidity chamber for a further 12 h to equilibrate to 99% R.H..
Preparation of elastomer-coated coverslips
A silicone elastomer is first prepared by mixing a base (Sylgard 184; Dow Corning, Midland, MI) with the curing agent in a weight ratio of 35:1. After mixing and degassing, it is spin-coated on to a glass coverslip (25 mm × 40 mm; Fisherbrand, Fisher Scientific, Pittsburgh, PA) at 2000 rpm for 1 min. The sample is baked at 60°C for 24 h, resulting in a 41-μm-thick elastomer film. The surface of the cured elastomer film is then chemically modified for bonding fluorescent beads by vapor-depositing silane (3-aminopropyl triethoxysilane) on the surface. A buffer solution for fluorescent beads is made by mixing sodium tetraborate and boric acid with deionized water to obtain the pH value at 7.4. To this solution, red fluorescent microspheres (500 nm diameter, carboxylate-modified; Molecular Probes, Eugene, OR) and 1% wt 1-ethyl-3-(3-dimethylaminopropyl) carbodiimide solution are added in a volume ratio of 3:200 and 1:100, respectively. Fluorescent beads are then adsorbed on the surface of the elastomer by floating it upside down on the bead suspension for 50 min before rinsing in deionized water (30). The resulting density of beads is ∼300 per 100 × 100 μm2. Another layer of elastomer is then spin-coated at 10,000 rpm for 1 min after the surface is fully dry, resulting in a 8-μm-thick film after baking in the oven at 60°C for 24 h. The resulting elastomer film has a Young's modulus of E = 130 ± 9 kPa and a Poisson's ratio of 0.5 (33). A schematic representation is shown later in Fig. 2 a. The Young's modulus of the substrate is purposefully matched to the reported stiffness of epidermal tissue (16). Substrates with a Young's modulus of E = 750 kPa (33) are created using an identical protocol with curer/base of 15:1. Soft substrates with kPa are created by using a silicone gel base (Toray CY52-276; Dow Corning) mixed with its counterpart curing agent in the ratio 1:1.The Young's modulus of this gel was estimated using bulk rheology (34,35).
Figure 2.
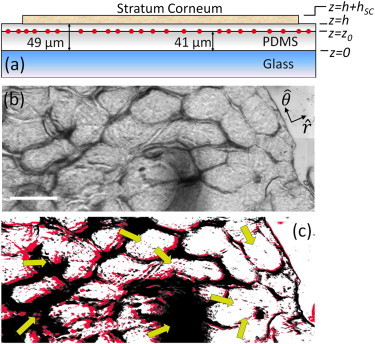
Heterogeneous deformation. (a) Schematic representation of the geometry of the substrate layer and the location of the fluorescent marker beads. (b) Transmitted light stitched image (1.65 × 0.66 mm) highlighting the topographical features at the edge of a circular SC sample. The edge of the sample is in the upper right of the image. The scale bar denotes 250 μm. (c) Overlay of filtered transmitted light images in panel b when fully equilibrated to 99% R.H. (gray/red) and after drying and equilibration to 25 ± 3% R.H. (black). The images have been translated so that the edges of the sample are coincident. (Arrows) Direction of deformation.
Imaging substrate and skin deformation
Images are acquired using a spinning disk confocal system (Revolution; Andor Technology, Belfast, Northern Ireland) mounted on an inverted microscope (Eclipse Ti; Nikon Instruments, Melville, NY) with 20× objective lens (Plan Fluor; Nikon Instruments) with a numerical aperture (NA) of 0.4. Fluorescent beads are excited using a 561-nm laser. Fluorescent and bright-field images are recorded using an iXon camera (Andor Technology) at a resolution of 512 × 512 pixel2. The field of view (FOV) of each image is 0.33 mm by 0.33 mm. This is comparable to the lengthscale of the smallest topographical features. Larger FOVs at the same magnification are acquired using an automated xy stage (460p; Newport Instruments, Costa Mesa, CA) and subsequent image stitching.
For dynamic studies, we image a 1.65 mm × 0.66 mm FOV every 36 s over a 1.5-2 h drying period from an initially fully hydrated state (99% R.H.) within a controlled environment (25 ± 3% R.H.). The imaged region is consistently located at the edge of each SC sample and includes a region where SC is not adhered to the elastomer to account for microscope drift.
For static studies, we stitch together a 30 × 30 grid of bright-field and fluorescent images. The final stitched FOV is 6.5 mm × 6.5 mm. Unlike the dynamic technique, temporal variations in stress cannot be measured because the timescale required to record all the composite images (3.5 h) is comparable to the drying timescale of the SC. Moreover, the conditions that the SC experiences during this period must be kept constant to prevent changes in water content. Images are therefore recorded when the SC is equilibrated to 99% R.H. and after drying and equilibration to laboratory conditions (54 ± 3% R.H.).
Imaging skin topography
The lipids in SC are stained with fatty acid fluorescent analog BODIPY FL C12 lipid dye (Invitrogen, Carlsbad, CA). A quantity of 100 mL of 0.6 mg/mL solution of BODIPY FL C12 in ethyl alcohol is dissolved in 1 mL of carbonate buffer (pH = 10). The SC sample is immersed into the solution for ∼1 min and then rinsed with citric buffer with pH = 5.5. Confocal image stacks are acquired using the spinning disk microscope with a 40× oil-immersion objective lens (Plan Fluor; Nikon Instruments) with an NA of 1.30. The composite image shown in Fig. 1 d is created by recording an image stack of 50 images separated by Δz = 100 nm and visualized using IQ software (Andor).
Figure 1.
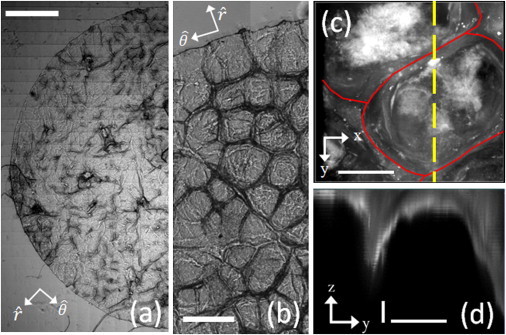
SC topography. (a) Stitched bright-field image (6000 × 12,000 pixels) of a hydrated (99% R.H.) circular sample of porcine SC (R = 3.1 mm) adhered to elastomer substrate (E = 130 ± 9 kPa). (Scale bar) 1 mm. (b) Magnified view of a typical region of SC highlighting polygonal-shaped cluster/canyon regions. (Scale bar) 250 μm. (c) Three-dimensional confocal image of a cluster region stained with BODIPY FL C12 lipid dye. (Solid line) Location of the surrounding canyon. (Dashed line) Profile view displayed in panel d. (Horizontal scale bar) 50 μm. (d) Cross section through a cluster highlighting the canyon features. (Vertical and horizontal scale bars) 1 μm and 50 μm, respectively. This scaling has been employed for visual clarity.
Measuring deformation of unconstrained skin
Hydrated SC samples are balanced upside down on a standard glass microscope slide using the hairs that are left untweezed in the sample. Samples are allowed to dry within stable laboratory conditions (25 ± 3% R.H.) for 4 h. Edge deformation measurements are made by comparing the initial and final edge locations, accounting for microscope drift. Measurements are made on three individual SC samples at five edge locations within each image set.
Humidity control
SC samples are equilibrated to a fully hydrated state before experimentation by placing them on a raised platform within a sealed plastic box partially filled with deionized water. The conditions within the box are continually monitored using a 445815 hygrometer with probe (Extech Instruments, Nashua, NH). The box experiences stable conditions of 99% R.H. within 20 min of the box being sealed.
Once removed from this chamber, a smaller (15-mm diameter, 12-mm height) chamber is placed directly over the SC sample to minimize water loss before experimentation. The chamber is made from a circular plastic tube sealed at the top with a glass coverslip to allow transmission of light to the sample when mounted on the microscope and glued at the base to a steel nut (14 mm inner diameter) to ensure complete contact of the chamber base with the elastomer. A thin strip of wetted sponge is attached to the inner surface of the chamber. A thin layer of high-vacuum grease (Dow Corning, Plan Fluor; Nikon) is applied to the base of the nut to ensure the chamber is completely sealed.
With the chamber then removed, the SC is allowed to dry and equilibrate to laboratory conditions. The humidity of the laboratory remained stable at 25 ± 5% for the dynamic measurements and 54 ± 5% for the static technique before and throughout each experiment.
Calculation of displacement and stress
Two-dimensional displacements of tracer beads are calculated for the dynamic measurements using centroid tracking algorithms (36). The displacement field is then established by interpolating the displacement of randomly dispersed beads into a two-dimensional spatial grid with a spacing equal to the mean distance between tracer beads. In this study, the grid spacing is ∼15 μm. The displacement caused by drift during the experiments is eliminated by subtracting the mean displacement of tracer beads in regions >50 μm away from the SC sample edge. Once the two-dimensional displacement field is established, the in-plane stress at the interface of the elastomer and SC is calculated in Fourier space using a simplified version of the technique described by Xu et al. (30), essentially identical to the one described by del Alamo et al. (26).
Two-dimensional tracer beads displacements for the wider FOV static measurements are calculated either using a standard particle-image-velocimetry (PIV) algorithm (37) or a more computationally intensive hybrid PIV/centroid tracking method. This latter technique is employed because particle displacements can be larger than interparticle spacing—a known limit for direct particle-centroid-tracking methods (38). The hybrid method first employs a PIV tracking algorithm using a 42 × 42 μm grid size to obtain low-resolution average displacements. The location of particle centroids in the hydrated (99% R.H.) and dry (54 ± 3% R.H.) state are then established. The average PIV displacement for each grid region is then subtracted from the dry-state particle positions and a centroid tracking algorithm used to find modified particle displacements. Finally, the modified particle centroid tracking and PIV displacements are summed to give the total displacement of each particle.
Results and Discussion
The topography of SC is heterogeneous. Bright-field images of hydrated porcine SC are shown in Fig. 1, a and b. At the millimeter scale, the SC has hair follicles and invaginations. At the 0.1-mm scale, the SC also exhibits polygon-shaped clusters of keratinized cells surrounded by lipid-rich canyons, as previously described in both human and porcine SC (21,39). Because the contrast mechanisms of bright-field microscopy can be ambiguous, we visualize the structure of SC in three dimensions using confocal imaging of a fluorescent lipid stain. In Fig. 1, c and d, we visualize the structure around a 100-μm-wide cluster, which is surrounded by a 3–5-μm deep canyon.
The drying-induced deformation of adherent SC is heterogeneous. To visualize this drying, it is essential to place it on a compliant substrate. As shown in Fig. 2 a, we place SC samples (R = 3.1 ± 0.25 mm) on a h = 49-μm-thick layer of silicone elastomer (Sylgard 184; Dow Corning), with an elastic modulus of E = 130 ± 9 kPa (33), which is similar to published values of the modulus of the viable epidermis (16). SC is equilibrated at 99% R.H., adhered to the elastomer and visualized in transmitted light, as shown in Fig. 2 b. It is then allowed to equilibrate at 25 ± 3% R.H. In Fig. 2 c, false-color filtered bright-field images of the hydrated (gray/red) and dry (black) feature locations are overlaid. The images are translated so that the locations of the edge of the SC sample at the two time points overlap. The arrows indicate the direction of deformation, which varies across the sample.
This qualitative analysis unambiguously indicates heterogeneity in drying deformation. However, it reveals neither the internal drying stresses that drive deformation nor the traction stress applied to the substrate. Even if the mechanical properties of the SC were known, the stress fields cannot readily be determined from the deformation field due to spatial and temporal inhomogeneities in topography and water content. For example, previously studies have found that the apparent mean Young's modulus of human SC ex vivo increases dramatically from E = 28.4 ± 2 MPa at 99% R.H. to E = 272 ± 4 MPa at 15% R.H. (19). Stress measurements, therefore, need to be calibrated against an external reference with well-defined mechanical properties. We determine traction stresses from the two-dimensional deformation field within a plane of the adherent elastomer substrate (thickness μm). Thus, the deformable elastomer acts both as a calibrated medium to determine stresses and as a deformable ex vivo substitute for the epidermis. We quantify the deformation of the elastomer from in-plane displacements of fluorescent tracer particles (diameter = 500 nm) at the plane z = z0, ∼8 μm below the surface of the elastomer at z = h, using particle-image-velocimetry algorithms as shown in Fig. 2 a. To resolve the subtle displacements of the tracer particles within the elastomer, we need to work at a high magnification, which restricts the FOV of a single image to 330 μm. This length-scale is comparable to a typical topographical feature size. To adequately sample the spatial variation of the drying stresses, multiple images are recorded in a grid layout and then subsequently stitched together using digital cross correlation. To image the entire 6.2-mm diameter SC sample described here, 900 partially overlapping images are acquired. Half of the final stitched image is shown in Fig. 1 a.
To determine the stresses from the elastomer deformation, we solve the governing equations of elastostatics for an isotropic linear elastic medium using the equation of equilibrium given by
| (1) |
where ν is the Poisson's ratio and is the displacement in the substrate (30). First, we specify the stress on the free surface, where equals the force per unit area on the surface in the ith direction. For films bonded on one side to a rigid plane, . This second boundary condition is ignored in most applications of traction force microscopy, but it is essential here because the length-scale of variation of the traction stresses is much greater than the thickness of the elastomer (27,29,30). Physically, this boundary condition imposes a cutoff in the range of elastic interactions, on the order of the elastomer thickness. Although this boundary condition accurately reflects our experiments, it is less relevant in vivo, where the epidermis is supported by the dermis, a very compliant substrate.
For small deformations, the stress and displacement are simply related by a tensor product in Fourier space,
| (2) |
where is the spatial Fourier transform of the displacements at a height z0 above the rigid plane, and is the wave vector in the xy plane, with summation over repeated indices. The tensor Q is analogous to the spring constant of a simple one-dimensional system. It describes the mechanical response of the elastic substrate incorporating its material properties and geometry. Full details of the calculation of Q and its mathematical form are provided in the supplemental information of Xu et al. (30). Although the approach of Xu et al. is generally applicable to in-plane and normal stresses, such measurements require knowledge of all three components of the deformation field, which can be achieved by three-dimensional particle tracking with confocal microscopy. Here, three-dimensional confocal imaging is too cumbersome because of our need to scan a very wide FOV in plane. Here, we assume the normal stresses are equal to zero and simply measure the in-plane deformations of the substrate. This is an excellent approximation for a homogeneous thin film, though we expect that there may be normal stresses in locations where there is an appreciable gradient in the sample thickness.
Deformations and stresses for a dry SC sample (equilibrated to 54 ± 3% R.H.) relative to the fully hydrated state are shown in Fig. 3. Exploiting the approximate radial symmetry of our sample, we project the stresses and deformations onto the local radial and azimuthal directions. The radial and azimuthal deformations at z = z0 are shown in Fig. 3, a and b, respectively. Deformations occur primarily in the radial direction with the largest magnitudes close to the sample edge and smallest toward the center. Azimuthal deformations are nonzero and do not exhibit clear trends in magnitude with radial position from the sample center. Nonzero azimuthal deformations and nonmonotonic radial deformations suggest that local variations in the thickness or composition of the skin impact drying behavior.
Figure 3.
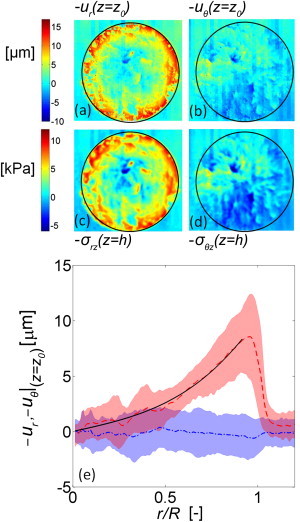
Deformation and traction stress in drying stratum corneum. Heat maps describing spatial variations in drying SC deformation at height z = z0 within the adherent E = 130 kPa elastomer substrate. Deformations have been decomposed into (a) radial and (b) azimuthal directions. Drying occurs when fully hydrated SC is adhered to the substrate and allowed to dry from 99% R.H. to 54 ± 3% R.H. in a controlled environment over a 12 h period to ensure equilibration. Heat maps describing spatial variations in drying traction stress at the interface between SC and elastomer (z = h) decomposed into (c) radial and (d) azimuthal directions. (e) Azimuthally averaged radial (, dashed line) and azimuthal deformations (, dot-dashed line) at z = z0 within the substrate, plotted against dimensionless radial position r/R. Shaded regions surrounding the lines indicate the standard deviation about the mean. (Solid black curve) Least-square best fit of the radial displacement profile at z = z0 using Eq.10 with α = 0.027 and β = 4.2, as discussed later.
Spatial distributions of traction stress are calculated using Eq. 2 and plotted in Fig. 3, c and d. These describe traction stresses imposed on the underlying substrate by the drying SC at the interface between the sample and the elastomer. In vivo, these traction stresses are transmitted to the live epidermis, where mechanotransduction can take place. The spatial distributions are decomposed into radial, (c) and azimuthal (d) components. The magnitude of stresses outside of the sample gives a sense for the experimental uncertainties in our stress measurements arising from errors in measurements of the elastomer deformation field. Here the root mean-square (RMS) stress level outside the sample is 0.9 kPa. It is important to note that we have determined these stresses from a direct application of Eq. 2 without any iterative procedures that force the stresses to be zero outside of the sample (24,29).
Mirroring the deformation field, traction stresses increase toward the edge of the sample and stresses in the radial direction are typically larger than stresses in the azimuthal direction. This is neatly summarized in Fig. 3 e, which shows the azimuthally averaged radial and azimuthal displacements at z = z0 as a function of the dimensionless radial position r/R, where r/R = 1 denotes the sample edge. Whereas the mean radial deformation increases monotonically from the center to the edge, the mean azimuthal deformation remains near zero irrespective of radial position. The shaded regions denote the standard deviation of displacements about the mean and indicate that the variations of displacement in both the radial and azimuthal directions are significant. Displacements near the edge of the sample are primarily orientated radially; however, within the range r/R < 0.5 the average magnitude of the standard deviation is comparable to the mean displacement. This indicates that the heterogeneous component of drying in this region is comparable in magnitude to the global drying behavior and local displacements are presumably determined by local compositional heterogeneities. This region may be the best indicator of drying mechanics in vivo because it does not exhibit strong edge effects.
Displacement and traction stress distributions in Fig. 3, a–d, clearly exhibit heterogeneities. To differentiate inherent compositional heterogeneities from heterogeneities due to finite sample size, we describe a simple continuum model of drying behavior in SC. We consider the problem of a thin, shrinking elastic circular sheet of material of uniform thickness hSC and radius R adhered to a substrate (34,40,41). Based on the radial and azimuthal displacement and stress profiles in Fig. 3, we assume rotational symmetry and demand that no quantities depend on orientation, θ. In cylindrical coordinates, we assume solutions for the SC displacements of the form,
| (3) |
In the radial direction, force balance requires
| (4) |
We average the above equation in the thickness coordinate z. We assume a stress-free top surface , and that the skin does not slip relative to the substrate, ui(z = h) = νi(z = h). For the purposes of this model, we take a simplified model of the elasticity of the substrate, where the local stress is proportional to the local displacement and
with the bar denoting a z-averaged quantity. In this case, the substrate is characterized by a substrate rigidity parameter, Y. This approximation is exact in the limit as the substrate thickness goes to zero, where Y = E/2(1 + ν)h. Thus,
| (5) |
We model the skin as a homogeneous elastic material with modulus, ESC, and Poisson's ratio, νSC. We assume that drying induces an homogeneous isotropic contractile stress with a magnitude of P. Dropping bars for simplicity, internal radial and hoop stresses are given by
| (6) |
and
| (7) |
Substituting Eqs. 6 and 7 into Eq. 5, we obtain the governing equation for the interfacial radial deformation ur,
| (8) |
where the term, lp, corresponds to a penetration depth, given by
| (9) |
The boundary conditions for sample deformation are and . An expression for the radial deformation profile is expressed in terms of modified Bessel functions and given by
| (10) |
with α = P(1 + νSC)(1 − 2νSC)/ESC(1 − νSC), β = R/lp, and
| (11) |
In the limit β ≪ 1, drying deformations are not resisted by the elasticity of the substrate and the radial traction stress profile becomes linear with ur(R,h) ∼ −0.6αR. In the limit β ≪ 1, the substrate effectively resists the shrinking of the skin and deformations and traction stresses are confined within a distance, lp, from the edge.
This model describes the large-scale deformation profile in drying skin. To compare with our data, we propagate the model's displacement profile from z = h to z = z0 using
A least-squares fit to the radial profile, , given in Fig. 3 e, yields α = 0.027 and β = 4.2. As a simple check of the predictive power of our model, we calculate the expected edge displacement during drying of an unconstrained piece of otherwise identical SC, ur(r)|z=h = −0.6αR = −50 μm, equivalent to a mean radial strain of 0.016. We measure the edge displacement for two unconstrained samples of SC over the same change in humidity, averaged over eight locations. We find ur(R) = −43 ± 12 μm, equal to a mean radial strain of 0.014 and in good agreement with our model. The fit to β provides information about the elastic properties of the SC. Assuming a Poisson ratio νSC = 0.4 (19), we extract a value of ESC = 23 MPa from Eq. 9 using ν = 0.5 and mean thickness values hSC = 9.8 μm and h = 49 μm, measured using confocal microscopy. This value falls within the diverse range of SC elastic moduli previously reported for mammalian SC (∼0.005–9 GPa) but remains low in comparison to the measured elastic moduli of porcine SC (∼0.12–9 GPa) for this drying condition (13,42–44). Upon substituting our estimate of ESC into α, we establish a value of P = 1.3 MPa for the osmotic contractile stress.
To further test this model, we explore the variation in drying behavior with the stiffness of the substrate. We measure drying traction stresses and displacements in circular SC samples adhered to substrates with consistent thicknesses and varying elastic moduli. We focus on a small section (0.66 × 1.29 mm) near the edge of the sample, as shown in Fig. 1 b. Fig. 4, a and b, shows drying displacements and stresses at the edge of SC samples for four different substrate stiffnesses. In addition to three samples measured on deformable silicone (E = 3, 130, and 750 kPa), we measure the deformation of an unadhered SC sample (E = 0). All data are collected after a 1.5 h drying period within stable laboratory conditions (25 ± 3% R.H.). During this period, traction stresses grow and begin to plateau toward an equilibrium value, as shown in Fig. 4 c. Indeed, the substrate stiffness has a large impact on the extent of skin shrinkage. Whereas the deformation of free SC samples, ur(R) = −55.1 ± 10.9 μm, is nearly the same as SC adhered to a 3-kPa substrate (ur(R) = −57.9 ± 11.4 μm), the deformation drops rapidly for SC on stiffer substrates, with no measurable deformation on glass. On the other hand, the traction stresses increase monotonically with substrate stiffness in the regime E ≤ 0.75 MPa.
Figure 4.
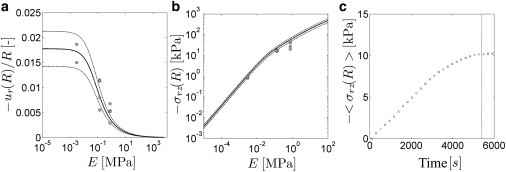
Drying behavior on substrates with different elastic moduli. (a) Mean-edge radial drying displacement plotted against the elastic modulus of the substrate. (Solid symbols) Individual measurements of drying-edge displacements in samples adhered to a deformable substrate with 3 ≤ E ≤ 750 kPa. (Solid line) Best-fit edge deformation profile from Eq. 10 with ESC = 40 MPa. (b) Mean radial traction stress σrz(R) at the edge of SC samples plotted against substrate elastic modulus. (Solid symbols) Individual measurements of drying-edge traction stress in samples adhered to a deformable substrate with 3 ≤ E ≤ 750 kPa. Laboratory conditions are stable at 25 ± 3% R.H. in each experiment. (Solid line) Edge-stress predictions based on Eq. 10 and σrz = Yur. (In both a and b, dotted lines represent variations in model predictions based on the measured standard deviation of free drying SC, ur(R) = −55.1 ± 10.9 μm (n = 3).) (c) Temporal variation in average traction stress at the edge of a typical SC sample (R = 3.1 mm) adhered to an E = 130 kPa substrate drying to 25% R.H. from an initially hydrated state. The dashed line (t = 90 min) indicates the selected drying timescale for the measurements in panels b and c.
Results in Fig. 4, a and b, are compared with predicted variations of edge displacement, ur(R), and traction stress, σrz(R) as a function of substrate stiffness using Eq. 10. Best-fit values of α = 0.030 and β = 3.2 imply ESC = 40 MPa and osmotic contractile stress P = 2.5 MPa. Here, P and ESC are higher than the values inferred from the static stress profiles at a higher humidity (Fig. 3 e). This is consistent with expected changes for drying at a lower humidity condition (13,19). With these fitted values, model edge displacements and traction stresses show good agreement with the measured results. For ESC ≤ 0.5 kPa, the substrate does not notably alter drying-edge displacements from that of the unconstrained case. For increasingly stiffer substrates, drying-edge displacements decrease and tend toward negligibly small deformations. The variation in edge traction stress with elastic modulus is linear for ESC ≤ 10 kPa; however, for elastic moduli larger than this value, stresses increase sublinearly.
Although the global drying behavior in millimeter-sized SC samples is well described by a model that assumes the SC is homogeneous, it breaks down at smaller length-scales. To explore the limitations of the homogeneous approximation, we consider the residual displacement field, the difference between the measured displacement field and the model,
The resulting heterogeneity map is presented in Fig. 5 a. Deviations from the homogeneous drying model are spatially correlated, with feature sizes of ∼0.5 mm. To quantitatively characterize the scale-dependent deviations from the homogeneous drying model, we consider the deviations in Fourier space. The azimuthal average of the Fourier transform of both measured and model displacement fields, , is plotted against the wave vector, k, in Fig. 5 b. We find that the model and measured profiles agree to within 30% for wave vectors smaller than k = 9 mm−1. For larger wave vectors, the deviation between the two profiles indicates that the heterogeneous component of drying dominates. The crossover length-scale between these two regimes is ∼0.7 mm.
Figure 5.
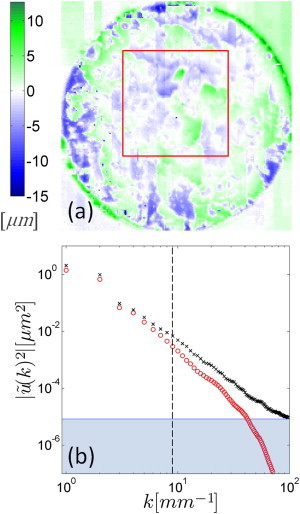
Heterogeneous drying in SC. (a) Heterogeneity map of drying radial displacements at height z = z0 within the substrate arising after drying of the SC from 99% to 54 ± 3% R.H. and produced by subtracting the projected model component of radial displacement in Fig. 3e at each radial position r from local radial deformation field components in Fig. 3a with equivalent radial position u′r(r,θ,z0) = ur(r,θ,z0) – ur(r,θ,z0)Model. The box corresponds to the region described in Fig. 6. (b) Comparison of model (circle) and measured (cross) azimuthally averaged Fourier transforms of the radial displacement fields plotted against wave vector. (Vertical dashed line) k = 9 mm−1; the wave vector at which model and measured profiles deviate by >30%. (Shaded region) Measured spatial resolution limit; calculated by performing the same process on an array equal in size to the measured displacement field and populated with a random Gaussian distribution of displacements with a standard deviation equal to the measured RMS level of ±560 nm outside the sample.
Finally, we explore the origin of stress heterogeneities in the SC at smaller length-scales. Fig. 6 shows the traction stress quiver plots in the inner 2.9 × 2.9 mm region of a circular SC sample after drying from 99% R.H. and equilibrating to 54 ± 3% R.H., overlaid on the stitched bright-field image of the same region. This region, highlighted by the box in Fig. 5 a, is mostly located within the range r/R ≤ 0.5, where the displacements due to the large-scale drying behavior are small, and therefore probably most similar to drying in vivo. In this case, regions of highest stress, most notably the region toward the center of the figure, correspond with a hair follicle. Regions of abrupt spatial changes in stress orientation or magnitude correlate with other topographical features, including invaginations and canyon regions surrounding clusters. These results suggest that the topography of the SC is the primary cause of stress heterogeneities during drying.
Figure 6.
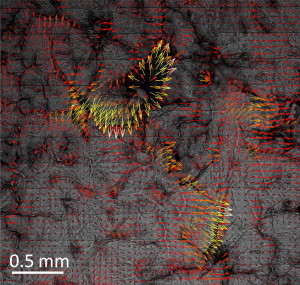
Correlation of traction stresses and SC topography. Quiver plot of traction stress within the inner (2.9 mm × 2.9 mm) region of a circular sample after drying from 99% R.H. and equilibrating to 54 ± 3% R.H. over 12 h overlaid on a bright-field stitched image of the region to highlight the spatial correlation of traction stress and topography. Arrows are color-scaled by stress magnitude from maximum (white, |σiz| = 8.46 kPa) to minimum (black, |σiz| = 0 kPa). Only one in nine of the arrows have been plotted in the image to aid visual clarity.
Conclusion
Stratum corneum exhibits rich topographical features over many length-scales. Using traction force microscopy, we investigate spatial distributions of traction stress and deformation in drying porcine stratum corneum samples adhered to deformable substrates with mechanical properties similar to reported values of epidermal tissue (16). A continuum model that assumes homogeneous composition and thickness of stratum corneum quantitatively describes deformations on large length-scales, including deformation profiles and the dependence of edge displacements on substrate stiffness. However, stress and displacement fields exhibit significant deviations from this simple model for length-scales <∼0.7 mm. At these smaller length-scales, we observe that regions of abrupt change in traction stress magnitude and orientation correlate with locations of topographical features ranging in length-scale from invaginations at the just below the millimeter scale to clusters and canyons at ∼100 μm.
The physiological relevance of the mechanical heterogeneity of skin needs to be investigated. Schellander and Headington (21) and subsequently Ferguson and Barbenel (45) have proposed that the topographical features in stratum corneum help alleviate the buildup of stress and strain during drying. Similarly, small-scale topographical features could change the macroscopic mechanical properties of stratum corneum. In other words, the elastic modulus reported by any macroscopic measurement would depend on the local elastic modulus and the topography of the sample. Future work should relate the local elastic modulus, perhaps measured by nanoindentation, to the apparent macroscopic elastic modulus. Indeed, the dependence of apparent elastic properties on surface topography may explain the highly variable values reported for the stratum corneum elastic modulus (13,42–44).
Acknowledgments
We acknowledge funding from Unilever and the National Science Foundation (grant No. DBI-0619674).
References
- 1.Rawlings A.V., Harding C.R. Miniaturization and skin barrier function. Dermatol. Ther. 2004;17(Suppl 1):43–48. doi: 10.1111/j.1396-0296.2004.04s1005.x. [DOI] [PubMed] [Google Scholar]
- 2.Genzer J., Groenewold J. Soft matter with hard skin: from skin wrinkles to templating and material characterization. Soft Matter. 2006;2:310–323. doi: 10.1039/b516741h. [DOI] [PubMed] [Google Scholar]
- 3.Gaul L.E., Underwood G.B. Relation of dew point and barometric pressure to chapping of normal skin. J. Invest. Dermatol. 1952;19:9–19. doi: 10.1038/jid.1952.61. [DOI] [PubMed] [Google Scholar]
- 4.Middleton J.D., Allen B.M. The influence of temperature and humidity on stratum corneum and its relation to skin chapping. J. Soc. Cosmet. Chem. 1973;24:239–243. [Google Scholar]
- 5.Watanabe M., Tagami H., Kligman A.M. Functional analyses of the superficial stratum corneum in atopic xerosis. Arch. Dermatol. 1991;127:1689–1692. [PubMed] [Google Scholar]
- 6.Boyce J.M., Kelliher S., Vallande N. Skin irritation and dryness associated with two hand-hygiene regimens: soap-and-water hand washing versus hand antisepsis with an alcoholic hand gel. Infect. Control Hosp. Epidemiol. 2000;21:442–448. doi: 10.1086/501785. [DOI] [PubMed] [Google Scholar]
- 7.Harding C.R. The stratum corneum: structure and function in health and disease. Dermatol. Ther. 2004;17(Suppl 1):6–15. doi: 10.1111/j.1396-0296.2004.04s1001.x. [DOI] [PubMed] [Google Scholar]
- 8.Kedrowski D.A., Warshaw E.M. Hand dermatitis: a review of clinical features, diagnosis, and management. Dermatol. Nurs. 2008;20:17–25. quiz 26. [PubMed] [Google Scholar]
- 9.Kirkup M.E.M. Xerosis and stasis dermatitis. Preventive Dermatol. 2010;2:71–79. [Google Scholar]
- 10.Agache P., Boyer J.P., Laurent R. Biomechanical properties and microscopic morphology of human stratum corneum incubated on a wet pad in vitro. Arch. Dermatol. Forsch. 1973;246:271–283. doi: 10.1007/BF00595426. [DOI] [PubMed] [Google Scholar]
- 11.Wilkes G.L., Brown I.A., Wildnauer R.H. The biomechanical properties of skin. CRC Crit. Rev. Bioeng. 1973;1:453–495. [PubMed] [Google Scholar]
- 12.Marks R. The stratum corneum barrier: the final frontier. J. Nutr. 2004;134(8, Suppl):2017S–2021S. doi: 10.1093/jn/134.8.2017S. [DOI] [PubMed] [Google Scholar]
- 13.Yuan Y., Verma R. Measuring microelastic properties of stratum corneum. Colloids Surf. B Biointerfaces. 2006;48:6–12. doi: 10.1016/j.colsurfb.2005.12.013. [DOI] [PubMed] [Google Scholar]
- 14.Hendriks, F. M. 2005. Mechanical behavior of human epidermal and dermal layers. PhD thesis. Technische Universiteit Eindhoven, The Netherlands.
- 15.Pailler-Mattei C., Bec S., Zahouani H. In vivo measurements of the elastic mechanical properties of human skin by indentation tests. Med. Eng. Phys. 2008;30:599–606. doi: 10.1016/j.medengphy.2007.06.011. [DOI] [PubMed] [Google Scholar]
- 16.Kuwazuru O., Saothong J., Yoshikawa N. Mechanical approach to aging and wrinkling of human facial skin based on the multistage buckling theory. Med. Eng. Phys. 2008;30:516–522. doi: 10.1016/j.medengphy.2007.06.001. [DOI] [PubMed] [Google Scholar]
- 17.Xing L., Boppart S.A. Biomechanical properties of in vivo human skin from dynamic optical coherence elastography. IEEE Trans. Biomed. Eng. 2010;57:953–959. doi: 10.1109/TBME.2009.2033464. [DOI] [PMC free article] [PubMed] [Google Scholar]
- 18.Wildnauer R.H., Bothwell J.W., Douglass A.B. Stratum corneum biomechanical properties. I. Influence of relative humidity on normal and extracted human stratum corneum. J. Invest. Dermatol. 1971;56:72–78. doi: 10.1111/1523-1747.ep12292018. [DOI] [PubMed] [Google Scholar]
- 19.Levi K., Weber R.J., Dauskardt R.H. Drying stress and damage processes in human stratum corneum. J. Cosmet. Sci. 2009;32:1–18. doi: 10.1111/j.1468-2494.2009.00557.x. [DOI] [PubMed] [Google Scholar]
- 20.Hendriks F.M., Brokken D., Baaijens F.P. The relative contributions of different skin layers to the mechanical behavior of human skin in vivo using suction experiments. Med. Eng. Phys. 2006;28:259–266. doi: 10.1016/j.medengphy.2005.07.001. [DOI] [PubMed] [Google Scholar]
- 21.Schellander F.A., Headington J.T. The stratum corneum—some structural and functional correlates. Br. J. Dermatol. 1974;9I:507. doi: 10.1111/j.1365-2133.1974.tb12938.x. [DOI] [PubMed] [Google Scholar]
- 22.Lawn B. 2nd ed. Cambridge University Press; Cambridge, UK: 1993. Fracture of Brittle Solids. [Google Scholar]
- 23.Dembo M., Wang Y.L. Stresses at the cell-to-substrate interface during locomotion of fibroblasts. Biophys. J. 1999;76:2307–2316. doi: 10.1016/S0006-3495(99)77386-8. [DOI] [PMC free article] [PubMed] [Google Scholar]
- 24.Butler J.P., Tolić-Nørrelykke I.M., Fredberg J.J. Traction fields, moments, and strain energy that cells exert on their surroundings. Am. J. Physiol. Cell Physiol. 2002;282:C595–C605. doi: 10.1152/ajpcell.00270.2001. [DOI] [PubMed] [Google Scholar]
- 25.Beningo K.A., Wang Y.L. Flexible substrata for the detection of cellular traction forces. Trends Cell Biol. 2002;12:79–84. doi: 10.1016/s0962-8924(01)02205-x. [DOI] [PubMed] [Google Scholar]
- 26.Del Alamo J.C., Meili R., Lasheras J.C. Spatio-temporal analysis of eukaryotic cell motility by improved force cytometry. Proc. Natl. Acad. Sci. USA. 2007;104:13343–13348. doi: 10.1073/pnas.0705815104. [DOI] [PMC free article] [PubMed] [Google Scholar]
- 27.Sabass B., Gardel M.L., Schwarz U.S. High resolution traction force microscopy based on experimental and computational advances. Biophys. J. 2008;94:207–220. doi: 10.1529/biophysj.107.113670. [DOI] [PMC free article] [PubMed] [Google Scholar]
- 28.Iwadate Y., Yumura S. Molecular dynamics and forces of a motile cell simultaneously visualized by TIRF and force microscopies. Biotechniques. 2008;44:739–750. doi: 10.2144/000112752. [DOI] [PubMed] [Google Scholar]
- 29.Trepat X., Wasserman M.R., Fredberg J.J. Physical forces during collective cell migration. Nat. Phys. 2009;5:426–430. [Google Scholar]
- 30.Xu Y., Engl W.C., Dufresne E.R. Imaging in-plane and normal stresses near an interface crack using traction force microscopy. Proc. Natl. Acad. Sci.USA. 2010;107:14964–14967. doi: 10.1073/pnas.1005537107. [DOI] [PMC free article] [PubMed] [Google Scholar]
- 31.Vinson L.J., Singer E.J., Masurat T. The nature of the epidermal barrier and some factors influencing skin permeability. Toxicol. Appl. Pharmacol. 1965;7:7–19. [Google Scholar]
- 32.Kligman A.M., Christophers E. Preparation of isolated sheets of human stratum corneum. Arch. Dermatol. 1963;88:702–705. doi: 10.1001/archderm.1963.01590240026005. [DOI] [PubMed] [Google Scholar]
- 33.Cesa C.M., Kirchgessner N., Merkel R. Micropatterned silicone elastomer substrates for high resolution analysis of cellular force patterns. Rev. Sci. Instrum. 2007;78:034301. doi: 10.1063/1.2712870. [DOI] [PubMed] [Google Scholar]
- 34.Mertz A.F., Banerjee S., Dufresne E.R. Scaling of traction forces with size of cohesive cell colonies. Phys. Rev. Lett. 2012;108:088103. doi: 10.1103/PhysRevLett.108.198101. [DOI] [PMC free article] [PubMed] [Google Scholar]
- 35.Jerison E.R., Xu Y., Dufresne E.R. Deformation of an elastic substrate by a three-phase contact line. Phys. Rev. Lett. 2011;106:186103. doi: 10.1103/PhysRevLett.106.186103. [DOI] [PubMed] [Google Scholar]
- 36.Crocker J.C., Grier D.G. Methods of digital video microscopy for colloidal studies. J. Colloid Interface Sci. 1996;179:298–310. [Google Scholar]
- 37.Willert C.E., Gharib M. Digital particle image velocimetry. Exper. Fluids. 1991;10:181–193. [Google Scholar]
- 38.Ouellette N.T., Xu H., Bodenschatz E. A quantitative study of three-dimensional Lagrangian particle tracking algorithms. Exper. Fluids. 2006;40:301–313. [Google Scholar]
- 39.Carrer D.C., Vermehren C., Bagatolli L.A. Pig skin structure and transdermal delivery of liposomes: a two photon microscopy study. J. Control. Release. 2008;132:12–20. doi: 10.1016/j.jconrel.2008.08.006. [DOI] [PubMed] [Google Scholar]
- 40.Banerjee S., Marchetti M.C. Substrate rigidity deforms and polarizes active gels. Europhys. Lett. 2011;96:28003. [Google Scholar]
- 41.Edwards C.M., Schwarz U.S. Force localization in contracting cell layers. Phys. Rev. Lett. 2011;107:128101. doi: 10.1103/PhysRevLett.107.128101. [DOI] [PubMed] [Google Scholar]
- 42.Wu K.S., van Osdol W.W., Dauskardt R.H. Mechanical properties of human stratum corneum: effects of temperature, hydration, and chemical treatment. Biomaterials. 2006;27:785–795. doi: 10.1016/j.biomaterials.2005.06.019. [DOI] [PubMed] [Google Scholar]
- 43.Papir Y.S., Hsu K.H., Wildnauer R.H. The mechanical properties of stratum corneum. I. The effect of water and ambient temperature on the tensile properties of newborn rat stratum corneum. Biochim. Biophys. Acta. 1975;399:170–180. doi: 10.1016/0304-4165(75)90223-8. [DOI] [PubMed] [Google Scholar]
- 44.Park A.C., Baddiel C.B. Rheology of stratum corneum I: a molecular interpretation of the stress-strain curve. J. Soc. Cosmet. Chem. 1972;23:3–12. [Google Scholar]
- 45.Ferguson J.M., Barbenel J.C. Bioengineering and the Skin. MTP; Lancaster, Cumbria, UK: 1983. Skin surface patterns and the directional mechanical properties of the dermis; pp. 83–92. [Google Scholar]