

Abstract
Calcium (Ca) is a ubiquitous second messenger that regulates many biological functions. The elementary events of local Ca signaling are Ca sparks, which occur randomly in time and space, and integrate to produce global signaling events such as intra- and intercellular Ca waves and whole-cell Ca oscillations. Despite extensive experimental characterization in many systems, the transition from local random to global synchronous events is still poorly understood. Here we show that criticality, a ubiquitous dynamical phenomenon in nature, is responsible for the transition from local to global Ca signaling. We demonstrate this first in a computational model of Ca signaling in a cardiac myocyte and then experimentally in mouse ventricular myocytes, complemented by a theoretical agent-based model to delineate the underlying dynamics. We show that the interaction between the Ca release units via Ca-induced Ca release causes self-organization of Ca spark clusters. When the coupling between Ca release units is weak, the cluster-size distribution is exponential. As the interactions become strong, the cluster-size distribution changes to a power-law distribution, which is characteristic of criticality in thermodynamic and complex nonlinear systems, and facilitates the formation and propagation of Ca waves and whole-cell Ca oscillations. Our findings illustrate how criticality is harnessed by a biological cell to regulate Ca signaling via self-organization of random subcellular events into cellular-scale oscillations, and provide a general theoretical framework for the transition from local Ca signaling to global Ca signaling in biological cells.
Introduction
Calcium (Ca) signaling regulates many biological functions (1–4), including fertilization, gene transcription, cell division, cell death, hormone release, muscle contraction, and heart rhythm and contraction. Although the details of the Ca signaling pathways vary among cell types, the general principles of regulation are universal. Ca is stored in intracellular organelles such as the endoplasmic reticulum (ER) or sarcoplasmic reticulum (SR), from which it is released into the cytoplasmic space through opening of Ca-sensitive inositol 1,4,5-trisphosphate receptors (IP3Rs) or ryanodine receptors (RyRs). The open probability of both IP3R and RyR increases as cytoplasmic Ca increases, a process called Ca-induced Ca release (CICR), which is a key positive feedback loop underlying the rich Ca dynamics observed in biological cells (5–13). Ca release from the ER or SR is triggered by Ca entry from the voltage-gated or ligand-gated Ca channels in the cell membrane, or in response to signal transduction, such as G-protein-related signaling pathways. Spontaneous Ca release can also occur under certain conditions, such as Ca overload. A basic unit of Ca signaling is called a Ca release unit (CRU) or couplon. A cell contains hundreds to thousands of CRUs (14), which form a coupled network via Ca diffusion in the cytoplasmic space (and in the SR in cardiac myocytes (15)).
A Ca release event from a single or a few RyRs or IP3Rs in a CRU is called a quark (16), and a discrete Ca release event resulting from the collective openings of many RyRs and IP3Rs due to the positive feedback mediated by CICR is called a spark (17). Ca sparks are considered to be elementary events of Ca signaling, and tend to occur randomly in space and time. A hierarchy of Ca signaling that includes quarks, sparks, spark clusters, and abortive and persistent Ca waves has been observed. It has also been observed in many studies (9–12,18) that the origins of Ca waves vary randomly in time and space. The link between Ca sparks and Ca waves has been documented in many experiments (8–12), but it is not clear why some sparks can initiate waves while the vast majority of sparks do not. It is well known that in an excitable medium, due to the source-sink effect, a group of cells (such as the sinoatrial node in the heart) must be excited synchronously to initiate a wave. By the same reasoning, one would expect that to initiate a Ca wave, a spark cluster of a certain size is needed. However, if a spark cluster forms simply by chance, estimation based on experimental data gives rise to a wave frequency much lower than that observed in experiments (11,12) (see estimation in Supporting Material). Therefore, purely random clustering cannot explain the transition from Ca sparks to Ca waves, and one must establish a mechanistic link between the two to fully understand the mechanisms of Ca signaling in biological cells.
Using computer simulations of an IP3R cluster array model, Falcke (19) first showed that nucleation from Ca sparks to Ca waves is responsible for intracellular Ca oscillations. Later studies by Skupin et al. (7,20) and Thurley et al. (21) showed that the whole-cell Ca oscillations are intrinsically stochastic, which is not an oscillatory behavior of a IP3R cluster but rather an emergent behavior of the IP3R cluster network of the whole cell. Investigators have also carried out computer simulations in cardiac myocyte models (22–26) to study the self-organization of random RyR openings or sparks into Ca waves and triggered activity in cardiac myocytes. However, despite many modeling and experimental studies on the transitions from Ca sparks to Ca waves and whole-cell oscillations, a general theoretical framework for the transition from Ca sparks to Ca waves is still lacking. In this study, we combined computer simulation and experiments to address the question of how local random Ca signaling events self-organize into global Ca signaling events, such as Ca waves and whole-cell oscillations, in cardiac myocytes. Computer simulations of a mathematical model of Ca signaling in cardiac myocytes were performed in combination with theoretical analyses of an agent-based model of excitable elements, and experimentally validated in Ca imaging experiments in permeabilized mouse ventricular myocytes. We show that the interaction between CRUs via CICR causes self-organization of Ca spark clusters. When the coupling between CRUs is weak, the cluster-size distribution is exponential. As the interactions become strong, the cluster-size distribution changes to a power-law, which facilitates the formation of large spark clusters and preferable spatial conditions for Ca wave initiation and propagation. A power-law distribution is an indicator that a system is in a critical state, such as the critical phenomena seen in second-order phase transitions in thermodynamics and statistical physics (27,28), and self-organized criticality (SOC) observed in many complex nonlinear systems in nature (29–31). Here we show that criticality is harnessed by a biological cell to regulate the self-organization of random subcellular events into cellular-scale oscillations.
Materials and Methods
Ca cycling model of ventricular myocytes
We developed a ventricular myocyte Ca cycling model that was improved from a previous model (32) and is similar to other published models for Ca sparks and waves in cardiac myocytes (22,33–35). The model is a three-dimensional (3D) CRU network (Fig. 1 A) with the CRUs coupled via Ca diffusion in the myoplasmic (Myo) space and SR. Ca concentrations in the Myo and SR space are described by differential equations. Each CRU contains four compartments (Fig. 1 B): network SR (NSR), junctional SR (jSR), Myo, and dyadic space (DS). The arrows in Fig. 1 B illustrate the L-type Ca channel (LCC) flux (JLCC), RyR release flux (JRyR), SERCA uptake (Jup), and diffusive flux (Jdiffu). The NSR and Myo compartments in each CRU were discretized into 5 × 5 × 5 voxels, with each voxel volume being 0.2 × 0.2 × 0.2 μm3 (the voxel volume of SR is rescaled by the volume ratio of SR and Myo). We placed 100 RyRs into each CRU and simulated each RyR via random Markov transitions using a model (Fig. 1 C) developed by Stern et al. (36). Each CRU contains 10 LCCs, which were simulated randomly with a Markov model developed for rabbit ventricular myocytes (37). All simulations were carried out by clamping the membrane voltage at −80 mV. The whole-cell model contains 100 × 20 × 10 CRUs (some simulations in this study used 100 × 20 × 5 CRUs for very long simulations, which gives rise to the same results obtained by using a larger number of CRUs).
Figure 1.
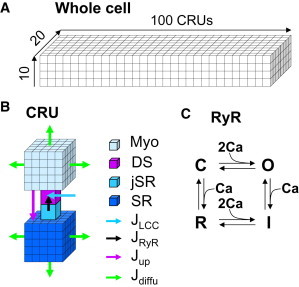
Schematic diagrams of the computer model. (A) A CRU network representing a cardiac myocyte. (B) Detailed structure of a computational CRU. (C) The four-state RyR model.
The governing differential equations for the Ca concentrations in different spaces are as follows:
| (1) |
| (2) |
| (3) |
| (4) |
where cm(x,y,z,t) and cs(x,y,z,t) are the local Ca concentrations in the Myo and the SR spaces, respectively, and and are the Ca concentrations in the ith DS and jSR spaces, respectively. βm, βs, βd, and βj are Ca buffering functions, which are instantaneous functions of the Ca concentration in each space, following Wagner and Keizer (38). Jm, Js, , and are the net Ca flux for each space. Dm and Ds are the Ca diffusion constants in the Myo space and the SR space, respectively, and we set them as Dm = Ds = 0.3 μm2/ms. The detailed mathematical formulations of the buffering constants and the Ca fluxes are based on the model by Rovetti et al. (32) and are described in more detail for the model presented here in our recent publication (39).
Computer simulations were performed on a single NVIDIA Tesla C2050 high-performance Fermi-based graphics processing unit (GPU; http://www.nvidia.com). We wrote the programs in C++ using the CUDA API, and used the GNU C++ compiler version 4.4.3 and NVIDIA CUDA version 4.0. Details regarding the numerical algorithms and implementation of GPU computing can be found in our recent publication (39).
Theoretical model
The CRUs were modeled by a three-state cycle (excitable → excited → refractory → excitable; see Fig. 6 A) modified from a previous model (40). We used 100 × 20 × 10 CRUs. The CRUs were coupled to their six nearest neighbors. The transition from the excitable state to the excited state of a CRU in the network was simulated stochastically with the transition rate to be λ = α + γs2, where s is the number of its six nearest neighboring CRUs in the excited state, α is the rate constant for spontaneous firing, and γ is the coupling strength. The spark duration (or the duration of the excited state) is fixed at 60 ms and the refractory period (the time in the refractory state) is fixed at 300 ms. For the results shown in Fig. 6 E, the variable s in the transition rate equation is the number of its 10 (including the nearest diagonal elements) nearest neighboring CRUs in the excited state.
Figure 6.
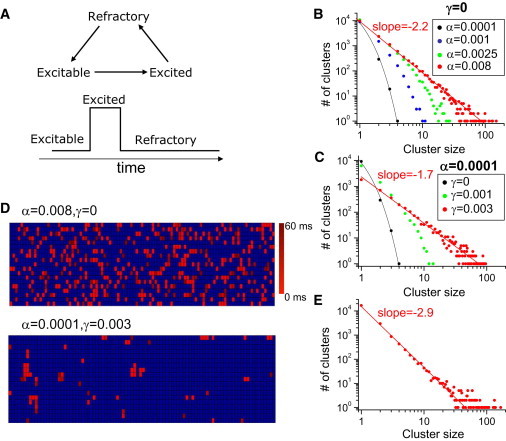
Spark dynamics in an agent-based model. (A) Schematics of the three-state model. (B) Cluster-size distributions for different α when the CRUs are uncoupled. (C) Cluster-size distribution for different γ-values with a small α. (D) Time-lapse images of 2D slices of the state spaces for the uncoupled (top) and coupled (bottom) systems over a time period equal to the spark duration, both at criticality. The color scale gives the initial time of the spark. (E) Cluster-size distribution when the nearest diagonal elements are coupled. The black lines in B and C are purely exponential.
Myocyte preparation
Methods developed by Mitra and Morad (41) to enzymatically isolate cardiac ventricular myocytes were modified for mice. Briefly, C57Bl/6 mice (6–8 weeks old) were injected intraperitoneally with 800 μl heparin (5000 U/ml) 20–30 min before they were anesthetized and then killed with isoflurane (Phoenix Pharmaceuticals). Hearts were quickly excised by thoracotomy and retrogradely perfused on a Langendorff apparatus maintained at 37°C. The enzyme digestion step consisted of perfusing Tyrode's solution containing 1 mg/ml collagenase (Type II, 300 U/mg; Worthington) and 2.8 mg/ml protease (Type XIV, ≥3.5 U/mg; Sigma) for 13–15 min. Myocytes were dissociated from digested ventricles by gentle mechanical dissociation and used within 4–6 h. The modified Tyrode's solution contained (in mM) 136 NaCl, 5.4 KCl, 0.33 NaH2PO4, 1.0 MgCl2, 10 HEPES, and 10 glucose, pH 7.4 (KOH). All chemicals were obtained from Sigma unless indicated otherwise. All procedures complied with the policies of the Animal Research Committee of the University of California, Los Angeles.
Myocyte permeabilization
Myocyte membranes were permeabilized for 30–60 s with saponin (0.005% w/v) in a mock internal solution composed of (in mM) 100 potassium aspartate, 20 KCl, 10 HEPES, 0.25–1 EGTA, and 0.75 MgCl2, pH 7.2 (KOH). Permeabilized myocytes were resuspended in a saponin-free mock internal solution composed of (in mM) 100 potassium aspartate, 20 KCl, 5 KH2PO4, 5 MgATP, 10 phosphocreatine, 5 U/ml creatine phosphokinase, 10 HEPES, 0.25–1 EGTA, 5 × 10⁻⁵–5 × 10⁻⁴ CaCl2 (free), 1 MgCl2 (free), 0.03 Fluo-4 (Invitrogen), and 8% w/v dextran (molecular weight ∼40,000; prevents osmotic swelling (13)), pH 7.2 (KOH). Free Ca concentration and Mg concentration were calculated with the use of WebMaxC Extended (maxchelator.stanford.edu). All experiments were performed at room temperature. Procedures were slightly modified from a previous study (42).
Ca imaging
We imaged spontaneous Ca activity in permeabilized myocytes using a Zeiss PASCAL 5 laser scanning confocal system (Carl Zeiss) on a Zeiss Axiovert 100 LSM inverted microscope fitted with a 63X objective (Zeiss C-Apochromat 63/1.2 W Corr). The Ca indicator dye Fluo-4 was excited at 488 nm wavelength with an argon/krypton laser with intensity attenuated to 1–3%. Emission wavelengths > 510 nm were detected by the photomultiplier. Fluorescence intensity space-time recordings were acquired in the line scan mode (1.92 ms/line, 2604 lines/recording) along the longitudinal axis of the myocyte and digitized into 1024 × 2604-pixel images (12-bit) line scan with nominal pixel dimensions of 0.08–0.13 μm.
Spark detection and analysis
The SparkMaster (43) plugin for ImageJ software (44) was used to detect and analyze Ca sparks. The analysis parameters were as follows (see Picht et al. (43) for definitions): scanning speed, 520.8 lines/s; pixel size, 0.08–0.13 μm; spark threshold criteria, 3.8 (3.2 for high EGTA); background, 550–1330; and analysis intervals, 5. Due to Sparkmaster's limitations in detecting sparks within high-noise backgrounds, we implemented a custom absolute-threshold algorithm in recordings with Ca waves, as suggested previously (45). We measured Ca spark cluster sizes (spatial widths in line scan) using a custom algorithm that defines a Ca spark cluster as Ca sparks separated by less than the single spark average full width in space and the single spark average full duration in time. Cluster detection in computer simulations was similar. The onset of a spark was defined as the time at which the dyadic space Ca increased to 400% of baseline, and the termination of a spark was defined as the time at which the dyadic space Ca fell back to within 25% of baseline. A spark cluster was defined as any sparks that are nearest neighbors in space and separated in time by an interval less than or equal to the average single spark duration.
Results
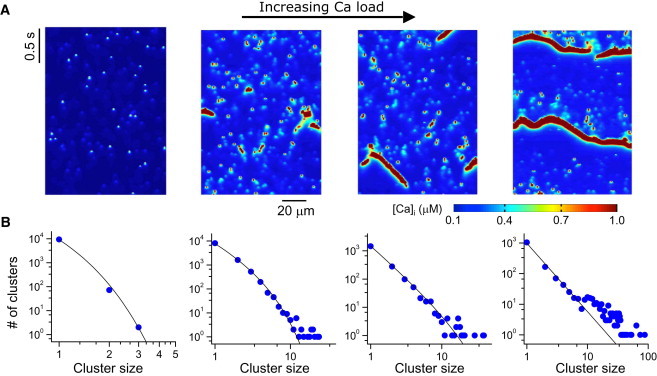
We first performed computer simulations using the spatially distributed Ca cycling model at different Ca loads. Fig. 2 A shows snapshots of free cytoplasmic Ca concentration at four different Ca loads achieved by increasing the extracellular free Ca concentration in the myocyte model (see Movie S1, Movie S2, Movie S3, and Movie S4 for spatiotemporal dynamics). At low Ca loads, the cell predominantly exhibits single Ca sparks. As the Ca load increases, more and more sparks occur in clusters. At high Ca loads, the self-organized large clusters propagate as abortive or persistent waves. The average cytoplasmic Ca of the whole cell (Fig. 2 B) transitions from almost no fluctuations to small fluctuations, then to random bursts, and finally to more periodic oscillations. To characterize the spatiotemporal evolution of this sequence, we calculated the spark cluster-size distribution in each case (Fig. 2 C). When Ca load is low, the distribution is exponential. As Ca load increases, the cluster-size distribution changes from exponential to power-law, which is maintained as Ca increases further. A power-law distribution indicates that a thermodynamic system is in a critical state, undergoing a second-order phase transition (27,28), and has been used as an indicator of SOC in complex nonlinear systems (29–31).
Figure 2.
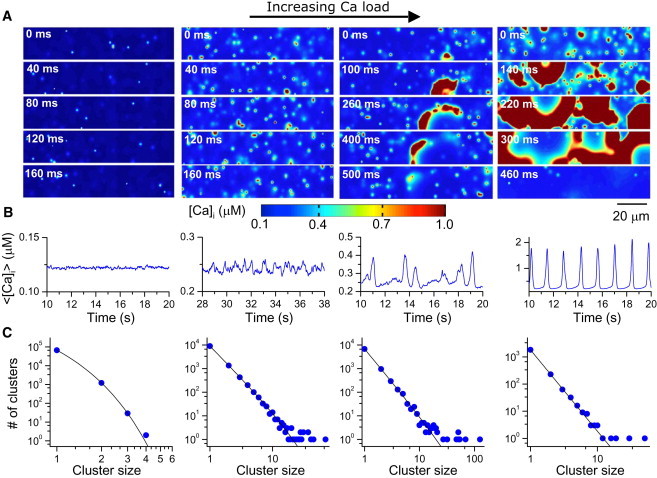
Ca signaling hierarchy and cluster-size distribution in a model of ventricular myocytes. (A) Snapshots of Ca concentration in the cytoplasmic space for different Ca loads achieved by altering extracellular [Ca]o. From left to right, [Ca]o = 3 mM, 9 mM, 10 mM, and 16 mM. (B) Averaged whole-cell Ca concentration for the corresponding loading condition. (C) Number of clusters versus spark cluster size. Symbols are data from simulations and lines are reference lines. The line in the leftmost panel is a pure exponential.
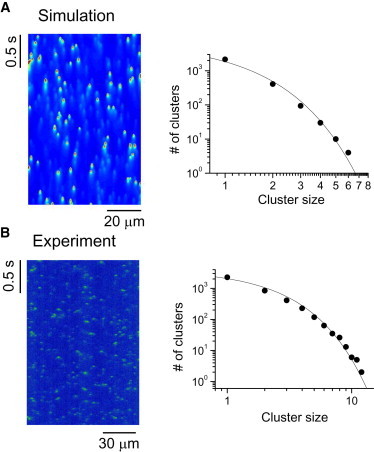
To evaluate whether a similar transition is observed experimentally, we recorded cytoplasmic Ca signaling events in permeabilized mouse ventricular myocytes superfused with the fluorescent Ca indicator Fluo-4 and imaged with confocal microscopy (see Materials and Methods). Fig. 3 A shows line scans (space-time plots) of the cytoplasmic free Ca as the free Ca in the bathing solution was increased, demonstrating the same hierarchical Ca dynamics transitioning from sparks to waves observed in the simulations. Fig. 3 B shows spatially averaged Ca fluorescence versus time for the corresponding Ca loads, showing the transition from small fluctuations to large fluctuations and more periodic oscillations. The cluster-size distribution obtained using the line scan data changes from exponential to power-law (Fig. 3 C), agreeing with the computer simulation results shown in Fig. 2. For a more direct comparison, we plotted line scans (Fig. 4 A) from the simulations shown in Fig. 2 and used them to recalculate the cluster-size distributions (Fig. 4 B), which produced closer agreement with the experimental data. Note that the cluster-size distributions of the line scans exhibit a stronger exponential component compared with the 3D data (compare Fig. 4 B with Fig. 2 C), suggesting that the cluster distributions in the experimental data would exhibit an even stronger power-law component if one could obtain accurate 3D recordings in a real cell.
Figure 3.
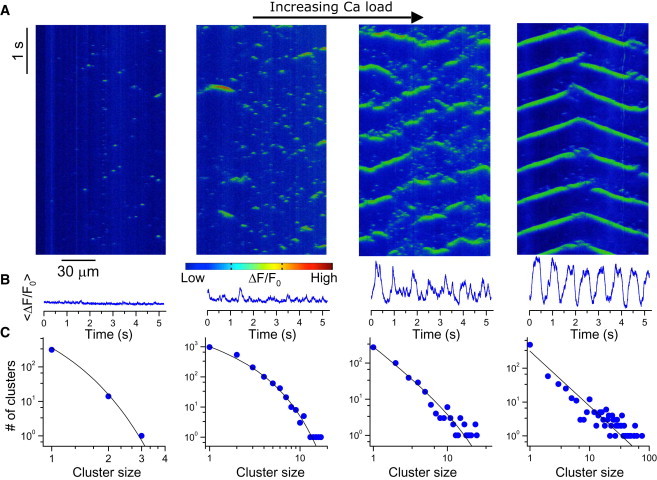
Ca signaling hierarchy and cluster-size distribution in permeabilized mouse ventricular myocytes. (A) Space-time plot of Fluo-4 intensity for bathing free Ca concentrations of 100 nM, 300 nM, 400 nM, and 500 nM from left to right. (B) Averaged whole-cell Ca concentration for the corresponding Ca loads. (C) Cluster-size distributions for the corresponding Ca loads. Symbols are data from experiments and lines are reference lines. The line in the leftmost panel in C is a pure exponential.
Figure 4.
Cluster-size distribution obtained using line scans from the computer simulations. (A) Space-time plots of Ca concentration along a line through the ventricular myocyte model (see corresponding simulations in Fig. 2). (B) Cluster-size distributions obtained using the line scan data from the corresponding simulations. Symbols are data from simulations and lines are reference lines. The line in the leftmost panel in B is a pure exponential.
Buffering cytoplasmic Ca more tightly by increasing the EGTA concentration (while maintaining the same free Ca concentration) is predicted to weaken the CRU interaction, and has been shown experimentally to suppress Ca waves without altering spark frequency (10,13). Increasing the Ca buffering in the computer model also suppressed Ca waves and changed the power-law distribution to an exponential distribution (Fig. 5 A). These data indicate that coupling between CRUs plays an important role in criticality. This prediction was validated experimentally, as shown in Fig. 5 B. At 400 nM Ca concentration and 0.5 mM EGTA, abortive and persistent Ca waves with a power-law cluster distribution were typically observed (Fig. 3 C). When EGTA was increased to 1 mM while the same free Ca concentration was maintained at 400 nM, Ca waves were suppressed and the cluster distribution became exponential (Fig. 5 B).
Figure 5.
High intracellular Ca buffering changes a power-law distribution to an exponential distribution. (A) Space-time plot of Ca concentration in a computer simulation with a fivefold higher concentration of Ca buffer, for [Ca]o = 10 mM and the corresponding cluster-size distribution obtained from the line scan data, showing an exponential distribution (the plotted reference line is a pure exponential function). (B) Space-time plot of ΔF/F0 from a mouse ventricular myocyte using 1 mM EGTA to buffer-free Ca at 400 nM, and the corresponding cluster-size distribution, showing an exponential distribution. The plotted reference line is a purely exponential function.
To characterize this process from a more theoretical perspective, we constructed a simplified model based on our previous work (40) (see Supporting Material) in which the intrinsic spark rate (α) and the coupling strength (γ) between CRUs were formulated as independently adjustable parameters. CRUs were represented by stochastic agents modeled as three-state cycles (Fig. 6 A) and coupled in a 3D array with nearest-neighbor coupling. When the CRUs were uncoupled (γ = 0), we observed exponential distributions of cluster size for small α-values. As α increased to a critical value (α = 0.008), the cluster-size distribution became a power-law (Fig. 6 B), which agrees with traditional percolation theory (Supporting Material) (46,47). However, the value of α estimated from our experimental data and simulations, as well as previous experiments (11) (Supporting Material), is much lower than that required for a power-law distribution in percolation theory. When we used α = 0.0001 and coupled the CRUs with a nonzero γ, however, the cluster-size distribution changed from an exponential distribution to a power-law distribution at large γ-values (Fig. 6 C), indicating the importance of the CRU-CRU interaction in promoting criticality.
For a wave to self-form in an excitable medium, a sufficiently large cluster needs to form to overcome the source-sink effect for propagation (48). This same effect was also demonstrated in experiments for Ca wave propagation (49). If such a large cluster were to form simply by chance, the wave frequency would be significantly lower than was observed in the experiments (see Supporting Material for details) (11,12). According to the results shown in Fig. 6, B and C, the coupling of CRUs plays an important role in forming such large clusters. Of even more importance, coupling enhances the spatial conditions required for a large cluster to propagate as a wave, because the clusters that form via the self-organizing process have much more excitable space for propagation compared with clusters that form randomly due to a high spark probability (Fig. 6 D).
One discrepancy between the agent-based theoretical model and the detailed model is that the power-law exponent is smaller in the detailed model. We reason that in the detailed model, free Ca diffusion in the cytoplasmic space extends CRU coupling beyond the nearest neighbors, whereas the theoretical model exhibits only nearest-neighbor coupling. When we increased the coupling in the theoretical model to include the nearest diagonal neighbors, we observed a larger exponent (Fig. 6 E), which is more consistent with the simulation results shown in Fig. 2 C.
Discussion
A power-law distribution has been considered as a hallmark of criticality (27–31). In physics, criticality occurs in second-order phase transitions of thermodynamic equilibrium systems (27,28), such as the paramagnetic to ferromagnetic transition at the critical (or Curie) temperature. Bak et al. (29) put forward a concept called SOC to explain widely observed power-law distributions in complex nonlinear systems in nature (30,31), in which the system self-organizes into a critical state without the requirement of fine tuning parameters, in contrast to traditional critical phenomena. SOC has been demonstrated in random excitable systems (50,51) and in a cellular automaton model of Ca signaling (52), as well as in many other systems in nature (e.g., avalanches, earthquakes, forest fires, evolution, ecosystems, and neuronal activity) (30,31,53–57) through the observation of power-law distribution of spatial clustering and frequency of temporal fluctuations. In the intracellular Ca signaling systems shown in this study, we observed a power-law distribution before and after Ca waves, occurring over a wide parameter range. On the basis of previous studies of excitable systems (50–52) and our own observations in this study, we believe that SOC is also likely to be the best descriptor of Ca signaling dynamics at the subcellular level, as explained below. In the intracellular Ca signaling system, the Ca load must be raised to a high enough level, such that the individual CRUs are sufficiently excitable and properly coupled, to bring the system to the critical state at which a power-law cluster distribution exists and Ca waves start to occur. When the Ca load is beyond the critical value, Ca waves occur more frequently. As a wave propagates through the system, it empties the SR, and the system is brought out of the critical regime. However, as the SR refills and the RyRs recover, the CRUs regain their excitability and the system self-organizes back into the critical state at which a power-law is achieved. In this scenario, the power-law distribution is observed over a wide range of Ca loadings in our system, in agreement with the SOC scenario. Nevertheless, whether the criticality in intracellular Ca signaling is achieved through parameter tuning, as in the traditional critical phenomena or via SOC, an important general message is that once a system is in a critical state, a tiny perturbation can grow into a macroscopic fluctuation due to the power-law distribution (27,28). This provides a general theoretical framework for how single-channel fluctuations may lead to macroscopic random oscillations in biological systems.
Compared with an exponential cluster-size distribution, a power-law distribution gives rise to a much higher probability for large spark cluster formation. Once a cluster reaches a critical size, it becomes capable of initiating a wave and giving rise to a whole-cell Ca signal, depending on the status of the surrounding CRUs. As shown in our theoretical model, a low spontaneous spark probability with strong coupling not only causes the formation of large clusters but also sets the permissive spatial conditions for wave propagation. After a wave originating from one location propagates through the cell, it resets the system, and self-organization of spark clusters begins anew after the CRUs recover (see Movie S3 and Movie S4). A new large cluster may form in another location and initiate a new wave, which agrees with experimental observations that the origins of Ca waves vary randomly in space and time (10–12,18). Due to the randomness in cluster formation in time and space, the whole-cell Ca signal exhibits an irregular burst-like behavior, in agreement with experimental observations in many cell types that Ca oscillations are irregular (7,18,20). However, as the coupling strength increases, the periodicity of the oscillations increases due to more synchronous firing of the individual elements.
Ca waves in ventricular myocytes are linked to cardiac arrhythmias by causing delayed afterdepolarizations (58,59) and early afterdepolarizations (60), which tend to occur irregularly (18,61). Our finding that Ca waves start to form when the system reaches a critical state indicates that the irregularity of delayed afterdepolarizations is amplified from microscopic random ion channel fluctuations, which may provide a subcellular origin of the unpredictability of cardiac arrhythmias and sudden cardiac death (62). In addition, our finding that a strong coupling between CRUs is needed to bring the system into criticality and facilitate wave propagation (Figs. 5 and 6) indicates that the distribution and spacing between CRUs are important for the genesis of Ca waves. A study by Chen-Izu et al. (63) showed that the spacing between CRUs becomes shorter in failing rat myocytes, which promotes Ca waves as shown in computer simulations by Izu et al. (22). The importance of CRU spacing in Ca wave propagation was also studied by Wussling et al. (64) in agarose gel experiments. In sinoatrial nodal (SAN) cells of the heart, local Ca release plays a vital role in pacemaking (65,66). In addition to many other differences between a ventricular myocytes and a SAN cell, the CRU spacing is shorter in the SAN cell (66) than in the ventricular cells (63). This may play an important role in promoting Ca oscillations, which contribute to the pacemaker activity of the SAN cells. Finally, we speculate that our findings that local Ca releases generate Ca waves via criticality may provide a subcellular mechanism that accounts for the fractal (i.e., power-law) properties of heart-rate variability (67,68).
In addition to Ca cycling in cardiac myocytes, our study may also enable a theoretical understanding of Ca signaling dynamics in many other cell types, such as how irregular macroscopic Ca oscillations (7,18,20) self-emerge through the interactions of random local Ca releases. The same theoretical framework may also be applicable to the Ca signaling dynamics in multicellular tissue, such as the emergent phenomena (69) and the transition from irregular Ca dynamics to synchronous Ca oscillations in smooth muscle (70,71). As is well known in phase transitions and critical phenomena in physics (27,28), when a system is away from criticality, a perturbation decays exponentially, but when it is in a critical state, a small microscopic fluctuation may grow into a large macroscopic fluctuation due to the power-law distribution, which is a key feature of criticality. Generally, if criticality governs the transition from local to global Ca signaling in biological cells, as well as in multicellular tissue, it may underlie the bursting and fractal behaviors observed in many biological systems.
In conclusion, our computer simulation and experimental studies show how randomly occurring Ca sparks self-organize to form Ca waves in biological cells. We show that criticality underlies the spark-to-wave transition in the Ca signaling hierarchy to form a power-law cluster-size distribution, and the theoretical model shows that the coupling between the CRUs is an important parameter. A power-law cluster-size distribution due to strong coupling between CRUs gives rise to much higher probabilities of large spark clusters at low spark rates than would be expected if it were governed by pure chance. In the transition from random sparks to Ca waves, the whole-cell Ca signal changes from small random fluctuations to random bursts, and then to more periodic oscillations. These oscillations arise from the self-organized wave activities and do not require the preexistence of any pacemaking sites in the cell, in agreement with the recent observation that whole-cell Ca oscillations are emergent phenomena of the coupled CRU network (21). Therefore, our study provides a general theoretical and mechanistic framework for the transition from random Ca sparks to Ca waves and whole-cell Ca oscillations, not only in cardiac myocytes but also in other biological cells.
Limitations
This study has several limitations. Due to the limited system size imposed by a real myocyte, the power-law distribution does not extend far beyond one order of magnitude. However, if we repeat the simulations in a larger system, we observe a power-law distribution that persists over a larger range of cluster sizes (see Fig. S1 for a cluster-size distribution from a larger system of the agent-based model). The model is a network of coupled CRUs, which lacks the detailed fine structure in a cardiac myocyte that may play important roles in intracellular Ca signaling. We used the RyR model developed by Stern et al. (36), which exhibits cytosolic Ca-dependent inactivation but does not include SR luminal Ca regulation. In addition, in real cardiac myocytes, RyR cluster distribution is somewhat heterogeneous rather than uniform (72), which may also affect the Ca signaling dynamics. Nevertheless, Ca signaling has been shown in many cell types and conditions to exhibit universal behaviors (2), indicating that the specific details may not be important for understanding the universal properties, which is the main goal of this study.
Acknowledgments
We thank Dr. Enno de Lange for help with the GPU computing.
This work was supported by National Institutes of Health grants P01 2HL078931, R01 HL103622, and T32 GM065823 (C.K.), a postdoctoral fellowship award (M.N.) and a predoctoral fellowship award (C.K.) from the American Heart Association, Western States Affiliate, and the Laubisch and Kawata endowments.
Footnotes
This is an Open Access article distributed under the terms of the Creative Commons-Attribution Noncommercial License (http://creativecommons.org/licenses/by-nc/2.0/), which permits unrestricted noncommercial use, distribution, and reproduction in any medium, provided the original work is properly cited.
Supporting Material
References
- 1.Berridge M.J., Bootman M.D., Lipp P. Calcium—a life and death signal. Nature. 1998;395:645–648. doi: 10.1038/27094. [DOI] [PubMed] [Google Scholar]
- 2.Berridge M.J., Lipp P., Bootman M.D. The versatility and universality of calcium signalling. Nat. Rev. Mol. Cell Biol. 2000;1:11–21. doi: 10.1038/35036035. [DOI] [PubMed] [Google Scholar]
- 3.Bers D.M. Cardiac excitation-contraction coupling. Nature. 2002;415:198–205. doi: 10.1038/415198a. [DOI] [PubMed] [Google Scholar]
- 4.Clapham D.E. Calcium signaling. Cell. 2007;131:1047–1058. doi: 10.1016/j.cell.2007.11.028. [DOI] [PubMed] [Google Scholar]
- 5.Camacho P., Lechleiter J.D. Increased frequency of calcium waves in Xenopus laevis oocytes that express a calcium-ATPase. Science. 1993;260:226–229. doi: 10.1126/science.8385800. [DOI] [PubMed] [Google Scholar]
- 6.Lipp P., Niggli E. Microscopic spiral waves reveal positive feedback in subcellular calcium signaling. Biophys. J. 1993;65:2272–2276. doi: 10.1016/S0006-3495(93)81316-X. [DOI] [PMC free article] [PubMed] [Google Scholar]
- 7.Skupin A., Kettenmann H., Falcke M. How does intracellular Ca2+ oscillate: by chance or by the clock? Biophys. J. 2008;94:2404–2411. doi: 10.1529/biophysj.107.119495. [DOI] [PMC free article] [PubMed] [Google Scholar]
- 8.Bootman M.D., Berridge M.J., Lipp P. Cooking with calcium: the recipes for composing global signals from elementary events. Cell. 1997;91:367–373. doi: 10.1016/s0092-8674(00)80420-1. [DOI] [PubMed] [Google Scholar]
- 9.Marchant J., Callamaras N., Parker I. Initiation of IP3-mediated Ca2+ waves in Xenopus oocytes. EMBO J. 1999;18:5285–5299. doi: 10.1093/emboj/18.19.5285. [DOI] [PMC free article] [PubMed] [Google Scholar]
- 10.Marchant J.S., Parker I. Role of elementary Ca2+ puffs in generating repetitive Ca2+ oscillations. EMBO J. 2001;20:65–76. doi: 10.1093/emboj/20.1.65. [DOI] [PMC free article] [PubMed] [Google Scholar]
- 11.Cheng H., Lederer M.R., Cannell M.B. Calcium sparks and [Ca2+]i waves in cardiac myocytes. Am. J. Physiol. 1996;270:C148–C159. doi: 10.1152/ajpcell.1996.270.1.C148. [DOI] [PubMed] [Google Scholar]
- 12.Wier W.G., ter Keurs H.E., Balke C.W. Ca2+ ‘sparks’ and waves in intact ventricular muscle resolved by confocal imaging. Circ. Res. 1997;81:462–469. doi: 10.1161/01.res.81.4.462. [DOI] [PubMed] [Google Scholar]
- 13.Lukyanenko V., Gyorke S. Ca2+ sparks and Ca2+ waves in saponin-permeabilized rat ventricular myocytes. J. Physiol. 1999;521:575–585. doi: 10.1111/j.1469-7793.1999.00575.x. [DOI] [PMC free article] [PubMed] [Google Scholar]
- 14.Soeller C., Crossman D., Cannell M.B. Analysis of ryanodine receptor clusters in rat and human cardiac myocytes. Proc. Natl. Acad. Sci. USA. 2007;104:14958–14963. doi: 10.1073/pnas.0703016104. [DOI] [PMC free article] [PubMed] [Google Scholar]
- 15.Wu X., Bers D.M. Sarcoplasmic reticulum and nuclear envelope are one highly interconnected Ca2+ store throughout cardiac myocyte. Circ. Res. 2006;99:283–291. doi: 10.1161/01.RES.0000233386.02708.72. [DOI] [PubMed] [Google Scholar]
- 16.Cheng H., Lederer W.J. Calcium sparks. Physiol. Rev. 2008;88:1491–1545. doi: 10.1152/physrev.00030.2007. [DOI] [PubMed] [Google Scholar]
- 17.Cheng H., Lederer W.J., Cannell M.B. Calcium sparks: elementary events underlying excitation-contraction coupling in heart muscle. Science. 1993;262:740–744. doi: 10.1126/science.8235594. [DOI] [PubMed] [Google Scholar]
- 18.Wasserstrom J.A., Shiferaw Y., Aistrup G.L. Variability in timing of spontaneous calcium release in the intact rat heart is determined by the time course of sarcoplasmic reticulum calcium load. Circ. Res. 2010;107:1117–1126. doi: 10.1161/CIRCRESAHA.110.229294. [DOI] [PMC free article] [PubMed] [Google Scholar]
- 19.Falcke M. On the role of stochastic channel behavior in intracellular Ca2+ dynamics. Biophys. J. 2003;84:42–56. doi: 10.1016/S0006-3495(03)74831-0. [DOI] [PMC free article] [PubMed] [Google Scholar]
- 20.Skupin A., Kettenmann H., Falcke M. Calcium signals driven by single channel noise. PLOS Comput. Biol. 2010;6:6. doi: 10.1371/journal.pcbi.1000870. [DOI] [PMC free article] [PubMed] [Google Scholar]
- 21.Thurley K., Smith I.F., Falcke M. Timescales of IP3-evoked Ca2+ spikes emerge from Ca2+ puffs only at the cellular level. Biophys. J. 2011;101:2638–2644. doi: 10.1016/j.bpj.2011.10.030. [DOI] [PMC free article] [PubMed] [Google Scholar]
- 22.Izu L.T., Means S.A., Balke C.W. Interplay of ryanodine receptor distribution and calcium dynamics. Biophys. J. 2006;91:95–112. doi: 10.1529/biophysj.105.077214. [DOI] [PMC free article] [PubMed] [Google Scholar]
- 23.Chen W., Wasserstrom J.A., Shiferaw Y. Role of coupled gating between cardiac ryanodine receptors in the genesis of triggered arrhythmias. Am. J. Physiol. Heart Circ. Physiol. 2009;297:H171–H180. doi: 10.1152/ajpheart.00098.2009. [DOI] [PubMed] [Google Scholar]
- 24.Chen W., Aistrup G., Shiferaw Y. A mathematical model of spontaneous calcium release in cardiac myocytes. Am. J. Physiol. Heart Circ. Physiol. 2011;300:H1794–H1805. doi: 10.1152/ajpheart.01121.2010. [DOI] [PMC free article] [PubMed] [Google Scholar]
- 25.Li P., Holden A.V. Intracellular Ca2+ nonlinear wave behaviours in a three dimensional ventricular cell model. Physica D. 2009;238:992–999. [Google Scholar]
- 26.Thul R., Coombes S., Bootman M.D. Subcellular calcium dynamics in a whole-cell model of an atrial myocyte. Proc. Natl. Acad. Sci. USA. 2012;109:2150–2155. doi: 10.1073/pnas.1115855109. [DOI] [PMC free article] [PubMed] [Google Scholar]
- 27.Stanley H.E. Oxford University Press; London: 1971. Introduction to Phase Transitions and Critical Phenomena. [Google Scholar]
- 28.Stanley H.E. Scaling, universality, and renormalization: Three pillars of modern critical phenomena. Rev. Mod. Phys. 1999;71:S358–S366. [Google Scholar]
- 29.Bak P., Tang C., Wiesenfeld K. Self-organized criticality. Phys. Rev. A. 1988;38:364–374. doi: 10.1103/physreva.38.364. [DOI] [PubMed] [Google Scholar]
- 30.Bak P. Oxford University Press; New York: 1997. How Nature Works: The Science of Self-Organized Criticality. [Google Scholar]
- 31.Turcotte D.L., Rundle J.B. Self-organized complexity in the physical, biological, and social sciences. Proc. Natl. Acad. Sci. USA. 2002;99(Suppl 1):2463–2465. doi: 10.1073/pnas.012579399. [DOI] [PMC free article] [PubMed] [Google Scholar]
- 32.Rovetti R., Cui X., Qu Z. Spark-induced sparks as a mechanism of intracellular calcium alternans in cardiac myocytes. Circ. Res. 2010;106:1582–1591. doi: 10.1161/CIRCRESAHA.109.213975. [DOI] [PMC free article] [PubMed] [Google Scholar]
- 33.Sobie E.A., Dilly K.W., Jafri M.S. Termination of cardiac Ca(2+) sparks: an investigative mathematical model of calcium-induced calcium release. Biophys. J. 2002;83:59–78. doi: 10.1016/s0006-3495(02)75149-7. [DOI] [PMC free article] [PubMed] [Google Scholar]
- 34.Restrepo J.G., Weiss J.N., Karma A. Calsequestrin-mediated mechanism for cellular calcium transient alternans. Biophys. J. 2008;95:3767–3789. doi: 10.1529/biophysj.108.130419. [DOI] [PMC free article] [PubMed] [Google Scholar]
- 35.Williams G.S., Chikando A.C., Jafri M.S. Dynamics of calcium sparks and calcium leak in the heart. Biophys. J. 2011;101:1287–1296. doi: 10.1016/j.bpj.2011.07.021. [DOI] [PMC free article] [PubMed] [Google Scholar]
- 36.Stern M.D., Song L.S., Ríos E. Local control models of cardiac excitation-contraction coupling. A possible role for allosteric interactions between ryanodine receptors. J. Gen. Physiol. 1999;113:469–489. doi: 10.1085/jgp.113.3.469. [DOI] [PMC free article] [PubMed] [Google Scholar]
- 37.Mahajan A., Shiferaw Y., Weiss J.N. A rabbit ventricular action potential model replicating cardiac dynamics at rapid heart rates. Biophys. J. 2008;94:392–410. doi: 10.1529/biophysj.106.98160. [DOI] [PMC free article] [PubMed] [Google Scholar]
- 38.Wagner J., Keizer J. Effects of rapid buffers on Ca2+ diffusion and Ca2+ oscillations. Biophys. J. 1994;67:447–456. doi: 10.1016/S0006-3495(94)80500-4. [DOI] [PMC free article] [PubMed] [Google Scholar]
- 39.Nivala M., de Lange E., Qu Z. Computational modeling and numerical methods for spatiotemporal calcium cycling in ventricular myocytes. Front. Physiol. 2012;3:114. doi: 10.3389/fphys.2012.00114. [DOI] [PMC free article] [PubMed] [Google Scholar]
- 40.Cui X., Rovetti R.J., Qu Z. Period-doubling bifurcation in an array of coupled stochastically excitable elements subjected to global periodic forcing. Phys. Rev. Lett. 2009;103:044102–044104. doi: 10.1103/PhysRevLett.103.044102. [DOI] [PMC free article] [PubMed] [Google Scholar]
- 41.Mitra R., Morad M. Two types of calcium channels in guinea pig ventricular myocytes. Proc. Natl. Acad. Sci. USA. 1986;83:5340–5344. doi: 10.1073/pnas.83.14.5340. [DOI] [PMC free article] [PubMed] [Google Scholar]
- 42.Zima A.V., Kockskämper J., Blatter L.A. Pyruvate modulates cardiac sarcoplasmic reticulum Ca2+ release in rats via mitochondria-dependent and -independent mechanisms. J. Physiol. 2003;550:765–783. doi: 10.1113/jphysiol.2003.040345. [DOI] [PMC free article] [PubMed] [Google Scholar]
- 43.Picht E., Zima A.V., Bers D.M. SparkMaster: automated calcium spark analysis with ImageJ. Am. J. Physiol. Cell Physiol. 2007;293:C1073–C1081. doi: 10.1152/ajpcell.00586.2006. [DOI] [PubMed] [Google Scholar]
- 44.Collins T.J. ImageJ for microscopy. Biotechniques. 2007;43(1, Suppl):25–30. doi: 10.2144/000112517. [DOI] [PubMed] [Google Scholar]
- 45.Cheng H., Song L.S., Stern M.D. Amplitude distribution of calcium sparks in confocal images: theory and studies with an automatic detection method. Biophys. J. 1999;76:606–617. doi: 10.1016/S0006-3495(99)77229-2. [DOI] [PMC free article] [PubMed] [Google Scholar]
- 46.Lorenz C.D., Ziff R.M. Precise determination of the bond percolation thresholds and finite-size scaling corrections for the sc, fcc, and bcc lattices. Phys. Rev. E. 1998;57:230–236. [Google Scholar]
- 47.Stauffer D., Aharony A. Taylor & Francis; Philadelphia: 1994. Introduction to Percolation Theory. [Google Scholar]
- 48.Xie Y., Sato D., Weiss J.N. So little source, so much sink: requirements for afterdepolarizations to propagate in tissue. Biophys. J. 2010;99:1408–1415. doi: 10.1016/j.bpj.2010.06.042. [DOI] [PMC free article] [PubMed] [Google Scholar]
- 49.Wussling M.H.P., Salz H. Nonlinear propagation of spherical calcium waves in rat cardiac myocytes. Biophys. J. 1996;70:1144–1153. doi: 10.1016/S0006-3495(96)79715-1. [DOI] [PMC free article] [PubMed] [Google Scholar]
- 50.Jung P. Thermal waves, criticality, and self-organization in excitable media. Phys. Rev. Lett. 1997;78:1723–1726. [Google Scholar]
- 51.Jung P., Cornell-Bell A., Moss F. Noise-induced spiral waves in astrocyte syncytia show evidence of self-organized criticality. J. Neurophysiol. 1998;79:1098–1101. doi: 10.1152/jn.1998.79.2.1098. [DOI] [PubMed] [Google Scholar]
- 52.Yang X.-S. Computational modelling of nonlinear calcium waves. Appl. Math. Model. 2006;30:200–208. [Google Scholar]
- 53.Sneppen K., Bak P., Jensen M.H. Evolution as a self-organized critical phenomenon. Proc. Natl. Acad. Sci. USA. 1995;92:5209–5213. doi: 10.1073/pnas.92.11.5209. [DOI] [PMC free article] [PubMed] [Google Scholar]
- 54.Frette V., Christensen K., Meakin P. Avalanche dynamics in a pile of rice. Nature. 1996;379:49–52. [Google Scholar]
- 55.Petermann T., Thiagarajan T.C., Plenz D. Spontaneous cortical activity in awake monkeys composed of neuronal avalanches. Proc. Natl. Acad. Sci. USA. 2009;106:15921–15926. doi: 10.1073/pnas.0904089106. [DOI] [PMC free article] [PubMed] [Google Scholar]
- 56.Fukami T., Zimmermann C.R., Drake J.A. Self-organized criticality in ecology and evolution. Trends Ecol. Evol. (Amst.) 1999;14:321. [PubMed] [Google Scholar]
- 57.Nivala M., Korge P., Qu Z. Linking flickering to waves and whole-cell oscillations in a mitochondrial network model. Biophys. J. 2011;101:2102–2111. doi: 10.1016/j.bpj.2011.09.038. [DOI] [PMC free article] [PubMed] [Google Scholar]
- 58.Ter Keurs H.E.D.J., Boyden P.A. Calcium and arrhythmogenesis. Physiol. Rev. 2007;87:457–506. doi: 10.1152/physrev.00011.2006. [DOI] [PMC free article] [PubMed] [Google Scholar]
- 59.Eisner D.A., Kashimura T., Trafford A.W. From the ryanodine receptor to cardiac arrhythmias. Circ. J. 2009;73:1561–1567. doi: 10.1253/circj.cj-09-0478. [DOI] [PubMed] [Google Scholar]
- 60.Zhao Z., Wen H., Xie L.H. Revisiting the ionic mechanisms of early afterdepolarizations in cardiomyocytes: predominant by Ca waves or Ca currents? Am. J. Physiol. Heart Circ. Physiol. 2012;302:H1636–H1644. doi: 10.1152/ajpheart.00742.2011. [DOI] [PMC free article] [PubMed] [Google Scholar]
- 61.Yeh Y.H., Wakili R., Nattel S. Calcium-handling abnormalities underlying atrial arrhythmogenesis and contractile dysfunction in dogs with congestive heart failure. Circ. Arrhythm. Electrophysiol. 2008;1:93–102. doi: 10.1161/CIRCEP.107.754788. [DOI] [PubMed] [Google Scholar]
- 62.Zipes D.P., Wellens H.J. Sudden cardiac death. Circulation. 1998;98:2334–2351. doi: 10.1161/01.cir.98.21.2334. [DOI] [PubMed] [Google Scholar]
- 63.Chen-Izu Y., Ward C.W., Wehrens X.H. Phosphorylation of RyR2 and shortening of RyR2 cluster spacing in spontaneously hypertensive rat with heart failure. Am. J. Physiol. Heart Circ. Physiol. 2007;293:H2409–H2417. doi: 10.1152/ajpheart.00562.2007. [DOI] [PubMed] [Google Scholar]
- 64.Wussling M.H., Aurich I., Holzhausen H.J. Disposition of calcium release units in agarose gel for an optimal propagation of Ca2+ signals. Biophys. J. 2004;87:4333–4342. doi: 10.1529/biophysj.103.035089. [DOI] [PMC free article] [PubMed] [Google Scholar]
- 65.Lakatta E.G., Maltsev V.A., Vinogradova T.M. Cyclic variation of intracellular calcium: a critical factor for cardiac pacemaker cell dominance. Circ. Res. 2003;92:e45–e50. doi: 10.1161/01.res.0000055920.64384.fb. [DOI] [PubMed] [Google Scholar]
- 66.Maltsev A.V., Maltsev V.A., Stern M.D. Synchronization of stochastic Ca2+ release units creates a rhythmic Ca2+ clock in cardiac pacemaker cells. Biophys. J. 2011;100:271–283. doi: 10.1016/j.bpj.2010.11.081. [DOI] [PMC free article] [PubMed] [Google Scholar]
- 67.Ivanov P.C., Amaral L.A., Stanley H.E. Multifractality in human heartbeat dynamics. Nature. 1999;399:461–465. doi: 10.1038/20924. [DOI] [PubMed] [Google Scholar]
- 68.Ponard J.G., Kondratyev A.A., Kucera J.P. Mechanisms of intrinsic beating variability in cardiac cell cultures and model pacemaker networks. Biophys. J. 2007;92:3734–3752. doi: 10.1529/biophysj.106.091892. [DOI] [PMC free article] [PubMed] [Google Scholar]
- 69.Koenigsberger M., Sauser R., Meister J.J. Emergent properties of electrically coupled smooth muscle cells. Bull. Math. Biol. 2005;67:1253–1272. doi: 10.1016/j.bulm.2005.02.001. [DOI] [PubMed] [Google Scholar]
- 70.Koenigsberger M., Sauser R., Meister J.J. Ca2+ dynamics in a population of smooth muscle cells: modeling the recruitment and synchronization. Biophys. J. 2004;87:92–104. doi: 10.1529/biophysj.103.037853. [DOI] [PMC free article] [PubMed] [Google Scholar]
- 71.Imtiaz M.S., von der Weid P.-Y., van Helden D.F. Synchronization of Ca2+ oscillations: a coupled oscillator-based mechanism in smooth muscle. FEBS J. 2010;277:278–285. doi: 10.1111/j.1742-4658.2009.07437.x. [DOI] [PubMed] [Google Scholar]
- 72.Baddeley D., Jayasinghe I.D., Soeller C. Optical single-channel resolution imaging of the ryanodine receptor distribution in rat cardiac myocytes. Proc. Natl. Acad. Sci. USA. 2009;106:22275–22280. doi: 10.1073/pnas.0908971106. [DOI] [PMC free article] [PubMed] [Google Scholar]
Associated Data
This section collects any data citations, data availability statements, or supplementary materials included in this article.