

Abstract
Dark quenchers are chromophores that primarily relax from the excited state to the ground state nonradiatively (i.e., are dark). As a result, they can serve as acceptors for Förster resonance energy transfer experiments without contributing significantly to background in the donor-emission channel, even at high concentrations. Although the advantages of dark quenchers have been exploited for ensemble bioassays, no systematic single-molecule study of dark quenchers has been performed, and little is known about their photophysical properties. Here, we present the first systematic single-molecule study of dark quenchers in conjunction with fluorophores and demonstrate the use of dark quenchers for monitoring multiple interactions and distances in multichromophore systems. Specifically, using double-stranded DNA standards labeled with two fluorophores and a dark quencher (either QSY7 or QSY21), we show that the proximity of a fluorophore and dark quencher can be monitored using the stoichiometry ratio available from alternating laser excitation spectroscopy experiments, either for single molecules diffusing in solution (using a confocal fluorescence) or immobilized on surfaces (using total-internal-reflection fluorescence). The latter experiments allowed characterization of the dark-quencher photophysical properties at the single-molecule level. We also use dark-quenchers to study the affinity and kinetics of binding of DNA Polymerase I (Klenow fragment) to DNA. The measured properties are in excellent agreement with the results of ensemble assays, validating the use of dark quenchers. Because dark-quencher-labeled biomolecules can be used in total-internal-reflection fluorescence experiments at concentrations of 1 μM or more without introducing a significant background, the use of dark quenchers should permit single-molecule Förster resonance energy transfer measurements for the large number of biomolecules that participate in interactions of moderate-to-low affinity.
Introduction
Over the past two decades, single-molecule fluorescence detection has enabled extensive study of biomolecular interactions and mechanisms through direct observation of static and dynamic heterogeneity and real-time monitoring of full reaction pathways (1–3). A major challenge in single-molecule fluorescence is the ability to observe individual labeled molecules at high fluorophore concentrations; simply put, if the density of labeled molecules per detection volume is too high, seeing isolated molecules is not possible. Typically, the highest workable concentration of labeled molecules is ∼1 nM for confocal microscopy of diffusing molecules and ∼50 nM for total-internal-reflection fluorescence (TIRF) microscopy, limiting the study of moderate-to-low affinity biomolecular interactions when both interacting partners are labeled. To address this problem, one can use techniques that confine the excitation and/or detection volumes (4) (e.g., zero-mode waveguides (5,6)) or increase the local concentration of labeled molecules (e.g., vesicle encapsulation (7,8) or nanofluidics (9,10)). Using zero-mode waveguides or nanofluidics, however, requires nanofabrication and robust surface-passivation methods; on the other hand, vesicle encapsulation complicates buffer exchanges and requires significant amounts of sample material for encapsulated molecule preparation.
Here, we introduce the use of dark quenchers at the single-molecule level as an alternative strategy for operating at high concentration without confinement or encapsulation. Dark quenchers are chromophores that can be excited to higher electronic states upon absorption of photons and relax to the ground state preferentially by nonradiative processes (and hence are dark; fluorescence quantum yields of QSY quenchers in aqueous solution are typically <0.001). Because dark quenchers do not have significant intrinsic fluorescence, they can be used at high concentration. Using dark quenchers as Förster resonance energy transfer (FRET) acceptors provides a predictable way of modulating the fluorescence emission intensity of fluorophores; used alongside fluorophores, they are widely employed in real-time PCR (11) and genotyping as molecular beacons (12), quenched autoligation probes (13), Scorpion probes (14), and Taqman probes (15). These methods rely on the removal of a dark quencher from a fluorescent molecule, thus increasing fluorescence emission in the presence of a specific DNA or RNA sequence.
Although several ensemble assays use dark quenchers as fluorescence on-off switches, few single-molecule studies using dark quenchers are present in the literature (16–18). Schwartz and Quake (17) observed strand displacement by DNA polymerase by using TIRF microscopy and FRET between fluorophore Cy3 and dark quencher BHQ-2, both attached to DNA. Wang et al. (18) used confocal microscopy to detect molecular beacons labeled with Cy5 and dark quencher BHQ-2. Recently, Gaiduk et al. (16) imaged dark quencher BHQ-1 by monitoring the refractive effect of the heat released by BHQ-1 upon intense illumination. No systematic single-molecule characterization of dark quenchers and their photophysics, however, has been reported.
Other fluorescence quenching (or enhancement) mechanisms have also been used at the single-molecule level. For example, fluorescence quenching can be induced by contact with metal ions (19) or other fluorophores (20). Fluorescence enhancement can be induced by the proximity of an interacting protein (21,22).
Here, we report the first systematic single-molecule study of dark quenchers and lay the foundation for their use in single-molecule fluorescence assays. Using DNA fragments labeled with quenchers and fluorophores and observed either in confocal or wide-field spectroscopy formats, we demonstrate that dark quenchers can be used in conjunction with fluorophores to monitor interprobe distances. We also characterize the photophysical properties of two dark quenchers and show that single-molecule studies can easily be performed even in the presence of 1-μM dark-quencher-labeled molecules. Finally, we use dark quenchers to monitor the binding of DNA polymerase to DNA in real-time and to extract kinetic and equilibrium information from the resulting time-traces. Our work paves the way for the widespread use of dark quenchers in single-molecule fluorescence assays.
Materials and Methods
Preparation of DNA fragments and proteins
DNA standard (Fig. 1) preparation proceeded as follows: the top strand was labeled with Cy3 at the 5′-end via a three-carbon linker and an amino-modified thymine at position 40 (dT-C6-NH2; IBA Life Sciences, Göttingen, Germany); the amino group was labeled with ATTO647N (NHS-ester; ATTO-TEC, Siegen, Germany). Each of the six bottom strands has one thymine modified with an amino group at one of positions 8, 13, 18, 23, 28, and 33 (Fig. 1 C) and was labeled with either dark quencher QSY7 or QSY21 (Invitrogen, Carlsbad, CA). Strands were ∼100% labeled after HPLC purification. Each of the 13 resulting bottom strands (six per dark quencher; one unlabeled) were annealed to the top strand using a twofold excess of bottom strand. A Cy3-only top strand was annealed to the unlabeled bottom strand using a twofold excess of bottom strand to form green-only DNA control. Hereafter, Cy3, ATTO647N, and the dark quencher (either QSY7 or QSY21) will be referred to as probes G, R, and Q (or quencher), respectively. For the DNA polymerase experiments, we use hairpin DNA labeled with a Cy3B-NHS ester at an amino-modified thymine at position −11 (for labeling convention, see Fig. 5 C), and we labeled a single-surface-cysteine derivative of the Klenow fragment (KF) of DNA polymerase I (23,24) with dark quencher QSY7 (see Fig. S5, A and B, in the Supporting Material). The labeling efficiency was ∼90%.
Figure 1.
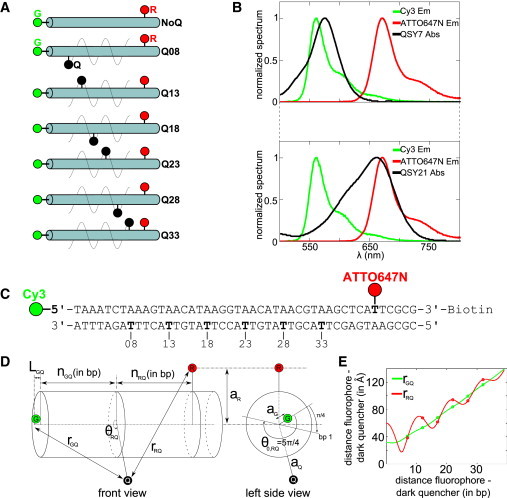
Quencher-labeled DNA standards and related control DNA constructs. (A) Schematic of the DNA standards showing the position of probes G, R, and Q. The DNA construct with probe G and R only is referred to as NoQ DNA. All the other DNA constructs labeled with three probes (G, R, and Q) are referred to as QXQSY7 and QXQSY21 for DNAs labeled with QSY7 and QSY21, respectively, where X is the number of basepairs separating probe G from probe Q. (B) Fluorescence emission spectra of the two fluorophores and absorption spectra of the two dark quenchers (QSY7 absorption, top graph; and QSY21 absorption, bottom graph). (C) DNA standard sequence. The numbering of the basepairs starts from the 5′-end of the top strand (position 1); probe G is at position 1, probe R is at position 40, and the quencher is at one of the following positions: 8, 13, 18, 23, 28, 33 (all in bold). (D) Diagram of the cylindrical model of DNA used to fit the S values. (E) Plot of G-Q distances (rQR) and R-Q distances (rRQ) against the number of basepairs separating the fluorophore-dark-quencher pairs. G-Q and R-Q distances increase with the number of basepairs separating the fluorophore-dark-quencher pair with more or less modulations due to the helical geometry of DNA. The modulations for R-Q distances are much greater than for G-Q distances because the distance off the DNA helix long-axis for probe R (aR = 30 Å, obtained from the fitting of ensemble experiment data) is much greater than for probe G (aG = 2 Å, from Norman et al. (28)).
Figure 5.
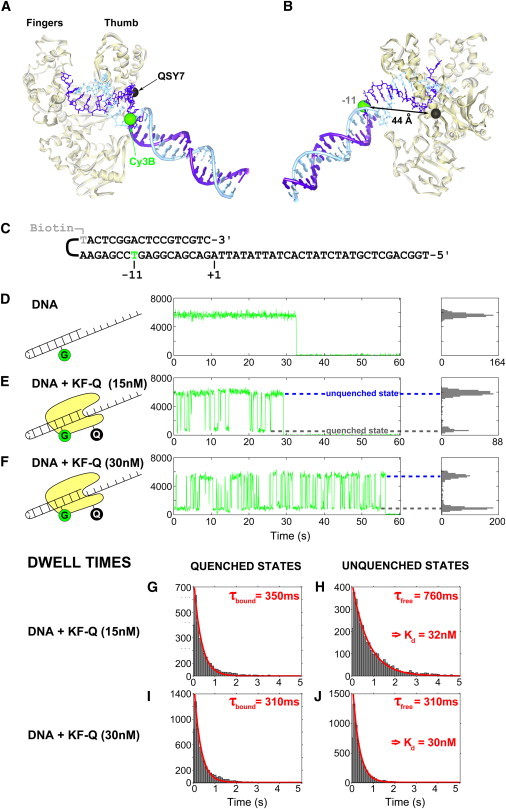
Monitoring the real-time interaction of quencher-modified molecules with surface-immobilized fluorescent molecules: a complex of DNA polymerase with DNA. (A and B) Illustration of the KF-DNA binary complex (PDB: 1L3U) using structural data from Bacillus stearothermophilus DNA polymerase, a KF homolog (32). (A) View of the DNA binding pocket between the fingers (top left) and thumb (top right). The DNA helix of the original crystal structure was extended manually and is shown in tubes and schematic bases. (B) View of the labeled positions on KF and DNA. The 44 Å distance corresponds to KF binding to the DNA hairpin at position +1 (see numbering of basepairs in panel C). The distances were measured from the Cβ atom of the lysine residue and the phosphate atom of each DNA base. (C) Sequence of the DNA hairpin oligonucleotide used in this study. In the folded hairpin, the top strand in panel C is referred to as the primer strand and the bottom strand as the template strand. Numbering of the bases is based on the 3′-end of the primer strand. The hairpin is biotinylated at the hairpin loop (position −18, primer strand) and labeled with Cy3B (position −11, template strand), which acts as a donor in the Cy3B-QSY7 FRET pair. (D–F) Typical fluorescence time-traces of Cy3B attached to DNA () for DNA-only samples (D), samples with 15 nM KFQ in solution (E), and samples with 30 nM KFQ in solution (F). Histograms of the intensity values are projected on the right-hand side. Data bins after photobleaching are not projected. The quenched states (lower dotted line) correspond to binary complexes of KFQ and DNA (∼90% quenching). The unquenched states (upper dotted line) correspond to free DNA. (G–J) Dwell-time distributions of the quenched (G and I) and the unquenched (H and J) states for samples with KFQ. The distributions were fitted with a monoexponential function F (F (t) = A exp(− t/τ)) with A and τ as the fitted parameters. Kd values were calculated from the fitted parameters τbound and τfree and the concentration of KFQ in solution according to Eq. S2 in the Supporting Material.
Ensemble FRET experiments on diffusing DNA molecules
Ensemble fluorescence was measured on a QuantaMaster 4/2006 fluorimeter (Photon Technology International, Birmingham, NJ) using 100 nM DNA in T50BSA buffer (10 mM Tris-HCl, pH8.0, 50 mM NaCl, 100 mg/L bovine serum albumin (BSA)). Cy3 and ATTO647N emission spectra were recorded upon excitation at 515 and 580 nm, respectively. Maximum emission intensities for Cy3 (, at λ = 560 nm) and ATTO647N (, at λ = 657 nm) were proportional to the photon counts from single fluorophores (G-emission upon G-excitation (25)) and (R-emission upon R-excitation (25)),
where Nexc is the number of molecules excited (identical for both green and red fluorophores). For all DNA standards, no FRET occurs between G and R, thus the photon counts due to FRET between G and R (FFRET) (25) are negligible. FRET does occur, however, between G and Q (EG→Q) and between R and Q (ER→Q), with efficiencies depending on fluorophore-quencher distances and their Förster radii,
| (1) |
| (2) |
where rXQ is the distance between fluorophore X (G or R) and quencher Q (QSY7 or QSY21), and R0,XQ is the Förster radius between fluorophore X (G or R) and quencher Q (either R0,XQXY 7 or R0,XQXY 21; see Table S1 in the Supporting Material). The stoichiometry ratio Sens for ensemble experiments is
Given that FFRET = 0 (25) and that the maximum emission intensities are proportional to the number of excited molecules in the cuvette, the ensemble stoichiometry parameter Sens resembles its single-molecule counterpart S (25):
| (3) |
Single-molecule experiments on diffusing DNA molecules
Single-molecule experiments on diffusing DNAs were performed using 50 pM DNA in T50BSA buffer on a confocal alternating laser excitation (ALEX) microscope (25).The laser powers were 300 μW and 60 μW for the 532- and 638-nm excitation, respectively. ALEX experiments produce four photon streams (25),
where is the photon count detected in Y-emission wavelength upon excitation with the X-excitation laser. Photon arrival times were recorded and processed using custom software in LabVIEW (National Instruments, Austin, TX) and MATLAB (The MathWorks, Natick, MA). Fluorescence bursts due to diffusing molecules were detected using algorithms that searched for L photons, each having M neighboring photons within a time interval of T μs. Burst search was carried out on streams , , and using thresholds of L = 12, M = 7, and T = 500 μs; these low thresholds minimize loss of bursts due to quenched fluorophores and detect bursts with extreme S values. Given that FFRET = 0 (Lee et al. (25)), the photon counts are expressed as
where and are G- and R-excitation laser intensities; and , absorption cross sections of G upon G-excitation and R upon R-excitation; ΦR and ΦR, quantum yields of G and R; and , detection efficiencies of G-emission in the G-emission channel and of R-emission in the R-detection channel; Lk is the photon count due to leakage of G-emission in the R-emission channel; and Dir is the photon count in R-emission upon G-excitation due to direct excitation of R upon G-excitation.
The raw stoichiometry ratio Sraw for single molecule experiments is
| (4) |
The apparent FRET efficiency E∗ is
| (5) |
Each fluorescent bursts detected was then plotted in E∗-Sraw histograms (25).
Single-molecule experiments on immobilized DNA molecules
Surface-immobilized DNA molecules were observed using ALEX-TIRF microscopy as described previously (26). The imaging buffer was KEG (50 mM Tris-HCl, pH 8.0, 100 mM potassium glutamate, 10 mM MgCl2, 100 mg/L BSA, 5% (v/v) glycerol, ∼2 mM Trolox; Hoffman-LaRoche, Basel, Switzerland) plus oxygen scavengers (glucose oxidase, 0.004 g/L (2170 U/mL) catalase and 0.8% (w/v) D-glucose). The laser powers were 4 mW (112 W/cm2) and 1 mW (28 W/cm2) for the 532- and 638-nm lasers, respectively, with exposure time of 50 ms. The photobleaching of QSY7 and QSY21 was measured by detecting switching of probe G from a quenched to an unquenched state (with the quenched state being <60% as bright as the unquenched state). The distribution of photobleaching lifetimes of QSY7 and QSY21 for Q08 DNAs (Fig. 1, A and C) was fitted to a single-exponential decay (see Fig. 4, E and F).
Figure 4.
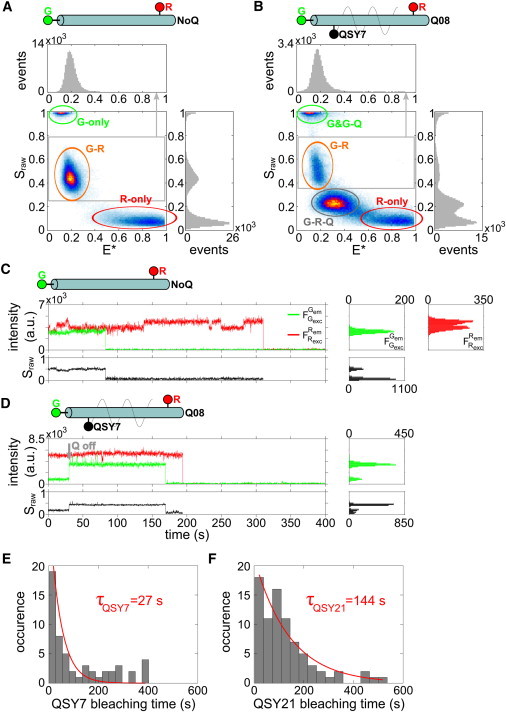
Single-molecule experiment results on immobilized DNA standards. (A and B) E∗-Sraw histograms of DNAs NoQ (A) and Q08QSY7 (B) from TIRF experiments. (C and D) Fluorescence time-traces ( and ) of DNAs NoQ (C) and Q08QSY7 (D). Time-traces of Sraw do not include data bins where both fluorophores are photobleached. The histogram of and Sraw are projected on the right side ( histogram is not shown). histograms do not include data bins after photobleaching. Bleaching of probe Q (Qoff, shaded arrow) is detected when probe G intensity switches from a low state to a high state, the mean intensity value of the low state being 75–85% lower than the high state that corresponds to ER→QSY7. When probe Q bleaches or blinks, Sraw switches from a low state (∼0.25) to a high state (∼0.5). (E and F) Histograms and fits of the bleaching lifetime distribution of the dark quenchers for DNAs Q08QSY7 (E) and Q08QSY21 (F). The histograms were fitted with a single-exponential decay function F (F (t) = A exp(− t/τQ)) with A and τQ the fitted parameters. The bleaching lifetimes for QSY7 and QSY21 are τQSY7 = 27 s and τQSY21 = 144 s, respectively.
To study KF binding to DNA, we incubated immobilized DNA for 1 min in imaging buffer (KEG) containing different concentrations of either labeled or unlabeled KF and then observed the sample using 3 mW 532-nm excitation light (84 W/cm2).
Cylindrical model of dsDNA
To compare our results to expectations from DNA structure, we used a cylindrical model of dsDNA (27) (Fig. 1 D), where the distances rXQ (Fig. 1 E) between fluorophore X (either probe G or R) and quencher Q are expressed as
| (6) |
where nXQ, number of basepairs between X and Q (note that nXQ = 39 − nGQ); LXQ, offset of the projection of X on the DNA helical axis from the point of attachment; aX, distance of X off the helical axis; and θXQ is the cylindrical angle between X and Q. In all standards, Cy3 is attached to a thymine via a three-carbon linker at the 5′-terminus, allowing use of LGQ = 5 Å and aG = 2 Å (from NMR studies (28)). Because probes Q and R are internally attached using the same linker and neighboring bases, we fixed LGQ = 0 and postulated that aR = aQ (hereafter, parameters aR and aQ will be referred to as aint). The polar angle θXQ is expressed as
| (7) |
where θ0,XQ is the angle between X and Q when both probes are on the same basepair; θ0,RQ = π rad was inferred from B-DNA as the C-H bond from carbon C6 is pointing away from the DNA long axis in the same alignment as the basepairing and probes R and Q are attached to opposite strands. Parameter θ0,GQ was obtained from NMR (28), which showed a π/4 rad helical twist from the 5′ DNA base (cytosine) N1 to Cy3 N9′. As Cy3 rotates by +π/4 rad (anticlockwise in Fig. 1 D) relative to the last basepair, we deduced that θ0,GQ = 5π/4 rad (Fig. 1 D, left side). The uncertainty on θ0,GQ value is not crucial for the fit because aG (2 Å) is small and does not modulate rGQ significantly (Fig. 1 E). The experimental data fits were calibrated using the S value of NoQ DNA (SNoQ) as a reference with fitting function Sfit:
| (8) |
To obtain an expression of Sfit as a function of aint, FRET efficiencies EGQ and ERQ were replaced by their expressions as a function of rGQ and rRQ, respectively (Eqs. 1 and 2), which, in turn, were replaced by their expressions as a function of aQ and aR (with aR = aQ = aint). The experimental data were fitted with aint as the only free parameter (Fig. 2).
Figure 2.
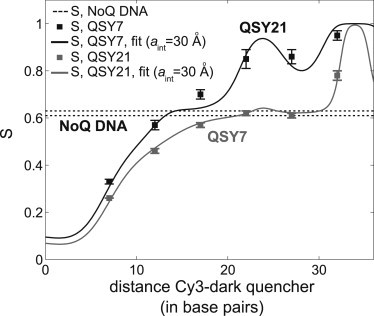
Ensemble experiments on quencher-labeled DNA standards. S values calculated from the ensemble fluorescence intensities of all DNA standards labeled with QSY7 (gray squares) and QSY21 (black squares). The S value obtained for NoQ DNA (SNoQ = 0.62) is represented with the two dotted lines (top line, top of the error bar; bottom line, bottom of the error bar). Error bars represent standard deviations from duplicate experiments. The fitting curves (gray line for QSY7 series and black line for QSY21 series) are obtained using Eq. 8 with parameters aR = aQ = aint = 30 Å.
Results and Discussion
Stoichiometry ratio reports on the proximity of dark quencher and fluorophores
To characterize dark quenchers as FRET acceptors, we chose to study the interactions of a dark quencher (Q) with two spectrally distinct fluorophores on a single DNA duplex. This three-probe system allowed us to rely on ratiometric measurements rather than absolute fluorescence intensity values from the FRET donors, and to sort out, in some cases, Q-dependent photophysics from Q-independent photophysics. We carried out experiments at the ensemble level using DNA standards (Fig. 1) and demonstrated that stoichiometry ratio S can report on the position of the dark quencher relative to the two fluorophores. The DNA standards featured various fluorophore-quencher separations while maintaining the same local environment for all probes (29) (Fig. 1, A and C). The two fluorophores (Cy3 as the green probe, and ATTO647N as the red probe) were placed beyond their FRET range (39-bp separation, equivalent to 12.3 nm in B-DNA, expected E of ∼0.3%).
We used the stoichiometry ratio S (see Eq. 1) to monitor the relative quenching of fluorophores. High S indicates that the green probe (hereafter “G”) is brighter than the red probe (hereafter “R”), whereas low S indicates the opposite. As a result, S is sensitive to the position of the quencher relative to the fluorophores, as well as to the quencher absorption spectra (Fig. 1 B). In contrast, S is independent of the DNA concentration and any difference in S is independent of the local environment of the fluorophores because the fluorophores and their local environments are the same across all DNA constructs. The two dark quenchers (QSY7 and QSY21; Invitrogen, Carlsbad, CA) were chosen mainly for their narrow absorption spectra (Fig. 1 B) and their clear difference in Förster radius with the red probe (see Table S1).
The results for the QSY7 DNA series (gray squares, Fig. 2) show an S increase as the G-Q distance increases, indicative of a decrease in G-quenching by the quencher (relative to R-quenching). As expected, the lowest S value (S = 0.26) for the QSY7 DNA series corresponds to the shortest G-Q distance (7 bp). The S values for G-Q separations of 22 bp (S = 0.62) and 27 bp (S = 0.61) are similar to that of NoQ DNA (S = 0.62; dotted lines in Fig. 2), indicating that, in those two samples, probes G and R are quenched to the same degree. The highest S value (S = 0.78) for QSY7 DNA series corresponds to the longest G-Q distance (32 bp), as probes G and Q are out of FRET range and R-quenching is greatest.
Similar results were obtained for QSY21 (black squares, Fig. 2). The biggest difference in S between the QSY7 and QSY21 DNA series are seen for G-Q distances longer than 20 bp (where G-quenching is negligible) mainly due to the large difference between the Förster radii of the R-QSY7 (R0,RQSY 7 = 38 Å) and R-QSY21 FRET pairs (R0,RQS 21 = 75 Å). In contrast, S differences between the QSY7 and QSY21 series are small for G-Q distances shorter than 20 bp (where R-quenching is negligible) due to the similarity of the Förster radii for the G-QSY7 (R0,GQSY 7 = 53 Å) and G-QSY21 FRET pairs (R0,GQSY 21 = 50 Å).
To compare our S results to expectations based on DNA structure, we fitted them using Eq. 8 (Fig. 2). The best fit for the QSY7 DNA series corresponded to a distance for probes R and Q from the DNA helical axis (see Materials and Methods and Fig. 1 D) of aint = 30 ± 2 Å (with error reflecting 95% confidence intervals). This value can be explained by the distance of the point of attachment (C6 atom) of probes Q and R to the helical axis (∼10 Å), the linker length (∼13 Å), and the distance between the linker and the probe dipole center (∼10 Å) (see Fig. S1 in the Supporting Material). The good fits validate the use of S to monitor distances in a three-probe system. Fits for the QSY21 DNA series (Fig. 2) obtained similar results, aint = 30 ± 4 Å, showing consistency between the DNA series.
Single-molecule characterization of dark quenchers in a three-chromophore system
To characterize the dark-quencher behavior at the single-molecule level, and validate the concept of using stoichiometry ratio S for reporting on the proximity of fluorophore and dark quencher at the single-molecule level, we first used confocal ALEX spectroscopy on diffusing DNA standards (Fig. 3). For NoQ DNA, the E∗-Sraw histogram (25) shows a major population of G-R DNAs (G-R oval in Fig. 3 A; ∼90% of all molecules) at an Sraw value (see Eq. 4) of 0.49 with an apparent FRET efficiency (E∗) of 0.36; the nonzero E∗ is due to G-leakage (Lk) and R-direct excitation (Dir) factors (the standard E is <1%).
Figure 3.
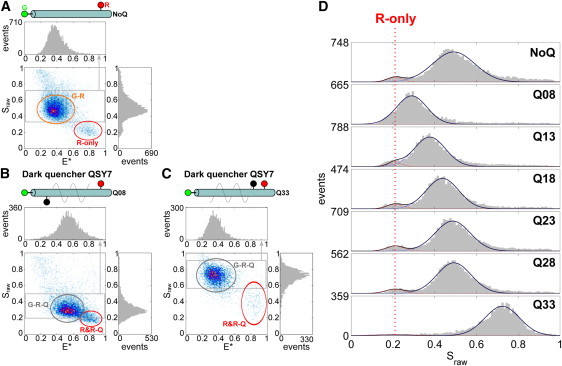
Single-molecule experiments on diffusing quencher-labeled DNA standards. E∗-Sraw histograms of DNAs NoQ (A), Q08QSY7 (B) and Q33QSY7 (C). Sraw distributions are projected on the right side; E∗ distributions of areas in shaded boxes are projected on top. (D) Sraw histograms of NoQ DNA (top graph) and the QSY7 DNA series. All histograms were fitted with two Gaussians, one Gaussian corresponding to R-only species with a center fixed at 0.21.
On the other hand, and as expected from the ensemble data, the E∗-Sraw histogram of Q08QSY7 (Fig. 3 B) shows a much lower S for the G-R-Q species (S = 0.29), which shifts closer to the R-only and R-Q populations. The G-R-Q species also shows higher apparent FRET efficiency E∗ due to changes in cross-talk photon counts (decreased photon count and corresponding donor-leakage Lk relative to NoQ DNA, but unchanged direct acceptor excitation Dir). As with the ensemble data, the Sraw value of G-R-Q species increases up to ∼0.75 with an increasing G-Q distance (Fig. 3, C and D), whereas their E∗ decreases (see above). A similar profile is seen for the QSY21 series (see Fig. S3), with the additional observation of a minor species (Sraw = 0.49 and E∗ = 0.36) in the histograms of Q28QSY21 and Q33QSY21 (see Fig. S3, F and G); this species corresponds to G-R species and is likely to represent G-R DNAs with photobleached QSY21.
The mean Sraw values (see Fig. S4 A) extracted from Gaussian fitting of Sraw distributions (Fig. 3 D) are consistent with the ensemble results because Sraw values increase with G-Q distance for both QSY7 and QSY21 DNA series, and the biggest difference in Sraw values between the QSY7 and QSY21 DNA series is observed for G-Q distances longer than 20 (see Fig. S4 A). Moreover, S values (see Fig. S4 B) calculated from the mean Sraw values (25) were also fitted using the cylindrical DNA model. The values obtained for fitted parameter aint (aint = 19 ± 6 Å for QSY7 and aint = 22 ± 8 Å for QSY21 series) have significant errors (from 95% confidence intervals) and are lower than the corresponding values for ensemble experiments (30 Å), mainly due to the lower SNoQ value (0.30 for single-molecule experiments compared to 0.62 for ensemble experiments, due to the difference in excitation ratio and detection efficiency ratio between the two experimental setups), giving rise to steep changes in the S dependency on the position of probe Q for positions of probe Q close to probe R (positions 23, 28, and 33). The fit with aint = 30 Å is better for positions of probe Q close to probe G (positions 8, 13, and 18).
Characterization of dark-quencher photophysics
To characterize photobleaching and blinking properties of dark quenchers at the single-molecule level, we performed ALEX-TIRF microscopy on immobilized dark-quencher-labeled DNA standards. We first generated E∗-Sraw histograms from fluorescence emission time-traces for comparison with single-molecule experiments on diffusing DNA standards. To observe G or R probe blinking or photobleaching, we use different detection thresholds compared to our analysis on diffusing molecules; as a result, the E∗-Sraw histogram for NoQ DNA (Fig. 4 A) contains the main G-R species seen for single diffusing molecules (Fig. 3 A) with an apparent FRET efficiency (E∗) of 0.20 (>E∗ for single diffusing molecules due to different G-leakage (Lk) and R-direct (Dir) excitation factors), as well as G-only and R-only species (due to blinking/photobleaching).
In the case of G-R-Q samples, we observed the same general Sraw trend as for diffusing molecules: Sraw values of the main G-R-Q population increase with increasing G-Q distances (see Fig. S5 and Fig. S6). In addition, the immobilized molecules included a clear species centered around Sraw = 0.5 for DNAs Q08QSY7 (Fig. 4 B) and Q08QSY21 (see Fig. S6 B); this species is attributed to G-R species, i.e., data bins for which both fluorophores are in an emitting state and the dark quencher is either bleached or in a transient nonabsorbing (blinking) state. G-R species also appear for DNAs Q33QSY7 (see Fig. S5 G), Q23QSY21 (see Fig. S6 E), Q28QSY21 (see Fig. S6 F), and Q33QSY21 (see Fig. S6 G), suggesting that dark quenchers bleach (or blink) due to FRET between probe R and Q. In general, the mean S values (see Fig. S7 B, calculated from Sraw values) are in good agreement with the experiments of diffusing molecules (considering differences in the optics used in the two setups).
To study the photophysics of dark quenchers, we first characterized the photophysical behavior of the green and red probes using the NoQ DNA standards. This was necessary, as the red probe (ATTO747N) fluctuates slowly between two or more fluorescence intensity states in ∼70% of the time-traces (Fig. 4 C and see Fig. S8), even in the absence of a dark quencher; the highest and lowest states differ by ∼20% in brightness (4000 and 4500 counts; time-trace in Fig. 4 C). The multiple emission states for ATTO647N have been reported (30) but not thoroughly analyzed. Although minimizing such complications in samples using dark quenchers is best, our analysis can clearly distinguish between photophysical changes in the quenchers and photophysical changes in the fluorophores in the large majority of DNA fragments.
Time-trace analysis (Fig. 4 D and see Fig. S9) demonstrate that the G-R species seen in the G-R-Q sample (Fig. 4 B) arises in large part due to QSY7 losing the ability to act as an efficient FRET acceptor. This loss of ability can be irreversible and attributed to quencher bleaching or can be reversible and attributed to quencher blinking. The reversibility is only assessed by looking at data bins after a blinking event and, therefore, restricted by Cy3 photobleaching.
An example of QSY7 bleaching in Q08QSY7 DNA can be seen in Fig. 4 D. Initially, probe R has a stable fluorescence emission intensity until bleaching at t ∼ 200 s; whereas probe G starts in a quenched state ( ∼ 900 counts), switches to an unquenched state ( ∼ 3600 counts) at t ∼ 30 s due to bleaching of QSY7, and itself photobleaches at t ∼ 170 s. The mean intensity value of the quenched and unquenched state of probe G represents a 75% quenching efficiency. When QSY7 bleaching/blinking occurs, Sraw switches from a low state (Sraw ∼ 0.2) to a high state (Sraw∼0.45). Bleaching of QSY21 can also be observed in time-traces for Q08QSY21 DNA (see Fig. S10).
Because ∼20% of the time-traces for Q08QSY7 and Q08QSY21 showed bleaching of the quencher before probe G bleaches (see Table S2), we were able to build dwell-time histograms for quencher survival (Fig. 4, E and F), and use them to calculate mean photobleaching lifetimes of τQSY7 = 27 s (upper and lower bounds from 95% confidence interval of 42 s and 20 s, respectively) and τQSY21 = 144 s (upper and lower bounds from 95% confidence interval of 361 s and 90 s, respectively) for QSY7 and QSY21, respectively. The monoexponential fit for QSY7 photobleaching lifetimes seems suboptimal for QSY7-bleaching events occurring after 200 s. A possible source for this heterogeneity could be due to the fact that the observation of Q-bleaching/blinking events are restricted by Cy3 bleaching and that Cy3 is more prone to bleaching when Q is in an off-state (blinking) or a bleached state.
Photobleaching lifetimes can be compared to the energy absorbed by each quencher to assess their intrinsic resistance to photobleaching. For DNAs Q08QSY7 and Q08QSY21, the only FRET process that needs to be considered is the G-Q FRET because the distance between probe Q and R is out of FRET range for both QSY7 and QSY21. Therefore, the mean energy per unit time absorbed by probe Q (or power Pabs) through FRET from probe G and through direct excitation of the green and red laser during one green-red excitation cycle is
where (112W/cm2) and (28W/cm2) are the sample irradiances at 532- and 638-nm excitation, respectively, is the cross section of probe Y at X excitation (green or red excitation), and EG→Q is the FRET efficiency between probe G and Q. Because the Pabs values for both dark quenchers were similar (Pabs = 30 fW for QSY7 and 27 fW for QSY21), the difference in photobleaching lifetimes suggests that QSY21 is indeed more photostable than QSY7, and thus QSY21 is more suitable for applications where observations at long timescales are required. Some quenchers, however, may have such long bleaching lifetimes that quencher photobleaching can be neglected for minute-scale measurements. Along these lines, Schwartz and Quake (17) observed a DNA labeled with Cy3 and dark-quencher BHQ-2 with a FRET efficiency of ∼100% and reported that BHQ-2 blinking/bleaching was not observed.
Quencher blinking was less frequent, with only ∼4% of the time-traces for Q08QSY7 and Q08QSY21 showing blinking. Notably, the quenched and unquenched states before and after the first Q-blinking event have different intensity values (Fig. S9, C and D and Fig. S10 C), either due to different emission states of probe G or different absorption states of probe Q; the switch between intensity states seems to be synchronized with the quenching and unquenching events. Controls with NoQ DNA did not show any event that looked similar to quencher bleaching/blinking for Q08QSY7 and Q08QSY21.
Analysis of other DNAs (see Fig. S11) showed that QSY7 and QSY21 can also bleach due to FRET from probe R. The percentage of time-traces showing bleaching of probe Q (after comparison with Q-independent fluctuations) is higher for quencher positions close to either probe G or R (DNA Q08 and Q33; see Fig. S12), where the amount of energy that the quencher absorbs through FRET from the donor probe (probe G for Q08 DNA and probe R for Q33 DNA) is greatest, making the quencher more prone to bleaching.
Real-time monitoring of DNA polymerase binding to DNA using dark quenchers
Having characterized the basic photophysical properties of dark quenchers QSY7 and QSY21, we used QSY7 to characterize the interaction of a bacterial DNA polymerase to its DNA substrate in real-time using TIRF microscopy. We used the Klenow fragment (KF) of DNA Polymerase I, a high-fidelity polymerase involved in DNA replication and repair (23,31–34).The polymerase is labeled with quencher QSY7 at the base of the thumb (to yield protein KFQ) (Fig. 5, A and B), a location that is essentially fixed relative to the center of the protein during its enzymatic cycle (32). We labeled the substrate DNA with a green fluorophore (Cy3B, brighter than Cy3) and immobilized it on a neutravidin-coated PEGylated surface (Fig. 5 C).
We first studied the immobilized Cy3B-labeled DNA to characterize the basic photophysics of Cy3B. Approximately 80% of the molecules show a stable emission intensity for Cy3B until the fluorophore bleaches (e.g., Fig. 5 D, t ∼ 33 s), whereas a small fraction of DNAs showed a single blinking event to a dark state, or a fluctuation between two intensity states that differ by ∼15% in intensity (data not shown).
To study the interaction of DNA polymerase with the DNA substrate, we added nM concentrations of KFQ to the solution over the surface-immobilized DNA. Use of a dark quencher allowed easy operation at concentrations >10 nM of KFQ; in fact, concentrations of up to ∼1 μM KFQ (see Fig. S16) are easily accessible without significant increase in the background. Because the Förster radius for Cy3B-QSY7 pair is 67 Å (see Table S1), the expected FRET efficiency upon binding of KFQ to the substrate DNA is ∼0.90, as calculated using information from crystal structures (32) (Fig. 5 B).
Upon addition of 15 nM KFQ to DNA (Fig. 5 E), we observed a repeated interconversion between a high intensity state (assigned to the unquenched Cy3B emission) and a state with a mean intensity that is ∼90% lower than the maximum intensity of Cy3B; the latter state is assigned to the binary complex of DNA polymerase with the DNA substrate. The protein-dependent fluctuation in Cy3B intensity was observed in ∼90% of all time-traces and is consistent with the expected quenching efficiency calculated based on crystal structures of the binary complex (Fig. 5 B). Among the time-traces showing quenched states corresponding to a FRET efficiency of 0.91, 15% of the time-traces showed an additional state with an intensity between that of the quenched and unquenched state, possibly due to photophysics of Cy3B switching to a second intensity state. As expected from a bimolecular interaction, increasing the KFQ concentration from 15 nM to 30 nM (Fig. 5 F) increases the on-rate for the complex formation and shortens the dwell-times of the unquenched state because binding events of KFQ to DNA are more frequent.
Control experiments with unlabeled KF ensured that the modulation in Cy3B intensity were due to FRET with QSY7 and not due to a protein-induced fluorescence enhancement (PIFE). Recent work also showed that Cy3B does not show significant PIFE effects (21). The distributions of the intensities of all data bins from Cy3B emission (see Fig. S15) show that no quenched state was observed for all controls with unlabeled KF, supporting the case that the low-intensity state is solely the result of the presence of the quencher.
We analyzed each time-trace with hidden Markov modeling (35) (see Fig. S14) to detect different states in the fluorescence emission intensity signal, thus reporting on the intensity values of each state detected along with their respective dwell times. The good fits (R2 > 0.98) of dwell times for all quenched and unquenched states indicate that binding of KFQ to DNA follows first-order kinetics as expected (Fig. 5, G–J). And, as expected, the mean bound-time is concentration-independent, as the mean bound-times for DNA sample with 15 nM KFQ (τbound = 350 ± 20 ms, Fig. 5 G) and for DNA sample with 30 nM KFQ (τbound = 310 ± 20 ms, Fig. 5 I) are within error. The mean free-time linearly depends on the concentration of KFQ in solution.
Samples with KFQ concentrations of 15 nM and 30 nM gave Kd values of 32 nM and 30 nM, respectively, showing excellent consistency. These values are in excellent agreement with the corresponding value obtained using ensemble solution experiments (23 nM, see the Supporting Material), which suggests that the surface does not interfere significantly with the binding of the polymerase and provides strong validation for the use of dark quenchers to characterize bimolecular interactions at the single-molecule level.
Conclusions
Here, we presented the first systematic characterization of dark quenchers for use in single-molecule fluorescence detection. By studying two popular dark quenchers at both the ensemble and single molecule levels, we demonstrated that dark quenchers can be used to provide structural, thermodynamic, and kinetic information about biomolecular complexes, exemplified by the complex of DNA polymerase with one of its substrates. We showed that the use of dark quenchers as nonemitting acceptors follows the expected FRET-based dependence, simplifying experimental design for interrogating interactions and determining chromophore pairs and labeling strategies.
Studies of immobilized DNA standards revealed bleaching and blinking of dark quenchers, properties not reported before. These properties are important to consider when working at the single-molecule level, because they can complicate the interpretation of fluorescence time-traces. The mean photobleaching lifetimes recorded for DNA fragments with high FRET between a fluorescent donor (Cy3) and dark quencher QSY7 or QSY21 are, however, >25 s, making the quenchers suitable as FRET acceptors to monitor biomolecular interactions in the millisecond-to-second timescale.
The work on dark-quencher-labeled Klenow fragments allows monitoring binding and dissociation of DNA in real-time. The use of TIRF microscopy and quencher-labeled polymerases diffusing freely in solution allows easy operation at concentrations of ∼1 μM with no considerable increase in the background signal. Our work suggests that dark-quencher-labeled proteins will be useful in many assays to study protein-protein interaction or protein-DNA interactions with high Kd values (up to the μM range).
Although working with dark quenchers as FRET acceptors present many advantages, it is important to well characterize dark-quencher-independent photophysics such as PIFE (21) or other photophysics of the FRET donor (multiple emission states, blinking) in the system of interest before associating modulations in donor fluorescence to fluorophore-dark-quencher interactions.
Because we can observe bleaching of a quencher with two fluorophores through simultaneous unquenching of their fluorescence emission intensity, such a three-probe system (two fluorophores and one dark quencher) could be used to monitor the opposite effect (simultaneous quenching of the two fluorophores) and be applied to monitor binding of a molecule labeled with a dark quencher to a second molecule labeled with two fluorophores. A binding event would be detected in separate channels, therefore reducing the risk of misinterpreting a photophysical change in one of the fluorophores as a binding event. This technique could be used in various single-molecule fluorescence assays to extract additional information on distances between probes without requiring additional detection channels, simplifying the instrumentation necessary. Notably, dark quencher-labeled nucleotides could also be used for DNA sequencing applications (36).
Acknowledgments
Note added in proof: While this article was in review, another study (46) using single-molecule FRET with a single fluorophore-dark-quencher pair (Cy3-BHQ-2, same FRET pair used in (17)) was used to follow conformational changes of the ribosome during elongation in real time.
We thank Catherine M. Joyce and Olga Potapova for providing the mutant of Klenow fragment (K550C) and T. Craggs for helpful comments on the manuscript.
A.N.K. was supported by the European Commission Seventh Framework Program (grant No. FP7/2007-2013 HEALTH-F4-2008-201418), the Biotechnology and Biological Research Council (grant No. BB/H01795X/1) and the European Research Council (starter grant No. 261227).
Contributor Information
Ludovic Le Reste, Email: l.lereste1@physics.ox.ac.uk.
Achillefs N. Kapanidis, Email: a.kapanidis1@physics.ox.ac.uk.
Supporting Material
References
- 1.Hohlbein J., Gryte K., Kapanidis A.N. Surfing on a new wave of single-molecule fluorescence methods. Phys. Biol. 2010;7:031001. doi: 10.1088/1478-3975/7/3/031001. [DOI] [PubMed] [Google Scholar]
- 2.Joo C., Balci H., Ha T. Advances in single-molecule fluorescence methods for molecular biology. Annu. Rev. Biochem. 2008;77:51–76. doi: 10.1146/annurev.biochem.77.070606.101543. [DOI] [PubMed] [Google Scholar]
- 3.Weiss S. Measuring conformational dynamics of biomolecules by single molecule fluorescence spectroscopy. Nat. Struct. Biol. 2000;7:724–729. doi: 10.1038/78941. [DOI] [PubMed] [Google Scholar]
- 4.van Oijen A.M. Single-molecule approaches to characterizing kinetics of biomolecular interactions. Curr. Opin. Biotechnol. 2011;22:75–80. doi: 10.1016/j.copbio.2010.10.002. [DOI] [PubMed] [Google Scholar]
- 5.Levene M.J., Korlach J., Webb W.W. Zero-mode waveguides for single-molecule analysis at high concentrations. Science. 2003;299:682–686. doi: 10.1126/science.1079700. [DOI] [PubMed] [Google Scholar]
- 6.Miyake T., Tanii T., Ohdomari I. Real-time imaging of single-molecule fluorescence with a zero-mode waveguide for the analysis of protein-protein interaction. Anal. Chem. 2008;80:6018–6022. doi: 10.1021/ac800726g. [DOI] [PubMed] [Google Scholar]
- 7.Ishitsuka Y., Okumus B., Ha T. Temperature-independent porous nanocontainers for single-molecule fluorescence studies. Anal. Chem. 2010;82:9694–9701. doi: 10.1021/ac101714u. [DOI] [PMC free article] [PubMed] [Google Scholar]
- 8.Lamichhane R., Solem A., Rueda D. Single-molecule FRET of protein-nucleic acid and protein-protein complexes: surface passivation and immobilization. Methods. 2010;52:192–200. doi: 10.1016/j.ymeth.2010.06.010. [DOI] [PMC free article] [PubMed] [Google Scholar]
- 9.Utko P., Persson F., Larsen N.B. Injection molded nanofluidic chips: fabrication method and functional tests using single-molecule DNA experiments. Lab Chip. 2010;11:303–308. doi: 10.1039/c0lc00260g. [DOI] [PubMed] [Google Scholar]
- 10.Cipriany B.R., Zhao R., Soloway P.D. Single molecule epigenetic analysis in a nanofluidic channel. Anal. Chem. 2010;82:2480–2487. doi: 10.1021/ac9028642. [DOI] [PMC free article] [PubMed] [Google Scholar]
- 11.Reynisson E., Josefsen M.H., Hoorfar J. Evaluation of probe chemistries and platforms to improve the detection limit of real-time PCR. J. Microbiol. Methods. 2006;66:206–216. doi: 10.1016/j.mimet.2005.11.006. [DOI] [PubMed] [Google Scholar]
- 12.Beacons of light. 2006. Nat. Biotechnol. 24:303–304.
- 13.Silverman A.P., Abe H., Kool E.T. Quenched autoligation probes. Methods Mol. Biol. 2008;429:161–170. doi: 10.1007/978-1-60327-040-3_11. [DOI] [PubMed] [Google Scholar]
- 14.Thelwell N., Millington S., Brown T. Mode of action and application of Scorpion primers to mutation detection. Nucleic Acids Res. 2000;28:3752–3761. doi: 10.1093/nar/28.19.3752. [DOI] [PMC free article] [PubMed] [Google Scholar]
- 15.Papli N., Landt O., Latif A.A. Evaluation of a TaqMan real-time PCR for the detection of Theileria parva in buffalo and cattle. Vet. Parasitol. 2011;175:356–359. doi: 10.1016/j.vetpar.2010.10.038. [DOI] [PubMed] [Google Scholar]
- 16.Gaiduk A., Yorulmaz M., Orrit M. Room-temperature detection of a single molecule's absorption by photothermal contrast. Science. 2010;330:353–356. doi: 10.1126/science.1195475. [DOI] [PubMed] [Google Scholar]
- 17.Schwartz J.J., Quake S.R. Single molecule measurement of the “speed limit” of DNA polymerase. Proc. Natl. Acad. Sci. USA. 2009;106:20294–20299. doi: 10.1073/pnas.0907404106. [DOI] [PMC free article] [PubMed] [Google Scholar]
- 18.Wang T.-H., Peng Y., Ho C.-M. Single-molecule tracing on a fluidic microchip for quantitative detection of low-abundance nucleic acids. J. Am. Chem. Soc. 2005;127:5354–5359. doi: 10.1021/ja042642i. [DOI] [PubMed] [Google Scholar]
- 19.Kiel A., Kovacs J., Herten D.-P. Direct monitoring of formation and dissociation of individual metal complexes by single-molecule fluorescence spectroscopy. Angew. Chem. Int. Ed. Engl. 2007;46:3363–3366. doi: 10.1002/anie.200604965. [DOI] [PubMed] [Google Scholar]
- 20.Cordes T., Santoso Y., Kapanidis A.N. Sensing DNA opening in transcription using quenchable FRET. Biochemistry. 2010;49:9171–9180. doi: 10.1021/bi101184g. [DOI] [PubMed] [Google Scholar]
- 21.Hwang H., Kim H., Myong S. Protein induced fluorescence enhancement as a single molecule assay with short distance sensitivity. Proc. Natl. Acad. Sci. USA. 2011;108:7414–7418. doi: 10.1073/pnas.1017672108. [DOI] [PMC free article] [PubMed] [Google Scholar]
- 22.Luo G., Wang M., Xie X.S. Single-molecule and ensemble fluorescence assays for a functionally important conformational change in T7 DNA polymerase. Proc. Natl. Acad. Sci. USA. 2007;104:12610–12615. doi: 10.1073/pnas.0700920104. [DOI] [PMC free article] [PubMed] [Google Scholar]
- 23.Joyce C.M., Potapova O., Grindley N.D. Fingers-closing and other rapid conformational changes in DNA polymerase I (Klenow fragment) and their role in nucleotide selectivity. Biochemistry. 2008;47:6103–6116. doi: 10.1021/bi7021848. [DOI] [PubMed] [Google Scholar]
- 24.Santoso Y., Joyce C.M., Kapanidis A.N. Conformational transitions in DNA polymerase I revealed by single-molecule FRET. Proc. Natl. Acad. Sci. USA. 2010;107:715–720. doi: 10.1073/pnas.0910909107. [DOI] [PMC free article] [PubMed] [Google Scholar]
- 25.Lee N.K., Kapanidis A.N., Weiss S. Accurate FRET measurements within single diffusing biomolecules using alternating-laser excitation. Biophys. J. 2005;88:2939–2953. doi: 10.1529/biophysj.104.054114. [DOI] [PMC free article] [PubMed] [Google Scholar]
- 26.Uphoff S., Holden S.J., Kapanidis A.N. Monitoring multiple distances within a single molecule using switchable FRET. Nat. Methods. 2010;7:831–836. doi: 10.1038/nmeth.1502. [DOI] [PubMed] [Google Scholar]
- 27.Clegg R.M., Murchie A.I., Lilley D.M. Observing the helical geometry of double-stranded DNA in solution by fluorescence resonance energy transfer. Proc. Natl. Acad. Sci. USA. 1993;90:2994–2998. doi: 10.1073/pnas.90.7.2994. [DOI] [PMC free article] [PubMed] [Google Scholar]
- 28.Norman D.G., Grainger R.J., Lilley D.M. Location of cyanine-3 on double-stranded DNA: importance for fluorescence resonance energy transfer studies. Biochemistry. 2000;39:6317–6324. doi: 10.1021/bi992944a. [DOI] [PubMed] [Google Scholar]
- 29.Deniz A.A., Dahan M., Schultz P.G. Single-pair fluorescence resonance energy transfer on freely diffusing molecules: observation of Forster distance dependence and subpopulations. Proc. Natl. Acad. Sci. USA. 1999;96:3670–3675. doi: 10.1073/pnas.96.7.3670. [DOI] [PMC free article] [PubMed] [Google Scholar]
- 30.Vogelsang J., Kasper R., Tinnefeld P. A reducing and oxidizing system minimizes photobleaching and blinking of fluorescent dyes. Angew. Chem. Int. Ed. Engl. 2008;47:5465–5469. doi: 10.1002/anie.200801518. [DOI] [PubMed] [Google Scholar]
- 31.Datta K., Johnson N.P., von Hippel P.H. DNA conformational changes at the primer-template junction regulate the fidelity of replication by DNA polymerase. Proc. Natl. Acad. Sci. USA. 2010;107:17980–17985. doi: 10.1073/pnas.1012277107. [DOI] [PMC free article] [PubMed] [Google Scholar]
- 32.Johnson S.J., Taylor J.S., Beese L.S. Processive DNA synthesis observed in a polymerase crystal suggests a mechanism for the prevention of frameshift mutations. Proc. Natl. Acad. Sci. USA. 2003;100:3895–3900. doi: 10.1073/pnas.0630532100. [DOI] [PMC free article] [PubMed] [Google Scholar]
- 33.Klenow H., Henningsen I. Selective elimination of the exonuclease activity of the deoxyribonucleic acid polymerase from Escherichia coli B by limited proteolysis. Proc. Natl. Acad. Sci. USA. 1970;65:168–175. doi: 10.1073/pnas.65.1.168. [DOI] [PMC free article] [PubMed] [Google Scholar]
- 34.Wowor A.J., Datta K., LiCata V.J. Thermodynamics of the DNA structural selectivity of the Pol I DNA polymerases from Escherichia coli and Thermus aquaticus. Biophys. J. 2010;98:3015–3024. doi: 10.1016/j.bpj.2010.03.021. [DOI] [PMC free article] [PubMed] [Google Scholar]
- 35.Bronson J.E., Fei J., Wiggins C.H. Learning rates and states from biophysical time series: a Bayesian approach to model selection and single-molecule FRET data. Biophys. J. 2009;97:3196–3205. doi: 10.1016/j.bpj.2009.09.031. [DOI] [PMC free article] [PubMed] [Google Scholar]
- 36.Kapanidis, A. 2010. Polymerase-based single-molecule sequencing. US Patent 20100297647.
- 37.Joyce C.M., Derbyshire V. Purification of Escherichia coli DNA polymerase I and Klenow fragment. Methods Enzymol. 1995;262:3–13. doi: 10.1016/0076-6879(95)62003-6. [DOI] [PubMed] [Google Scholar]
- 38.Karstens T., Kobs K. Rhodamine B and rhodamine 101 as reference substances for fluorescence quantum yield measurements. J. Phys. Chem. 1980;84:1871–1872. [Google Scholar]
- 39.West M.A., Miller J.N., editors. Standards in Fluorescence Spectrometry. Chapman and Hall; London, UK: 1981. [Google Scholar]
- 40.Iqbal A., Arslan S., Lilley D.M. Orientation dependence in fluorescent energy transfer between Cy3 and Cy5 terminally attached to double-stranded nucleic acids. Proc. Natl. Acad. Sci. USA. 2008;105:11176–11181. doi: 10.1073/pnas.0801707105. [DOI] [PMC free article] [PubMed] [Google Scholar]
- 41.Sanborn M.E., Connolly B.K., Levitus M. Fluorescence properties and photophysics of the sulfoindocyanine Cy3 linked covalently to DNA. J. Phys. Chem. B. 2007;111:11064–11074. doi: 10.1021/jp072912u. [DOI] [PubMed] [Google Scholar]
- 42.Turner R.M., Grindley N.D.F., Joyce C.M. Interaction of DNA polymerase I (Klenow fragment) with the single-stranded template beyond the site of synthesis. Biochemistry. 2003;42:2373–2385. doi: 10.1021/bi026566c. [DOI] [PubMed] [Google Scholar]
- 43.Uphoff S., Gryte K., Kapanidis A.N. Improved temporal resolution and linked hidden Markov modeling for switchable single-molecule FRET. ChemPhysChem. 2011;12:571–579. doi: 10.1002/cphc.201000834. [DOI] [PubMed] [Google Scholar]
- 44.Eggeling C., Ringemann C., Hell S.F. Letter. Direct observation of the nanoscale dynamics of membrane lipids in a living cell. Nature. 2009;457:1159–1162. doi: 10.1038/nature07596. [DOI] [PubMed] [Google Scholar]
- 45.Dale R.E., Eisinger J., Blumberg W.E. The orientational freedom of molecular probes. The orientation factor in intramolecular energy transfer. Biophys. J. 1979;26:161–193. doi: 10.1016/S0006-3495(79)85243-1. [DOI] [PMC free article] [PubMed] [Google Scholar]
- 46.Chen J., Tsai A., Puglisi J.D. Nonfluorescent quenchers to correlate single-molecule conformational and compositional dynamics. J. Am. Chem. Soc. 2012;134:5734–5737. doi: 10.1021/ja2119964. [DOI] [PMC free article] [PubMed] [Google Scholar]
Associated Data
This section collects any data citations, data availability statements, or supplementary materials included in this article.