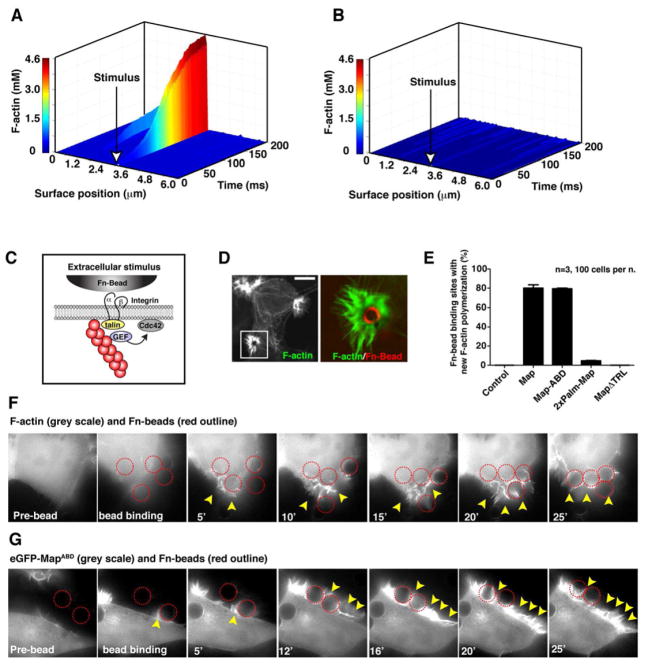
Figure 6. Reconstitution of cue-dependent polarity in the Map signaling system.
(A–B) Computational simulation of a single cell in which an individual membrane compartment was seeded with F-actin attachments prior to running the simulation with (left) or without (right) positive feedback (kfb) in the system. The simulation results are plotted as a 3-D graph showing the surface position (x-axis) and the concentration of F-actin filaments (y-axis) over time (z-axis). The site of seeded F-actin attachments is shown with a white arrow.
(C) Cartoon depicting the β-integrin signaling connection between Fn-bead binding to the outer cell surface and actin filament attachments to this membrane site.
(D). Fluorescent micrograph of actin-rich filopodia clusters induced by Fn-bead binding to a MapABD expressing cell. F-actin is visualized (left) and the boxed region is magnified to illustrate the filopodia protrusions (green) around the Fn-bead (pseudo-colored red).
(E) Quantification of the number of Fn-beads that induced the F-actin phenotype shown in the presence of cells expressing the indicated synthetic Map construct. Data are presented as mean ±SEM.
(F) Time-lapse microscopy of HEK293A cells engaging Fn-beads (outlined in red). These cells are co-expressing Map with eGFP-ABD as a visual marker for actin polymerization dynamics in response to Fn-bead binding. Arrowheads indicate new sites of F-actin polymerization.
(G). Time-lapse microscopy eGFP-MapABD showing GEF recruitment to the sites of Fn-bead engagement (outlined in red) and its subsequent localization within newly formed membrane protrusions (arrowheads).

