Abstract
Objective
The purpose of this study was to assess the ability of a flow-sensitive alternating inversion recovery–arterial spin labeling (FAIR-ASL) technique to track renal perfusion changes during pharmacologic and physiologic alterations in renal blood flow using microspheres as a gold standard.
Materials and Methods
Fluorescent microsphere and FAIR-ASL perfusion were compared in the cortex of the kidney for 11 swine across 4 interventional time points: (1) under baseline conditions, (2) during an acetylcholine and fluid bolus challenge to increase perfusion, (3) initially after switching to isoflurane anesthesia, and (4) after 2 hours of isoflurane anesthesia. In 10 of the 11 swine, a bag of ice was placed on the hilum of 1 kidney at the beginning of isoflurane administration to further reduce perfusion in 1 kidney.
Results
Both ASL and microspheres tracked the expected cortical perfusion changes (P < 0.02) across the interventions, including an increase in perfusion during the acetylcholine challenge and decrease during the administration of isoflurane. Both techniques also measured lower cortical perfusion in the iced compared with the noniced kidneys (P ≤ 0.01). The ASL values were systematically lower compared with microsphere perfusion. Very good correlation (r = 0.81, P < 0.0001) was observed between the techniques, and the relationship appeared linear for perfusion values in the expected physiologic range (microsphere perfusion <550 mL/min/100 g) although ASL values saturated for perfusion >550 mL/min/100 g.
Conclusion
Cortical perfusion measured with ASL correlated with microspheres and reliably detected changes in renal perfusion in response to physiologic challenge.
Keywords: kidney perfusion, MRI, arterial spin labeling, renal perfusion, swine, microspheres
Arterial spin labeling (ASL) perfusion methods using magnetic resonance (MR) imaging are unique from other alternative perfusion modalities such as x-ray computed tomography (CT) and radionuclide scintigraphy in that blood flow can be assessed noninvasively. ASL perfusion, determined by magnetically labeling the inflowing blood, is especially appealing in the kidneys where contrast media (eg, iodinated or gadolinium-based) is potentially toxic.1,2 Although renal perfusion is not routinely measured in the clinical setting today, the literature suggesting its clinical utility is continually expanding.3–18 Perhaps the greatest potential for renal perfusion imaging lies post-transplantation, where noninvasive, longitudinal assessment is favorable. In transplanted rat kidneys, both contrast-enhanced and ASL MR perfusion methods have correlated with histologic rejection during the acute phase.3,15 Human studies indicate that MR perfusion may help differentiate cyclosporine toxicity, acute rejection, and acute tubular necrosis following transplantation.11–14,17 One particular renal perfusion method, first demonstrated by Martirosian et al,8 has shown promise in both native4,6,8,18 and transplanted kidneys8,17 using a flow-sensitive alternating inversion recovery (FAIR) ASL scheme with a balanced steady-state free precession (b-SSFP) image readout. Studies using this FAIR-ASL technique have correlated perfusion values with renal artery stenosis as well as renal plasma flow in native kidneys.6,18 In addition, investigators have noted changes in FAIR-ASL renal blood flow after treatment with telmisartan,18 and significant differences in perfusion were observed between healthy allografts and those experiencing an acute decrease in renal function.17
The encouraging results in human kidneys mandate further validation of renal ASL measurements using a gold standard for perfusion. To the best of our knowledge, only 1 validation study was performed in an animal model, and it compared renal ASL perfusion to calibrated vessel flow, as determined from an ultrasound flow probe, in a single ex vivo swine kidney.19 The present study uses an in vivo interventional swine model to assess the ability of a FAIR-ASL technique to track cortical perfusion changes during pharmacologic and physiologic alterations in renal blood flow using fluorescent microspheres as a gold standard.
MATERIALS AND METHODS
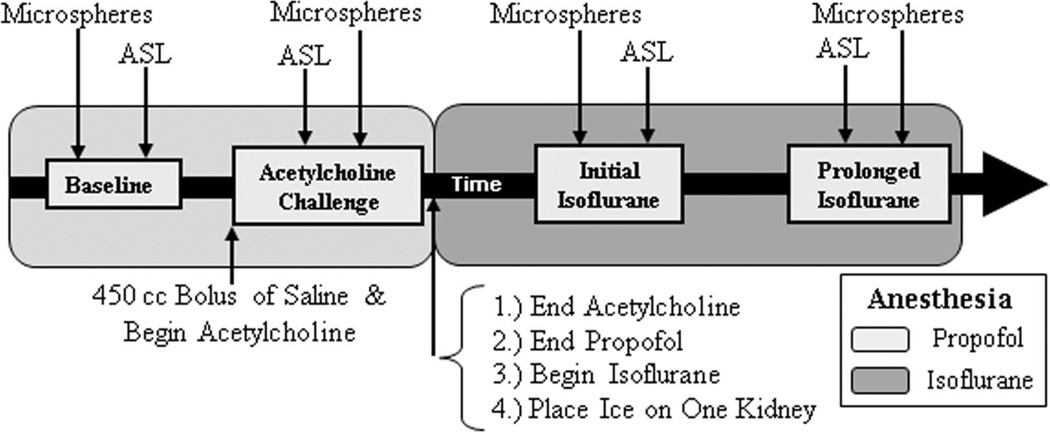
Institutional Animal Care and Use committee approval was obtained before the initiation of this study. Eleven female swine (32–38 kg; 10–12 weeks of age) were induced with xylazine hydrochloride (2.2 mg/kg) and Telazol (7 mg/kg), and maintained for the first 2 hours of the experiment with propofol (10 mg/kg/h) and Fentanyl (0.0035 mg/kg/h), followed by isoflurane (2.5%–3.5%) for the last 2 hours of the experiment. MR ASL acquisitions were performed at 4 interventional points: (1) under the anesthetic propofol (“baseline”), (2) during administration of acetylcholine (4.5 µg/kg/min) and propofol with a 450 mL bolus of 0.9% normal saline (“acetylcholine challenge” to increase perfusion), (3) baseline after switching to isoflurane anesthesia (“initial isoflurane”), and (4) after 2 hours of isoflurane (“prolonged isoflurane”). Microspheres were injected at each interventional time point as well. Because of logistical limitations, corresponding microsphere and ASL perfusion measurements could not be performed simultaneously. The time delay between the 2 measurements typically ranged from 10 to 30 minutes, but was as long as 60 minutes in a few instances. A general timeline describing the anesthesia, interventions, and perfusion measurements is displayed in Figure 1.
FIGURE 1.
General timeline of anesthesia, interventions, and perfusion measurements.
An Ohio Medical Products anesthesia ventilator (Airco Inc, Madison, WI) was used to ventilate the swine throughout the experiment and to deliver isoflurane anesthesia for the last half of the experiment. For the administration of acetylcholine and saline, a 6-French aortic catheter was placed through a femoral artery sheath and positioned just above the renal arteries. A 5-French catheter was placed in 1 carotid artery, and a pig tail catheter was inserted into the left ventricle, which served as a mixing chamber for the injection of microspheres. A contralateral femoral sheath was inserted to draw reference blood for microsphere measurements of perfusion. When not drawing reference blood samples, an intravascular probe was placed in this femoral sheath to monitor heart rate and blood pressure using a Veris MR Vital Signs Monitor system (MEDRAD, Inc, Warrendale, PA). Two injections of NuFlow fluorescent microspheres (IMT Stason Pharmaceuticals, Irvine, CA) were performed back-to-back for each intervention time point (sphere diameter = 15 µm; 2.5 × 10⁶ spheres/injection; injections were 2 minutes apart). Each injection used a unique fluorescent color label and was performed after the microsphere vial was sonicated in an ultrasound water bath for 5 minutes and vortexed for 30 seconds. The reference blood was drawn over 2 minutes at a rate of 7.5 mL/min using a Harvard withdrawal pump (Harvard Apparatus, Holliston, MA). In 10 of the 11 swine, a bag of ice was placed on the hilum of 1 kidney at the beginning of isoflurane administration to further reduce perfusion.20 Although usually placed on the left kidney, the ice was positioned on the right kidney for 1 swine. Swine were euthanized with Beuthanasia-D (0.2 mL/kg) and the kidneys were harvested.
Twelve cortical tissue samples (6 from each harvested kidney) were excised for microsphere analysis, which was performed using automated tissue digestion and flow cytometry by IMT Stason Pharmaceuticals (Irvine, CA). Tissue was sampled equally from 3 locations: the distal side of the kidney as well as the superior and inferior poles. Microsphere perfusion was calculated for each tissue sample using the following equation: Qk = (Ck × Qr)/Cr, where Qk = kidney perfusion (mL/min/100 g), Ck = microsphere count per 100 g of kidney tissue, Qr = withdrawal rate of the reference blood sample (mL/min), and Cr = microsphere count in the reference blood sample.21 The perfusion measurements were then averaged across samples for each kidney. In addition, the perfusion values from back-to-back injections were averaged to generate a mean cortical perfusion value for each kidney at each intervention time point.
Scan Protocol
Scans were performed on a 1.5 T MR scanner (Signa HDx, GE Healthcare, Milwaukee, WI) with an 8-element phased array cardiac coil (GE Healthcare, Milwaukee, WI). ASL images were acquired using a FAIR-b-SSFP acquisition scheme8 with a 20-milliseconds hyperbolic secant adiabatic inversion pulse and the following readout parameters: repetition time/echo time/flip = 4.6/2.3 ms/70°, bandwidth = 83.33 kHz, field of view = 34–36 cm, matrix = 128 × 128, and slice thickness = 8 mm. An oblique slice was placed coronal to the kidneys and was central to a 20-mm slice selective inversion thickness. Placement was carefully chosen not to include the major feeding vessels upon selective inversion. The inversion pulse was respiratory-triggered using a breathing belt postexhalation, and following an inversion time (TI) of 1.2 seconds, a centric phase encoded balanced-SSFP image was acquired. Respiratory rates were established by the ventilator and set to 12 breaths/min to allow sufficient magnetization recovery between inversions (≥5 seconds between breaths). Control and tag images were alternated until 64 (32 pairs) total images were acquired. Proton density images (to measure M0) were obtained with a number of excitations = 4 by using the b-SSFP readout with no inversion preceding it. Scanning was completed in 6 minutes.
Image Segmentation and Processing
Data were analyzed using custom scripts written in MATLAB (version 7.5, The MathWorks Inc, Cambridge, MA). Rectangular regions of interest (“ROIs”) were drawn around each kidney and were registered independently through the image series by using automated rigid registration based on normalized mutual information. The mean of the registered tag images, MT, was then subtracted from the mean of the registered control images, MC, to obtain a difference image, ΔM, of the kidney. After manually segmenting out the kidney using the T1-weighted MC image, threshold techniques were used to differentiate cortex from medulla. For a limited number of cases, the coil sensitivity varied across the kidney or segmental vessels were visible, necessitating segmentation.
ASL perfusion technique was determined based on a one-compartment model:
| (1) |
where f ≡ perfusion, λ ≡ tissue-to-blood partition coefficient for water = 80 mL/100 g,22 α ≡ inversion efficiency = 1.0, TI ≡ inversion time = 1.2 seconds, and T1 ≡ longitudinal relaxation time = 1.0 seconds for the cortex.23 Each pixel’s measured ΔM and M0 were used to generate a perfusion map of the entire kidney. Flow values from all the designated cortical pixels were averaged together to provide mean cortical perfusion for each kidney.
Statistical Analysis
For each kidney at each intervention, microsphere perfusion measurements from injections 1 and 2 were averaged across all tissue samples to generate 1 mean cortical perfusion value for each kidney. Absolute ASL and microsphere perfusion measurements for all 11 swine (22 kidneys) were plotted across interventions. A paired t test was used to determine if the perfusion difference between interventions was statistically significant. The t test was performed for the left and right kidneys separately across all swine. Normalized perfusion was also determined in which blood flow was normalized to the first measurement at baseline for each kidney. These normalized perfusion values were then averaged across all swine (22 kidneys) for each intervention and displayed in a bar plot. To evaluate reproducibility of the back-to-back microsphere injections (2 minutes apart), both a Pearson correlation coefficient and a linear regression equation were determined. Finally, a Pearson correlation coefficient was also calculated for ASL and microsphere perfusion using consistent data from all 22 kidneys across all 4 intervention time points. Data were considered consistent when they met 2 criteria: (1) the mean arterial blood pressure (MABP) varied by 20% or less between the microsphere injection and corresponding ASL scan, and (2) back-to-back microsphere injections yielded perfusion values that varied by no more than 50% where percent difference is defined in Equation 3 below.
| (2) |
RESULTS
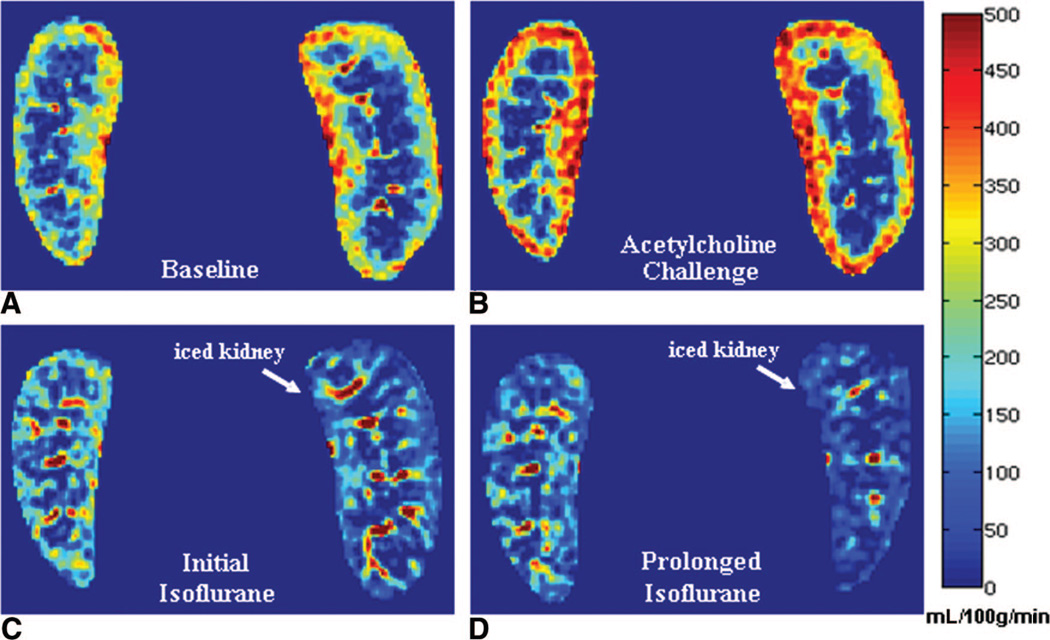
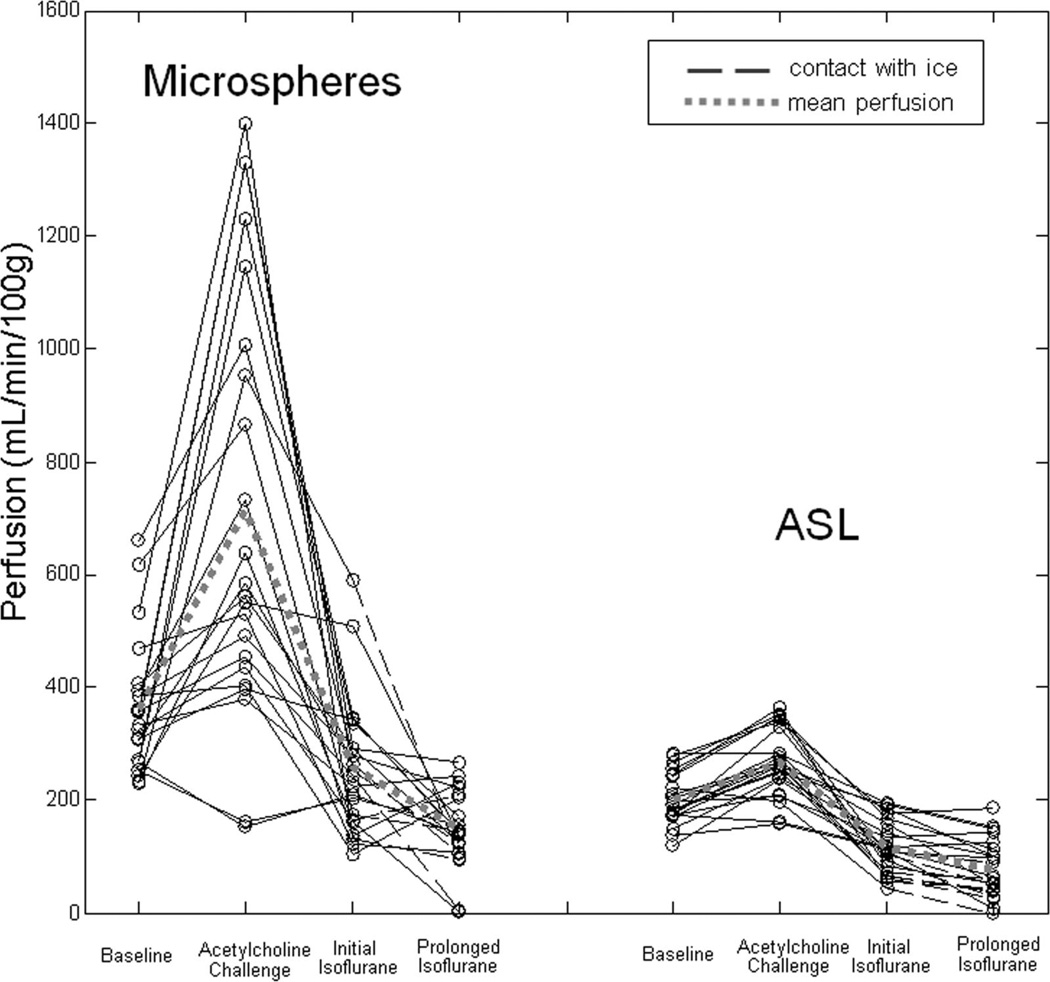
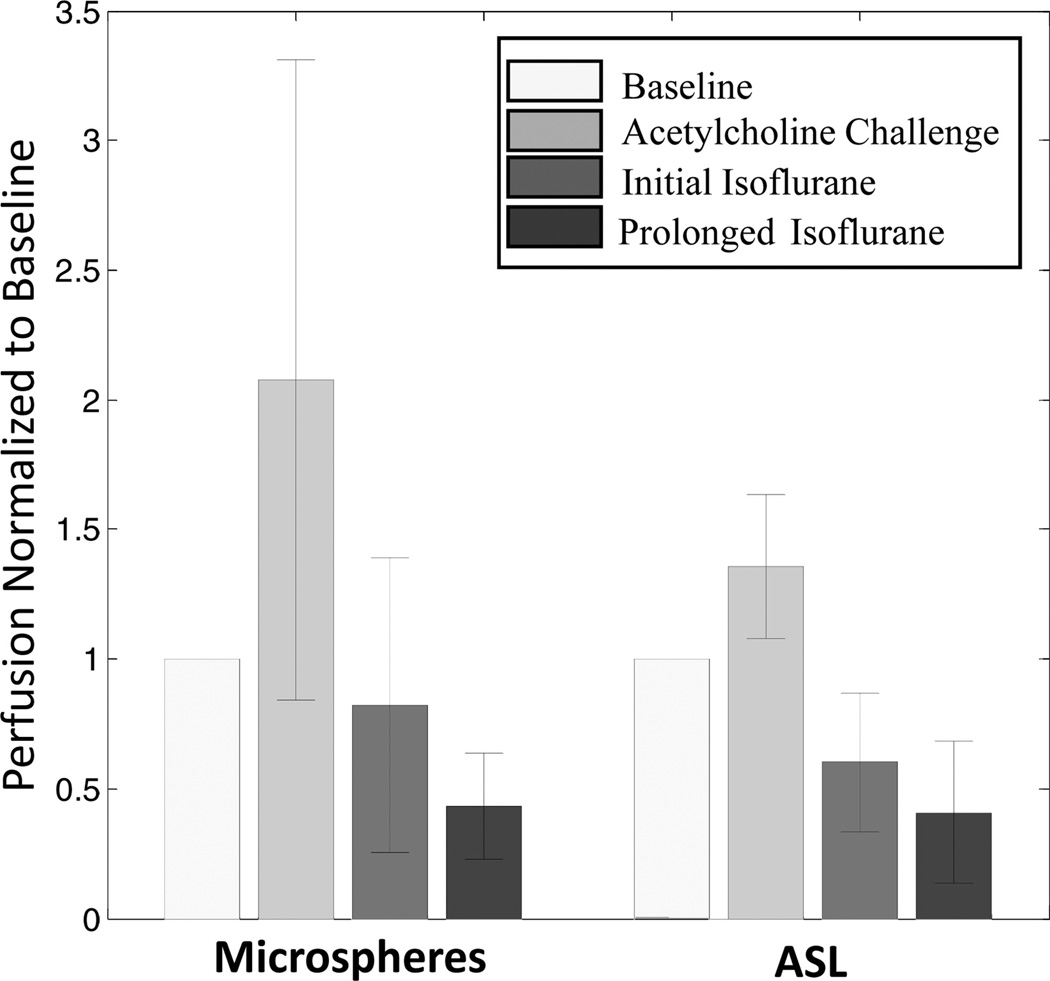
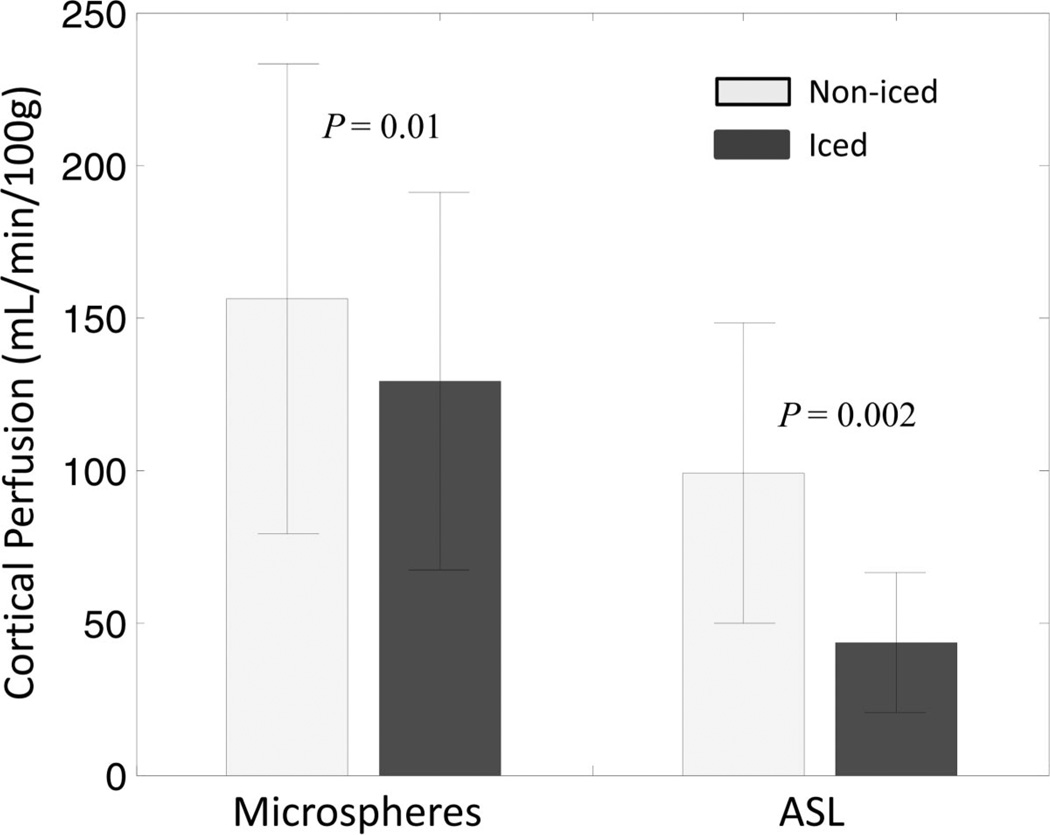
Example ASL perfusion maps calculated for one swine across the interventions demonstrate an increase in cortical blood flow with acetylcholine and a subsequent decrease with transition to isoflurane anesthesia (Fig. 2). During isoflurane administration, cortical blood flow in the iced kidney was also lower than the noniced kidney (Fig. 2). Using data from all 11 swine, mean cortical perfusion changes from 1 intervention point to the next were statistically significant (P < 0.02) in the left and right kidneys for both microsphere and ASL techniques (Table 1). Both ASL and microsphere flow values increased during the acetylcholine challenge and decreased afterward during the administration of isoflurane. Cortical perfusion measurements for all 11 swine (22 kidneys) are displayed in Figure 3 for both the microsphere and ASL techniques. Compared with microsphere perfusion, ASL values were systematically lower. Normalizing to the baseline perfusion measurement for each swine demonstrates that the relative perfusion response to the acetylcholine challenge was less dramatic with ASL (Fig. 4). In addition to demonstrating changes in cortical perfusion with interventions, both techniques measured a statistically significant decrease (P ≤ 0.01) in cortical blood flow in the iced kidneys, compared with the noniced kidneys (Fig. 5).
FIGURE 2.
ASL perfusion maps at baseline under the anesthetic propofol (A), during the acetylcholine and saline bolus challenge (B), directly following isoflurane administration (C), and after approximately 2 hours of isoflurane (D). A bag of ice was placed on the hilum of the left kidney (right side of image) at the beginning of isoflurane administration. Comparing A and B, the kidney borders are different in C and D because of slice location differences and deformation due to ice placement.
TABLE 1.
Average Swine Perfusion for Each Intervention and Paired t Test Comparison of Perfusion Change Between Interventions
| Kidney | No. Swine | Baseline | P | Acetylcholine Challenge |
P | Initial Isoflurane | P | Prolonged Isoflurane | |
|---|---|---|---|---|---|---|---|---|---|
| Microspheres | Right | 11 | 369 (±147) | 0.0002 | 711 (±389) | 0.007 | 272 (±145) | 0.003 | 159 (±74) |
| Left | 11 | 367 (±143) | 0.0005 | 754 (±478) | 0.0006 | 251 (±172) | 0.009 | 130 (±61) | |
| ASL | Right | 11 | 205 (±54) | 0.003 | 258 (±70) | 0.0001 | 136 (±38) | 0.014 | 103 (±49) |
| Left | 11 | 197 (±36) | 0.0001 | 278 (±51) | <0.0001 | 95 (±48) | 0.0004 | 52 (±44) |
Baseline, acetylcholine challenge, initial isoflurane, and prolonged isoflurane perfusion values are listed in mL/min/100 g.
FIGURE 3.
Microsphere and ASL perfusion versus intervention in 11 swine (22 kidneys). Data points connected with dashed lines correspond to kidneys which were in contact with ice during the administration of isoflurane. The dashed, gray line corresponds to mean perfusion across all swine kidneys at each of the 4 measured time points.
FIGURE 4.
Normalized microsphere and ASL perfusion versus intervention averaged for 11 swine (22 kidneys). Perfusion for each kidney was normalized to the initial, baseline measurement. Error bars represent the standard deviation.
FIGURE 5.
Microsphere and ASL perfusion values in the noniced and iced kidneys averaged for 10 swine at the prolonged isoflurane time point. Error bars represent the standard deviation. Relative to the noniced kidneys, lower perfusion was detected in the iced kidneys with both microspheres (P = 0.01) and ASL (P = 0.002) as determined by a paired t test.
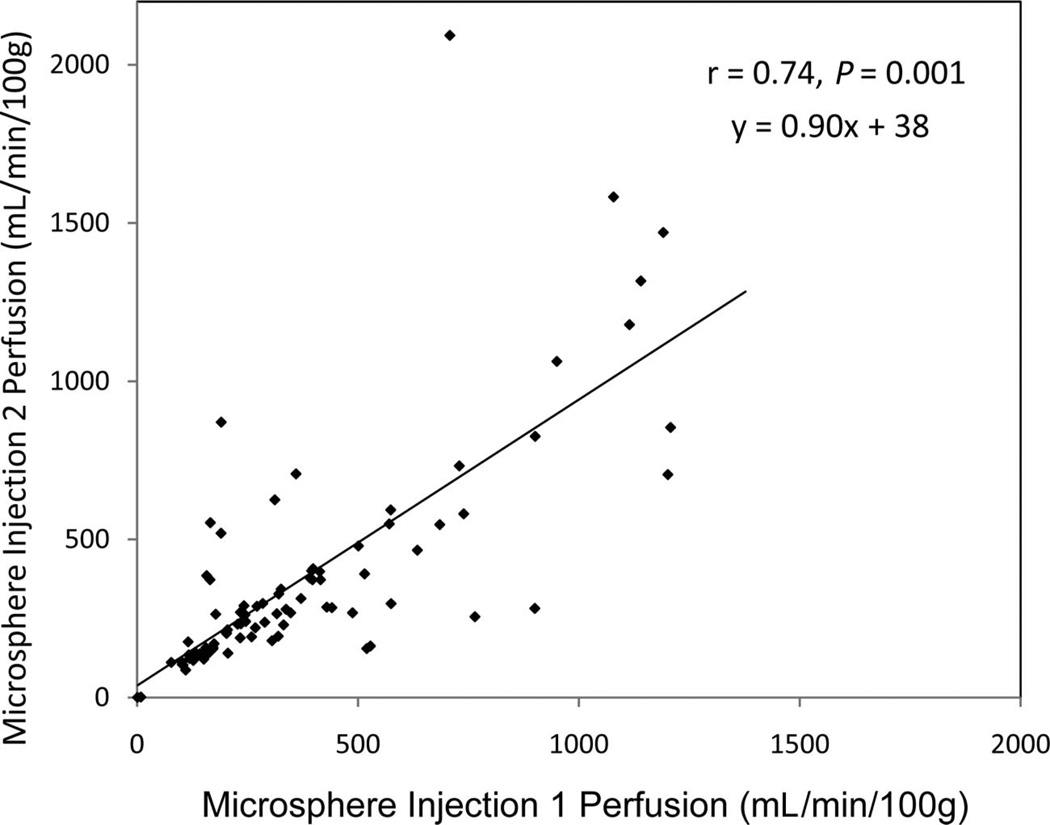
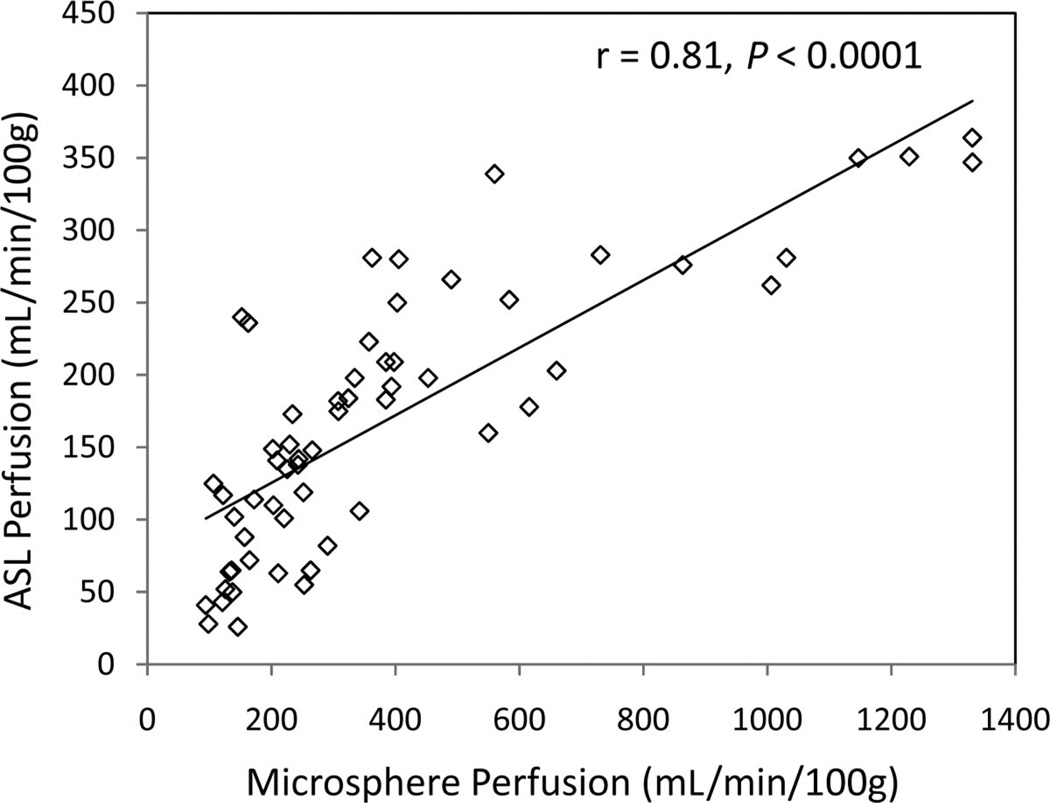
Microsphere perfusion measured from injections performed 2 minutes apart demonstrated reasonable correlation (r = 0.74, P < 0.001), yet absolute reproducibility was less than expected (Fig. 6). Linear regression (y = 0.90x + 38) yielded a nonzero intercept and a slope less than 1. Nonetheless, ASL and microsphere perfusion correlated well (r = 0.81, P < 0.0001) for the 59 of 88 data points (11 swine × 2 kidneys × 4 interventions) that met the consistency criteria: ≤20% MABP variation and ≤50% variation in perfusion from back-to-back microsphere injections (Fig. 7). Although the relationship between ASL and microsphere blood flow appeared linear for perfusion in a physiologically expected range, that is, microsphere perfusion <550 mL/min/100 g, ASL values did not increase proportionately for higher microsphere perfusion values but instead approached a maximum limit.
FIGURE 6.
Reproducibility of microsphere perfusion for injections performed 2 minutes apart. Correlation was good (r = 0.74, P < 0.001). However, many data points demonstrate substantial variability from absolute agreement. In addition, the line of regression yields a slope less than 1 (y = 0.90× + 38).
FIGURE 7.
ASL versus microsphere perfusion measurements plotted for all interventions over all the swine data that met the consistency criteria: <20% MABP variation and <50% variation in perfusion from back-to-back microsphere injections. Of 88 possible data points, (11 swine × 2 kidneys × 4 interventions), 59 data points met the criteria for consistency, which were plotted above and used for correlation analysis. These data demonstrate a correlation of 0.81 (P < 0.0001). Note that ASL values did not increase proportionately for higher microsphere perfusion values but instead approached a maximum limit.
DISCUSSION
To the best of our knowledge, this is the first study to assess the ability of a FAIR-ASL technique to track cortical perfusion changes during pharmacologic and physiologic alterations in renal blood flow using fluorescent microspheres as a gold standard. Using data from 11 swine, ASL was capable of measuring an increase in cortical perfusion during the acetylcholine challenge and subsequent decrease in perfusion during the administration of isoflurane. ASL was also able to detect lower cortical blood flow in the iced kidneys compared with the noniced kidneys. These changes in cortical perfusion were confirmed using microspheres, and ASL and microsphere perfusion demonstrated very good correlation based on linear regression (r = 0.81, P < 0.0001).
The relationship between ASL and microspheres appeared linear for perfusion values below 550 mL/min/100 g, representative of normal physiologic conditions. This linear relationship did not continue into the higher flow regimes, where the ASL perfusion values approached a maximum limit. A breakdown in linearity for nonphysiologically high flow is expected. The modeling used for ASL quantification in the present study assumes complete exchange between labeled blood and tissue spins. In reality, extremely high blood flow impairs this exchange and results in an underestimation of perfusion.24 Because of reduced diffusivity, it is also possible that some of the labeled spins flowed out of the cortical region through the venous system during the 1.2-second delay time and were not present during imaging. This scenario would contribute to underestimating ASL perfusion as well.
However, even for microsphere perfusion below 550 mL/min/100 g, systematic underestimation was still observed with ASL. The partition coefficient and inversion efficiency assumed for ASL perfusion quantification (λ = 80 mL/100 g and α = 1.0, respectively) have been used in many other ASL studies4,6–8,17,18,22 but may have contributed to underestimation. In reality, α is always less than unity. Other renal perfusion studies have used larger λ values as well, up to 94 mL/100 g.19 Using a more realistic, lower α in addition to a larger λ would have increased the ASL perfusion values in this study, but a substantial underestimation as compared with microspheres would remain. Selective inversion of blood spins in the feeding vasculature may have also contributed to the systematic underestimation, because these blood spins are assumed to flow into the tissue at equilibrium. Care was taken to choose a slice without major feeding vessels, but the smaller feeding vessels included in the slice were inadvertently labeled. Moreover, the selective inversion slab was 2.5 times wider than the image slice thickness to account for imperfections in the slice profile. These practical limitations may have led to underestimation of perfusion values.
Underestimation in renal perfusion for lower flow states was not observed in the ASL validation study performed by Warmuth et al in an ex vivo swine kidney.19 Using FAIR combined with echoplanar imaging and an ultrasound flowmeter, their group found good agreement between ASL perfusion and calibrated vessel flow. It is worth noting that the cortical perfusion values observed in that study are in very good agreement with the ASL values measured in this investigation. Strong agreement also exists with a study examining swine kidney perfusion using a contrast-enhanced MR approach.25 Nonetheless, results from the present investigation suggest that in the physiological realm (kidney perfusion <550 mL/min/100 g) this FAIR-ASL method provides only relative perfusion measurements, not absolute.
The effect of acetylcholine on renal perfusion varies within the literature. In rats, Badzynska and Sadowski26 demonstrated only a 10% increase in cortical blood flow. However, Krier et al27 observed an increase in renal blood flow up to 66% for swine, and Oliver et al28 reported that cortical perfusion increased by 90% in rabbit kidneys. In our study, a 450 mL bolus of saline was also administered during the acetylcholine challenge, which may explain why microsphere perfusion values increased by 100% when averaged across swine (Fig. 4). The ASL measurements demonstrated a less dramatic response, only 30%, likely due to saturation for the high flow states that were characteristic of the acetylcholine challenge. Following the acetylcholine challenge, the anesthesia was switched to isoflurane because it can cause a decrease in renal perfusion.29,30 This effect was observed in the present study as well. Both microsphere and ASL perfusion measurements decreased to values below the initial, baseline measurements after switching to isoflurane (Table 1, Fig. 4).
There are limitations to the present study. We note that microsphere perfusion, the gold standard in this investigation, demonstrated only mediocre reproducibility in the kidney. Glenny et al demonstrated excellent microsphere reproducibility in renal perfusion when 2 different colors were injected simultaneously and the reference blood sample was shared for analysis.31 Our study examined reproducibility from back-to-back microsphere injections, each with its own reference blood sample. It remains uncertain whether the variations in measurement between injection 1 and 2 are because of a measurement error despite rigorous consistency in procedures or are genuine fluctuations in renal perfusion. To our knowledge, the only other renal study that measured variation between back-to-back microsphere injections was performed by Gervais et al who also noticed substantial variation, listing coefficients of variation around 45% in rat kidneys.32 We believe that the variation between back-to-back microsphere measurements in the present study represent genuine fluctuations in renal perfusion. Considering that microspheres deposit in a matter of seconds, it would not be appropriate to correlate microsphere perfusion measured during periods of extreme fluctuation to ASL measurements, which are averaged over a 6-minute scan. For this reason, when the percent difference between microsphere injections 1 and 2 was greater than 50%, the data were not used for ASL versus microsphere perfusion correlation.
Because of logistical and magnetic field restrictions, corresponding ASL measurements and microsphere injections could not be made simultaneously. To address these unavoidable delays, the MABP was continually monitored and corresponding measurements were only used in ASL versus microsphere correlation analysis when the blood pressure varied by ≤20%. An assumed cortical T1 value is another limitation of the present study as the T1 can vary regionally throughout the kidney and across subjects. Finally, medullary perfusion was not assessed in this investigation because medullary microsphere analysis was not deemed statistically reliable by IMT Stason Pharmaceuticals.
In summary, this noncontrast-enhanced FAIR-ASL technique tracked cortical perfusion changes and correlated with microspheres. These results provide validation of this technology for imaging of relative renal perfusion when perfusion is less than 550 mL/min/100 g. Extension of this ASL method to human studies assessing reproducibility and the role of ASL in evaluating renal perfusion in disease are ongoing in native and transplanted kidneys.
ACKNOWLEDGMENTS
The authors thank Zhifei Wen, PhD, for help with ASL acquisition and processing development, our research technologist, Kelli Hellenbrand, for performing the scans, Dan Consigny for animal care and surgery, and GE Healthcare for their research support.
Supported by internal department research funds, Society of Uroradiology, and the National Institute of Health (NIH grants R01 DK073680, R21 DK070243).
REFERENCES
- 1.Gleeson TG, Bulugahapitiya S. Contrast-induced nephropathy. Am J Roentgenol. 2004;183:1673–1689. doi: 10.2214/ajr.183.6.01831673. [DOI] [PubMed] [Google Scholar]
- 2.Kuo PH, Kanal E, Abu-Alfa AK, et al. Gadolinium-based MR contrast agents and nephrogenic systemic fibrosis. Radiology. 2007;242:647–649. doi: 10.1148/radiol.2423061640. [DOI] [PubMed] [Google Scholar]
- 3.Beckmann N, Joergensen J, Bruttel K, et al. Magnetic resonance imaging for the evaluation of rejection of a kidney allograft in the rat. Transpl Int. 1996;9:175–183. doi: 10.1007/BF00335383. [DOI] [PubMed] [Google Scholar]
- 4.Boss A, Martirosian P, Graf H, et al. High resolution MR perfusion imaging of the kidneys at 3 Tesla without administration of contrast media. Rofo. 2005;177:1625–1630. doi: 10.1055/s-2005-858761. [DOI] [PubMed] [Google Scholar]
- 5.De Bazelaire C, Rofsky NM, Duhamel G, et al. Arterial spin labeling blood flow magnetic resonance imaging for the characterization of metastatic renal cell carcinoma(1) Acad Radiol. 2005;12:347–357. doi: 10.1016/j.acra.2004.12.012. [DOI] [PubMed] [Google Scholar]
- 6.Fenchel M, Martirosian P, Langanke J, et al. Perfusion MR imaging with FAIR true FISP spin labeling in patients with and without renal artery stenosis: initial experience. Radiology. 2006;238:1013–1021. doi: 10.1148/radiol.2382041623. [DOI] [PubMed] [Google Scholar]
- 7.Karger N, Biederer J, Lusse S, et al. Quantitation of renal perfusion using arterial spin labeling with FAIR-UFLARE. Magn Reson Imaging. 2000;18:641–647. doi: 10.1016/s0730-725x(00)00155-7. [DOI] [PubMed] [Google Scholar]
- 8.Martirosian P, Klose U, Mader I, et al. FAIR true-FISP perfusion imaging of the kidneys. Magn Reson Med. 2004;51:353–361. doi: 10.1002/mrm.10709. [DOI] [PubMed] [Google Scholar]
- 9.Michaely HJ, Schoenberg SO, Ittrich C, et al. Renal disease: value of functional magnetic resonance imaging with flow and perfusion measurements. Invest Radiol. 2004;39:698–705. doi: 10.1097/00004424-200411000-00008. [DOI] [PubMed] [Google Scholar]
- 10.Robson PM, Madhuranthakam AJ, Dai W, et al. Strategies for reducing respiratory motion artifacts in renal perfusion imaging with arterial spin labeling. Magn Reson Med. 2009;61:1374–1387. doi: 10.1002/mrm.21960. [DOI] [PMC free article] [PubMed] [Google Scholar]
- 11.Sadowski EA, Djamali A, Wentland AL, et al. Blood oxygen level-dependent and perfusion magnetic resonance imaging: detecting differences in oxygen bioavailability and blood flow in transplanted kidneys. Magn Reson Imaging. 2010;28:56–64. doi: 10.1016/j.mri.2009.05.044. [DOI] [PMC free article] [PubMed] [Google Scholar]
- 12.Szolar DH, Preidler K, Ebner F, et al. Functional magnetic resonance imaging of human renal allografts during the post-transplant period: preliminary observations. Magn Reson Imaging. 1997;15:727–735. doi: 10.1016/s0730-725x(97)00088-x. [DOI] [PubMed] [Google Scholar]
- 13.Wentland AL, Sadowski EA, Djamali A, et al. Quantitative MR measures of intrarenal perfusion in the assessment of transplanted kidneys: initial experience. Acad Radiol. 2009;16:1077–1085. doi: 10.1016/j.acra.2009.03.020. [DOI] [PMC free article] [PubMed] [Google Scholar]
- 14.Sharma RK, Gupta RK, Poptani H, et al. The magnetic resonance renogram in renal transplant evaluation using dynamic contrast-enhanced MR imaging. Transplantation. 1995;59:1405–1409. doi: 10.1097/00007890-199505270-00008. [DOI] [PubMed] [Google Scholar]
- 15.Wang JJ, Hendrich KS, Jackson EK, et al. Perfusion quantitation in transplanted rat kidney by MRI with arterial spin labeling. Kidney Int. 1998;53:1783–1791. doi: 10.1046/j.1523-1755.1998.00945.x. [DOI] [PubMed] [Google Scholar]
- 16.Sadick M, Schock D, Kraenzlin B, et al. Morphologic and dynamic renal imaging with assessment of glomerular filtration rate in a pcy-mouse model using a clinical 3.0 Tesla scanner. Invest Radiol. 2009;44:469–475. doi: 10.1097/RLI.0b013e3181a8afa1. [DOI] [PubMed] [Google Scholar]
- 17.Lanzman RS, Wittsack HJ, Martirosian P, et al. Quantification of renal allograft perfusion using arterial spin labeling MRI: initial results. Eur Radiol. 2010;20:1485–1491. doi: 10.1007/s00330-009-1675-0. [DOI] [PubMed] [Google Scholar]
- 18.Ritt M, Janka R, Schneider MP, et al. Measurement of kidney perfusion by magnetic resonance imaging: comparison of MRI with arterial spin labeling to para-aminohippuric acid plasma clearance in male subjects with metabolic syndrome. Nephrol Dial Transplant. 2010;25:1126–1133. doi: 10.1093/ndt/gfp639. [DOI] [PubMed] [Google Scholar]
- 19.Warmuth C, Nagel S, Hegemann O, et al. Accuracy of blood flow values determined by arterial spin labeling: a validation study in isolated porcine kidneys. J Magn Reson Imaging. 2007;26:353–358. doi: 10.1002/jmri.21011. [DOI] [PubMed] [Google Scholar]
- 20.Levy MN. Oxygen consumption and blood flow in the hypothermic, perfused kidney. Am J Physiol. 1959;197:1111–1114. doi: 10.1152/ajplegacy.1959.197.5.1111. [DOI] [PubMed] [Google Scholar]
- 21.Jackson BM, Gorman JH, Moainie SL, et al. Extension of borderzone myocardium in postinfarction dilated cardiomyopathy. J Am Coll Cardiol. 2002;40:1160–1167. doi: 10.1016/s0735-1097(02)02121-6. discussion 1168–1171. [DOI] [PubMed] [Google Scholar]
- 22.Roberts DA, Detre JA, Bolinger L, et al. Renal perfusion in humans: MR imaging with spin tagging of arterial water. Radiology. 1995;196:281–286. doi: 10.1148/radiology.196.1.7784582. [DOI] [PubMed] [Google Scholar]
- 23.Bjornerud A, Johansson LO, Briley-Saebo K, et al. Assessment of T1 and T2* effects in vivo and ex vivo using iron oxide nanoparticles in steady state–dependence on blood volume and water exchange. Magn Reson Med. 2002;47:461–471. doi: 10.1002/mrm.10066. [DOI] [PubMed] [Google Scholar]
- 24.St Lawrence KS, Frank JA, McLaughlin AC. Effect of restricted water exchange on cerebral blood flow values calculated with arterial spin tagging: a theoretical investigation. Magn Reson Med. 2000;44:440–449. doi: 10.1002/1522-2594(200009)44:3<440::aid-mrm15>3.0.co;2-6. [DOI] [PubMed] [Google Scholar]
- 25.Ludemann L, Nafz B, Elsner F, et al. Absolute quantification of regional renal blood flow in swine by dynamic contrast-enhanced magnetic resonance imaging using a blood pool contrast agent. Invest Radiol. 2009;44:125–134. doi: 10.1097/RLI.0b013e318193598c. [DOI] [PubMed] [Google Scholar]
- 26.Badzynska B, Sadowski J. Renal hemodynamic responses to intrarenal infusion of acetylcholine: comparison with effects of PGE2 and NO donor. Kidney Int. 2006;69:1774–1779. doi: 10.1038/sj.ki.5000338. [DOI] [PubMed] [Google Scholar]
- 27.Krier JD, Ritman EL, Bajzer Z, et al. Noninvasive measurement of concurrent single-kidney perfusion, glomerular filtration, and tubular function. Am J Physiol Renal Physiol. 2001;281:F630–F638. doi: 10.1152/ajprenal.2001.281.4.F630. [DOI] [PubMed] [Google Scholar]
- 28.Oliver JJ, Rajapakse NW, Evans RG. Effects of indomethacin on responses of regional kidney perfusion to vasoactive agents in rabbits. Clin Exp Pharmacol Physiol. 2002;29:873–879. doi: 10.1046/j.1440-1681.2002.03742.x. [DOI] [PubMed] [Google Scholar]
- 29.Hartman JC, Pagel PS, Proctor LT, et al. Influence of desflurane, isoflurane and halothane on regional tissue perfusion in dogs. Can J Anaesth. 1992;39:877–887. doi: 10.1007/BF03008300. [DOI] [PubMed] [Google Scholar]
- 30.Manohar M, Gustafson R, Goetz TE, et al. Systemic distribution of blood flow in ponies during 1.45%, 1.96%, and 2.39% end-tidal isoflurane-O2 anesthesia. Am J Vet Res. 1987;48:1504–1510. [PubMed] [Google Scholar]
- 31.Glenny RW, Bernard S, Brinkley M. Validation of fluorescent-labeled microspheres for measurement of regional organ perfusion. J Appl Physiol. 1993;74:2585–2597. doi: 10.1152/jappl.1993.74.5.2585. [DOI] [PubMed] [Google Scholar]
- 32.Gervais M, Demolis P, Domergue V, et al. Systemic and regional hemodynamics assessment in rats with fluorescent microspheres. J Cardiovasc Pharmacol. 1999;33:425–432. doi: 10.1097/00005344-199903000-00013. [DOI] [PubMed] [Google Scholar]


