

Abstract
Cytoskeleton-associated proteins play key roles not only in regulating cell morphology and migration but also in proliferation. Mutations in the cytoskeleton-associated gene filamin A (FlnA) cause the human disorder periventricular heterotopia (PH). PH is a disorder of neural stem cell development that is characterized by disruption of progenitors along the ventricular epithelium and subsequent formation of ectopic neuronal nodules. FlnA-dependent regulation of cytoskeletal dynamics is thought to direct neural progenitor migration and proliferation. Here we show that embryonic FlnA-null mice exhibited a reduction in brain size and decline in neural progenitor numbers over time. The drop in the progenitor population was not attributable to cell death or changes in premature differentiation, but to prolonged cell cycle duration. Suppression of FlnA led to prolongation of the entire cell cycle length, principally in M phase. FlnA loss impaired degradation of cyclin B1-related proteins, thereby delaying the onset and progression through mitosis. We found that the cdk1 kinase Wee1 bound FlnA, demonstrated increased expression levels after loss of FlnA function, and was associated with increased phosphorylation of cdk1. Phosphorylation of cdk1 inhibited activation of the anaphase promoting complex degradation system, which was responsible for cyclin B1 degradation and progression through mitosis. Collectively, our results demonstrate a molecular mechanism whereby FlnA loss impaired G2 to M phase entry, leading to cell cycle prolongation, compromised neural progenitor proliferation, and reduced brain size.
Introduction
Neural progenitor proliferation and brain size are principally modulated by two major cell parameters, cell cycle length and early differentiation (Kintner, 2002; Cremisi et al., 2003; Dehay and Kennedy, 2007; Farkas and Huttner, 2008). In mouse brain, corticogenesis begins at embryonic day 11 (E11) and ends at E18 (Takahashi et al., 1995). During this period, neuroepithelial progenitors in the ventricular zone (VZ) go through ∼11 cell cycles, and in each cycle, a fraction of the progenitor population will differentiate into intermediate progenitors (referred to as basal progenitors) or directly exit the cell cycle to become postmitotic neurons (Takahashi et al., 1996). Therefore, an increase in premature neural progenitor differentiation can compromise the expansion of the neural progenitor pool, resulting in impaired neurogenesis, and subsequently microcephaly (Cremisi et al., 2003; Miyata et al., 2010). Conversely, cell cycle length can also impact the size of the progenitor pool (Ohnuma and Harris, 2003; Miyata et al., 2010). A prolonged cell cycle would synchronously inhibit the generation of both progenitors and neurons over a defined period of time, yielding fewer cortical neurons (Ohnuma and Harris, 2003). The precise interplay between cell cycle rate and the differentiating fraction of neural progenitors will direct neural progenitor proliferation, and finally determine brain size.
Neural progenitor progression through the various stages of the cell cycle [G1, synthesis (S), G2, and mitosis (M) phases, with postmitotic neurons exiting the cell cycle at G0] are mediated by cyclin-dependent kinases (cdks) and their activators, cyclin-related proteins (Murray and Kirschner, 1989; Leise and Mueller, 2002). For example, the cdk1/cyclin B1 (Ccnb1) complex is inactive before entry into the M phase because of Wee1/Pkmyt1 kinase-regulated cdk1 phosphorylation (Gould and Nurse, 1989). To enter M phase, progenitor cells activate cdk1/cyclin B1 through cdk1 dephosphorylation in part through degradation of Wee1-like kinases (Watanabe et al., 2004; Okamoto and Sagata, 2007). M-phase progression is further enhanced by the cdc25c phosphatase (Lew and Kornbluth, 1996). Cdk1 activation also enhances cyclin B1 degradation through activation of the anaphase promoting complex (APC) system, involving cdh1 and cdc20 (Rudner and Murray, 2000; Golan et al., 2002). As cells proceed into metaphase, APC-regulated cyclin B1 degradation begins to inhibit cdk1 activation (dephosphorylation) (Visintin et al., 1997). In an analogous fashion, cdk inhibitors, such as the cdk inhibitor p16, inhibit cdk4/6 interactions with cyclin D, thereby blocking the G1–S phase transition and possible exit from the cell cycle. Disruption of the cyclins, cyclin-dependent kinases, or components of the APC system can delay progression through the various cell cycle stages.
During human cortical development, mutations in the FLNA gene cause a malformation of cortical development, periventricular heterotopia (PH) (Fox et al., 1998; Sheen et al., 2005). PH is characterized by a disruption of neural progenitors along the ventricular neuroepithelium, leading to ectopic neuronal nodules along the lateral ventricles and reduced brain size. Cytoskeleton-related genes have been found to play a crucial role in controlling brain size (Bond et al., 2006). However, the underlying molecular mechanism whereby FLNA regulates neural progenitor development, giving rise to these neuropathological phenotypes, is not known.
Materials and Methods
Mice
The Dilp2 mouse strain was obtained from the Comparative and Developmental Genetics Department of the MRC Human Genetics Unit (Edinburgh UK). The Dilp2 strain has been submitted to the European Mouse Mutant Archive (http://www.emmanet.org/; strain number EM: 00387) (Hart et al., 2006). The Dilp2 mouse strain has a C3H/HeN background, and Dilp2 embryos usually die before E15.5. To prolong the survival period of FlnA-null embryos, we crossbred Dilp2 female mice with wild-type (WT) S129/Sv male mice, which permitted us to observe FlnA function at later ages. In the current work, we only characterized FlnA effect on brain development until E18 due to the limits on the survival period of FlnA-null embryos. FlnA function on progenitor proliferation might also influence neurogenesis after this time period of normal corticogenesis.
All mouse studies were performed under approval from the Institutional Animal Care and Use Committees of Harvard Medical School, Beth Israel Deaconess Medical Center, and Albany Medical College in accordance with the National Institutes of Health Guide for the Care and Use of Laboratory Animals.
BrdU labeling in vivo
BrdU (Roche) was dissolved in sterile PBS at a concentration of 6 mg/ml. BrdU injection was performed as described previously (Ferland et al., 2009). Briefly, for cumulative BrdU labeling, E14 pregnant mice were injected intraperitoneally with BrdU (60 mg/kg body weight) at 3 h intervals and killed at varied time points (2, 3, 6, 9, and 14 h) for mitotic index labeling. Other E14 pregnant mice were injected once with BrdU and killed at 1.5 and 2 h intervals. For analysis of proliferation and differentiation, E14.5 and E17 pregnant mice were injected once intraperitoneally with BrdU (100 mg/kg) and killed after a 24 h interval. For S-phase cell labeling, E15.5 pregnant mice were pulse labeled with BrdU for 20 min. All the embryos were removed and fixed in 4% paraformaldehyde and processed for BrdU immunohistochemistry as described previously (Ferland et al., 2009). Prior reports have suggested that BrdU may be cytotoxic and potentially affect mitogenesis, especially when administered at very high doses. However, under our experimental conditions, we did not observe the toxic effect of BrdU on cell growth, as seen by TUNEL staining (see Fig. 2). In addition, the in vitro assays were performed without BrdU labeling and also indicate that FlnA loss prolongs the duration of M phase in FlnA-null cells.
Figure 2.
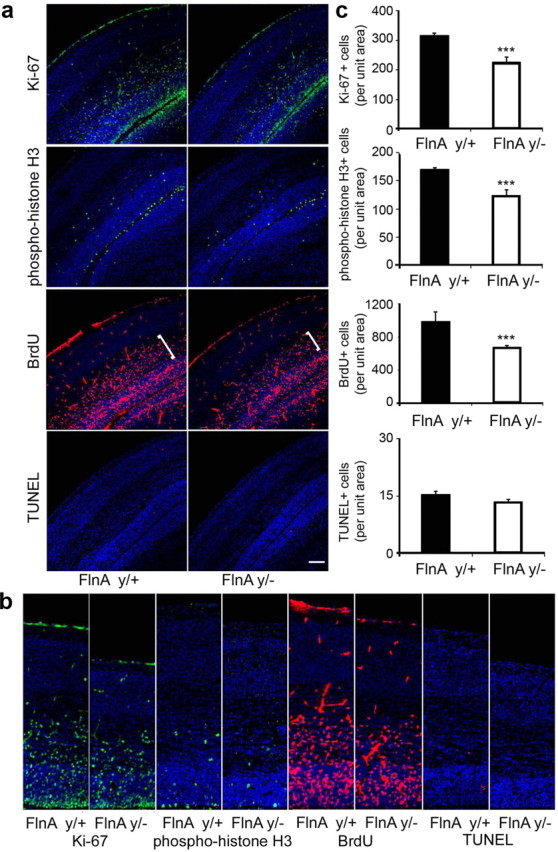
Reduction in the neural progenitor population with loss of FlnA function at embryonic day 18. a, Fluorescent photomicrographs of both E18 FlnAy/− and FlnAy/+ cortex after immunostaining for proliferation and apoptotic markers: Ki-67, a marker for cells in the cell cycle; PH3, an M-phase marker; BrdU, a marker labeling cells entering into S phase; and TUNEL staining, a marker for programmed cell death. Pregnant mice at E17 received a single injection of BrdU (100 mg/kg, i.p.) and were killed 24 h later. Frozen sections were cut at 12 μm and immunostained for expression of Ki-67 (fluorescein), PH3 (fluorescein), BrdU (rhodamine), and apoptotic cells (rhodamine). Scale bar: 100 μm. b, Higher-magnification photomicrographs of the images in a demonstrate the reduction in the number of cells labeled by the various proliferative markers in the FlnA mutant mice. c, Statistical analyses (n ≥ 3 independent samples per experiment) showed that the numbers of cells per unit area positively labeled for Ki-67, PH3, and BrdU in FlnAy/− cortex were decreased by 28.2, 25, and 31%, respectively, compared to littermate controls. No significant increase in TUNEL staining was seen in the FlnAy/− cortices. ***p < 0.001.
Cell culture
Neuronal progenitors were isolated from the E13.5 mouse embryo cortex as described previously (Sheen et al., 2006). Briefly, for neural progenitor isolation, E13.5 embryo cortices were microscopically dissected to separate the telencephalon from the basal ganglia. The tissue was triturated in HBSS buffer, digested at 37°C in Earle's balanced salt solution (EBSS) containing papain (20 units/ml; Worthington Biochemical) for 10–20 min. The undigested tissue chunks were allowed to settle for 2–5 min, and the suspended cells were filtered through a cell strainer (BD Falcon). Dissociated cells were then resuspended in knockout DMEM/F-12 medium, a neural progenitor culture medium (Invitrogen). For neural sphere growth, the cells were cultured in suspension in tissue culture flasks (BD Falcon, catalog #353108). M2 and A7 cell lines (a gift from Dr. T. Stossel, Brigham and Women's Hospital, Boston, MA) were cultured in minimum essential MEM medium supplemented with 2% FBS, 8% newborn calf serum, and 1% penicillin-streptomycin. In addition, G418 (final concentration, 500 μg/ml) was added to A7 cell culture medium to maintain FLNA expression (Cunningham et al., 1992).
For the assays involving cell proliferation or drug administration, the cells were plated on 5–10 μg/cm2 laminin I-coated (Trevigen, catalog #3400-010-01) 6 cm dishes at a density of 5 × 10⁴ cells/cm2. Neural progenitor doubling time was calculated by cell count. For flow cytometric analysis, neural progenitors were pulse labeled with BrdU (10 μm) for 40 min and then washed twice with HBSS and continued to culture in neural progenitor medium for varied time points. Cells were digested with trypsin, centrifuged, resuspended in HBSS, and then fixed with 4% PFA. For examination of cell cycle progression from G2/M to G1 phase, cultured neural progenitors were synchro-nized at G2/M phase by a treatment of 40 ng/ml nocodazole (Sigma-Aldrich, catalog #M1404) for 12–16 h and then released to continue cell cycle progression. At varied time points, cells were digested and fixed for flow cytometry or Western blot. For protein degradation studies, cultured neural progenitors were harvested for Western blot analyses after incubation in 100 μm cycloheximide (Sigma-Aldrich, catalog #C1988) for varying lengths of time.
Flow cytometry.
For BrdU-labeled neural progenitors, cell staining was performed according to manufacturer's protocols with minor modifications (FITC BrdU Flow Kit; BD PharMingen, catalog #559619). Briefly, PFA-fixed cells were treated with DNase I to expose BrdU epitopes and incubated with anti-BrdU antibody (1:100; Calbiochem, catalog #NA61) and Alexa Fluor 488 secondary antibody (1:300); total DNA was stained with 7-aminoactinomycin D (7-AAD). The flow cytometry experiments were performed using a SORP LSRII laser.
For propidium iodide (PI) staining, cells were resuspended in HBSS and fixed by gently dropping them into cold 100% ethanol (−20°C). The cells were centrifuged and resuspended in 0.5 ml of DNA staining solution (50 μg/ml PI and 0.5 mg/ml RNase A in PBS). FACS analysis was performed using a SORP LSRII laser.
Tissue and cell processing for immunohistochemistry and immunocytochemistry.
Timed murine embryos (E14.5, E15.5, and E18) were harvested from pregnant dams according to Institutional Animal Care and Use Committee guidelines. Processing of tissue for preparation of frozen and paraffin sections and routine histological staining was performed according to procedures described previously (Ferland et al., 2006, 2009). For immunohistochemistry, sections were blocked in PBS containing 5% donkey serum and then incubated overnight using the appropriate primary antibodies. For FlnA staining, paraffin sections were stained by rabbit anti-FLNA monoclonal antibody (1:300; Epitomics, catalog #2242-1). For BrdU staining, tissue sections were retrieved by heating at 95–100°C in citrate buffer for 15–20 min and then quickly put into ambient distilled water to denature the DNA, or alternate sections were slowly cooled and treated with DNase I to cleave chromosomal DNA. The following antibodies with corresponding dilutions were used for the studies: mouse anti-BrdU (1:100; Calbiochem) and rat anti-BrdU (1:150; Serotec, catalog #MCA2060), rabbit anti-Ki-67 monoclonal antibody (1:200; Epitomics, catalog #4203-1), rabbit anti-phosphohistone H3 (PH3) polyclonal antibody (1:250; Millipore, catalog #06-570), rabbit anti-Sox2 (1:250; Epitomics, catalog #2683-1), mouse anti-Reelin (1:50; Developmental Studies Hybridoma Bank, catalog #R4B), mouse anti-chondroitin sulfate proteoglycan (CSPG; 1:200; Sigma-Aldrich, catalog #c8035), rabbit anti-Tbr-1 and anti-Tbr-2 (1:150; Abcam, catalog #ab31940, #ab23345), mouse anti-actin (1:100; Santa Cruz Biotechnology, catalog #sc-47778), mouse anti-β-catenin and anti-N-cadherin (1:100; BD Biosciences, catalog #c19220 and #610920, respectively), and mouse monoclonal antibody against phospho-FLNA (ser2152; 1:150; a kind gift from F. Nakamura, Brigham and Women's Hospital, Boston, MA). Following incubation in primary antibody, tissue sections were washed and treated with the appropriate secondary antibodies for 2 h. The following secondary antibodies were used: Dylight 488 and Dylight 594 donkey anti-mouse antibodies (1:200), and dye 488 and dye 594 donkey anti-rabbit antibodies (1:200) from Jackson ImmunoResearch. For F-actin staining, Alexa Fluor 488 or rhodamine-labeled phalloidin was used on frozen sections (dissolved in 1.5 ml methanol; 1:50; Invitrogen, catalog #A12379 and #R415). Fluorescent microscopy images were obtained using the Olympus AX70 microscope with a SNAP microphotographic system. Confocal images were obtained using a Zeiss LSM 510.
For cellular staining of FlnA, Wee1, Pkmyt1, cdc25c, and cyclin B1, cells were fixed using ice-cold 10% (w/v) trichloroaectic acid for 20 min, washed more than three times using PBS, and permeabilized by 0.2% Triton X-100 (Yonemura et al., 2004). For other antibody staining, cells were fixed by 4% PFA and permeabilized with Triton X-100. Cell staining procedure was the same as that used in tissue staining. The following antibodies were used for cell staining: rabbit anti-FLNA (1:250; Epitomics, catalog #2242-1), mouse anti-FLNA (1:100; Santa Cruz Biotechnology, catalog #sc-58764), mouse and rabbit anti-Wee1 (1:50; Santa Cruz Biotechnology, catalog #sc-5285 and #sc-325), rabbit anti-Pkmyt1 (1:100; Epitomics, catalog #3303-1), mouse anti-aurora b (AIM-1; 1:100; BD Biosciences, catalog #611082), mouse and rabbit anti-cyclin B1 (1:100; Santa Cruz Biotechnology, catalog #sc-245 and #sc-752), and mouse and rabbit anti-cdc25c (1:100; Santa Cruz Biotechnology, catalog #sc-55513 and #sc-327). Secondary antibodies were the same as above for tissue staining.
Endogenous coimmunoprecipitation and Western blot analyses.
For coimmunoprecipitation (co-IP), neural progenitor cells were grown to 70–80% confluence on laminin-coated dishes and synchronized by nocodazole treatment. Cells were lysed in a coimmunoprecipitation buffer containing 50 mm Tris-HCl, pH7.4, 150 mm NaCl, 1% Triton X-100, 1 mm Na3VO4, 2 mm EDTA, 1 mm PMSF, phosphatase inhibitor cocktail 3 (Sigma-Aldrich, catalog #p0044), and proteinase-inhibitor cocktail (Sigma-Aldrich, catalog #p8340). Cell lysates were centrifuged at 132,000 rpm for 15 min, and the supernatants were incubated at 4°C with 8 μg of protein A/G bead-coupled anti-Wee1 (Santa Cruz Biotechnology, catalog #sc-5285), cyclin B1 (Santa Cruz Biotechnology, catalog #sc-245), or anti-pan 14-3-3 (Santa Cruz Biotechnology, catalog #sc-629) antibodies for 3 h. The beads were centrifuged at 3000 rpm for 1 min and washed with co-IP buffer three times. Beads were boiled in SDS-PAGE sample loading buffer for Western blot analyses. For co-IP, A7 melanoma cells were cultured to 70–80% confluence and then synchronized by nocodazole treatment. Cells were lysed as above, and the supernatants were incubated with protein A/G bead-coupled anti-FLNA (Santa Cruz Biotechnology, catalog #sc-58764), anti-Wee1, or anti-pan 14-3-3 antibodies.
For Western blot experiments, protein samples were loaded onto 8–12% SDS-PAGE gels for electrophoresis and transferred onto PVDF membrane (Bio-Rad, catalog #162-0177). Membranes were incubated with primary antibodies overnight at 4°C, and with HRP-conjugated secondary antibodies (1:3000; Jackson ImmunoResearch) for 2 h. Signals were detected using LumiGOLD ECL detection kit (Signagen Laboratories, catalog #SL100309). The following primary antibodies were used: α-tubulin (1:2000; Santa Cruz Biotechnology, catalog #32293), integrin β1 (1:1000, BD Biosciences, catalog #610467), FLNA (1:10,000; Epitomics, catalog #2242-1), FLNA (1:1000; Santa Cruz Biotechnology, catalog #sc-58764), PH3 (1:2000; same as above for immunostaining), cdc20 (1:500; Santa Cruz Biotechnology, catalog #sc-8385, #sc-13162), cdh1 (1:500; Santa Cruz Biotechnology, catalog #sc-56312), cyclin B1 (1:500, same as above), cdk1(1:1000, Calbiochem, pc25), phospho-cdk1 (pY-15; 1:500; BD Biosciences, catalog #612306), Wee1 (1:500; same as above), cdc25c (1:500; Santa Cruz Biotechnology, catalog #sc-327, #sc-55513), cdc25c (1:500; Epitomics, catalog #1302), and Pkymt1 (1:1000; Epitomics, catalog #3303).
Pull-down assay.
FLNA c-terminal (amino acids 2167-2647; protein code P21333 on the NCBI website) was inserted into the prokaryotic expression vector pGEX-6p-3 through restriction enzymatic digestion. GST-FLNA-C protein was expressed in BL21 bacteria and purified through GSH-Sepharose 4B beads (GE Healthcare, catalog #17-0756-01). Endogenous Wee1 was pulled down through incubation of purified GST-FLNA-C with A7 cell supernatants.
TUNEL staining.
Cell death was detected by TUNEL staining (In Situ Cell Death Detection Kit; Roche, catalog #12156792910). The procedures followed the manufacturer's protocol.
Quantitative analysis.
To quantify the number of positively labeled cells on serial tissue sections, cell number was quantified using ImageJ software (NIH). Three coronal sections of one FlnA-null brain were compared to three homotopic sections of one FlnA-WT brain in the same litter. A total of more than four sets of experimental and control E18 embryonic brains were used for analyses (i.e., four or more FlnA-WT brains and four or more FlnA-null brains), and three sets of E15.5 embryo brains. Data are represented as the mean ± SD (n ≥ 4 for E18, and n = 3 for E15.5) for BrdU, Ki-67, PH3, Tbr-1, Tbr-2, and Sox2. The p values were calculated using Excel software. Significance was determined using a paired Student's t test.
Cortex thickness was measured from digitized images using imaging software (Adobe Photoshop). The thickness of FlnA-null brain cortex was reported as a value relative to that of FlnA-WT brain cortex. Mean values, SDs, and t tests (p value) were calculated using Excel software.
To quantify Western blot results, the band intensity for a given sample was digitized and quantified using ImageJ (NIH) software. More than three replicates were performed for each set of experiments. For temporal studies, the intensity of bands at time 0 was arbitrarily set as 100, and the intensity values of other bands at other time points are reported as relative value to that the zero time-point measurement.
Results
Loss of FlnA function leads to microcephaly in embryonic mice
While FlnA has been proposed to affect corticogenesis, the underlying pathological mechanisms have not been explored. We therefore characterized the embryonic development of C3H/HeN × S129/SV Dilp2 mice. These mutant mice harbor a T-to-A point mutation in the FlnA gene, leading to a stop codon in exon 46, nonsense-mediated decay of the FlnA mRNA, and undetectable FlnA protein levels using either N- (domain 4) or C-terminal (last domain) FlnA antibodies (data available when required), consistent with prior reports (Hart et al., 2006) The FlnAy/− embryos displayed a smaller physical body size compared to age-matched WT controls (Fig. 1a), developed midline omphalocoeles, and were embryonic lethal after E18. FlnAy/− brain size was also reduced both in the rostral–caudal extent and in the width of the telencephalon (Fig. 1b), and the cortex was significantly thinned at E15.5 (9% reduction) and E18 (15% reduction) compared to FlnAy/+ brain (Fig. 1c,d). At higher magnification, loss of cortical width was most prominent in the cortical plate (Fig. 1d). FlnA was highly expressed in the ventricular and subventricular zones (SVZ) of the cerebral cortex, regions populated by proliferating neural progenitors during mid-gestation (Fig. 1e), whereas FlnA expression was reduced in the upper cortical layers, where postmigratory neurons were situated. The phenotype of smaller brains and loss of cortical width in FlnAy/− embryos, as well as prominent FlnA expression along the VZ/SVZ, suggested that FlnA might play a functional role in regulating progenitor pool size during cortical development.
Figure 1.
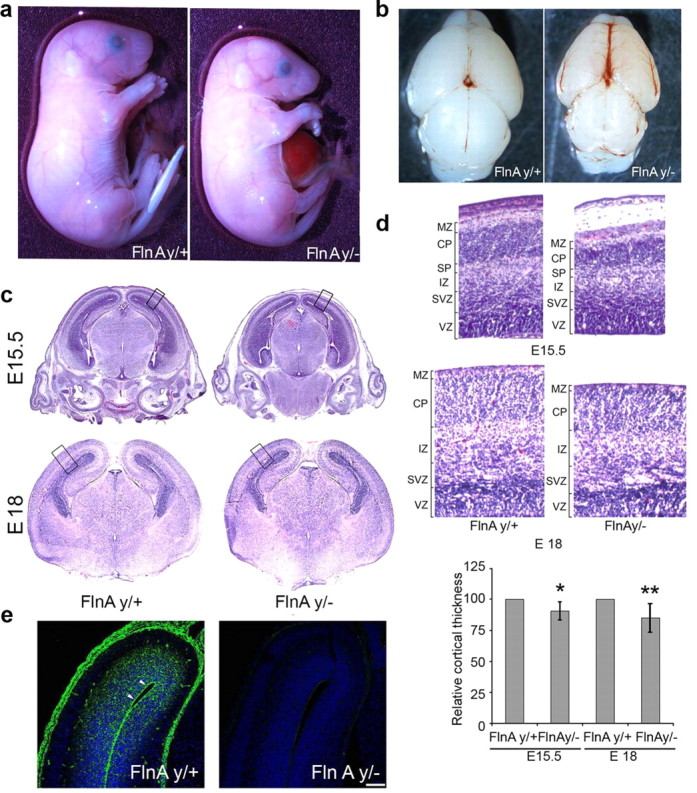
FlnAy/− mice display mild microcephaly, omphalocele formation, and an overall reduction in body size. a, E18 FlnAy/− whole embryo with a smaller body size and a midline closure defect with omphalocele compared to littermate FlnAy/+ embryos. b, A reduction in brain size and disruption of the vasculature can also be appreciated in the FlnAy/− brain. c, Photomicrographs of hematoxylin and eosin-stained coronal sections from various aged embryonic mouse brains show a reduction in cortical width in the FlnAy/− telencephalon compared to littermate control. d, Higher magnification of the outlined area in c shows that the greatest differences in thickness are observed in the cortical plate. Quantification with statistical analysis is shown graphically below, with the thickness of FlnAy/− cortices reduced by 9 and 15%, respectively, at E15.5 and E18 compared to FlnAy/+ littermate controls (n > 3). e, Fluorescent photomicrographs of cortex following FlnA immunohistochemistry on paraffin-embedded E15.5 brain sections show that FlnA (fluorescein fluorescence) is highly expressed in the ventricular and subventricular zones, primarily along the apical surface of the ventricles (arrowhead). In contrast, no FlnA staining is seen in FlnAy/− cortex. Sections are counterstained with the Hoechst nuclear marker (DAPI). Scale bar: 100 μm. MZ, Marginal zone; CP, cortical plate; SP, subplate. *p < 0.05; **p < 0.01.
Decreased neural progenitor pool size in embryonic FlnAy/− mice
To address whether the reduction in brain size was due to altered progenitor development, we used markers for cell proliferation as surrogates for determining the progenitor pool size (Figs. 2, 3). The Ki-67 antigen labels all cells in the cell cycle (G1, S, G2, and M phases), but not those exiting the cycle, such as differentiated progenitors and newly born neurons. The number of Ki-67-positive neural progenitors was significantly decreased by 28.2 and 13.4% in E18 (Fig. 2) and E15.5 (Fig. 3) FlnAy/− cortices, respectively, compared to WT controls (n > 3; p < 0.01 and p < 0.001, respectively). Moreover, fewer Ki67+ progenitors were seen both in the VZ as well as the intermediate zone (IZ) where secondary progenitors reside. We similarly observed a decline in progenitor numbers along the ventricular lining, as evidenced by PH3 staining, an M-phase marker. The E18 (Fig. 2) and E15.5 (Fig. 3) FlnAy/− cortices showed 25 and 9.2% declines, respectively, in the number of PH3+ progenitors compared to WT controls (n > 3; p < 0.05 and p < 0.001, respectively). Furthermore, pulsing with the thymidine analog, BrdU, captured progenitors entering S phase. Loss of FlnA resulted in 31 and 15% decreases in the BrdU+ cell number, respectively, in E18 and E15.5 cortices 24 h after BrdU pulse labeling (n > 3; p < 0.01 and p < 0.001, respectively). Again, fewer progenitors were seen in both the VZ/SVZ and IZ (white brackets). Finally, the diminished brain size in the FlnAy/− mice was not the result of increased cell death, as evidenced by the absence of any significant increase in TUNEL staining in comparison of FlnAy/− to FlnAy/+ cortices of E18 and E15.5 brains. Summarily, our data indicated that the reduction in brain size seen with loss of FlnA was due, in part, to a decline in the progenitor pool.
Figure 3.
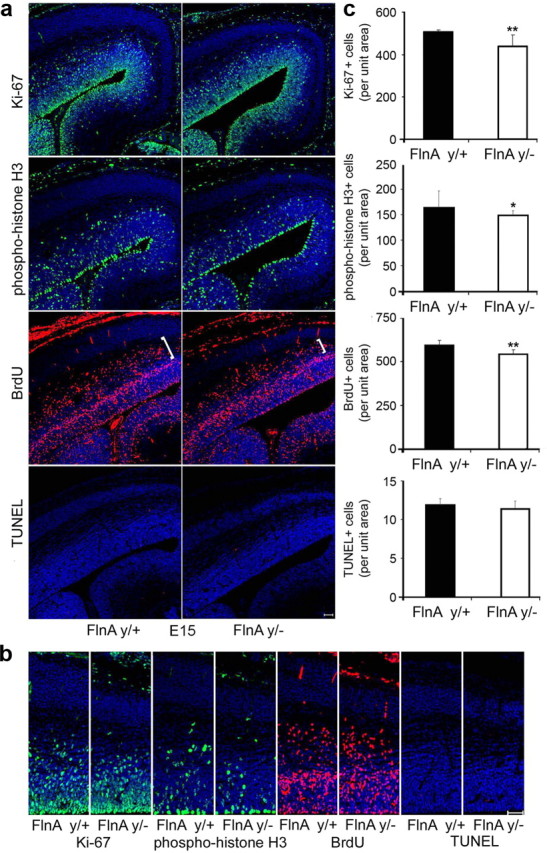
Early decline in the neural progenitor population in E15.5 FlnAy/− cortex. a, Fluorescent photomicrographs of E15.5 cortex. E15.5 FlnAy/− embryos exhibited a similar decrease (albeit less significant) in the number of proliferating progenitors by Ki-67, PH3, and BrdU labeling. E14.5 pregnant mice were pulse labeled with BrdU for 24 h. Immunostaining was performed with anti-Ki-67 (proliferative marker), PH3 (M-phase marker), and/or BrdU (S-phase marker), and positively stained cells were visualized under fluorescent microscopy and quantified by comparison between serial littermate FlnAy/+ and FlnAy/− cortical sections. b, Higher magnification photomicrographs of the images in a demonstrated the reduction in the number of cells labeled by the various proliferative markers in the FlnA mutant mice. Scale bars: A, 100 μm; B, 50 μm. c, Quantification of the staining and statistical results were shown for n = 3 samples per variable. *p < 0.05; **p < 0.01.
FlnA-dependent defects in progenitor pool size are not a result of an increased differentiation of neural progenitors
During the development of the cerebral cortex, neural progenitors undergo both self-duplication and neuronal differentiation. The balance between these processes regulates neural progenitors' proliferation and brain size. To explore a possible role for FlnA in cell fate specification, we first quantified the number of neural cells expressing several layer-specific markers relative to the number of Sox2+ progenitor cells in E15 and E18 FlnAy/− and FlnAy/+ cortices. If early onset differentiation increased, earlier-formed layers (subplate/preplate, marginal zone, or deep cortical layer neurons) would be expected to be increased in width compared to later-formed superficial cortical layers, composed of later-born neurons. The reelin antigen labels Cajal–Retzius neurons in the marginal zone, whereas CSPG is found in subplate and intermediate neurons. A slight decrease in the layer thickness for both early markers was seen in the FlnAy/− brain, suggesting that FlnA loss might actually lead to a reduction in early differentiation of neural progenitors (Fig. 4a). We next examined two additional layer markers: Tbr-2, a differentiating intermediate progenitor marker, and Tbr-1, a marker of earlier-born neurons located in deeper layers of the cortical plate. The number of Tbr-2-positive cells relative to the number of Sox2-positive progenitors was reduced by 4.2% in the FlnAy/− E18 cortex compared to WT control (Fig. 4b–d). Likewise, the number of Tbr-1-positive cells relative to the number of Sox2-positive progenitors was decreased by 5.5% in FlnAy/− cortex compared to FlnAy/+ cortex. These results would further imply that loss of FlnA resulted in a decrease in progenitor differentiation.
Figure 4.
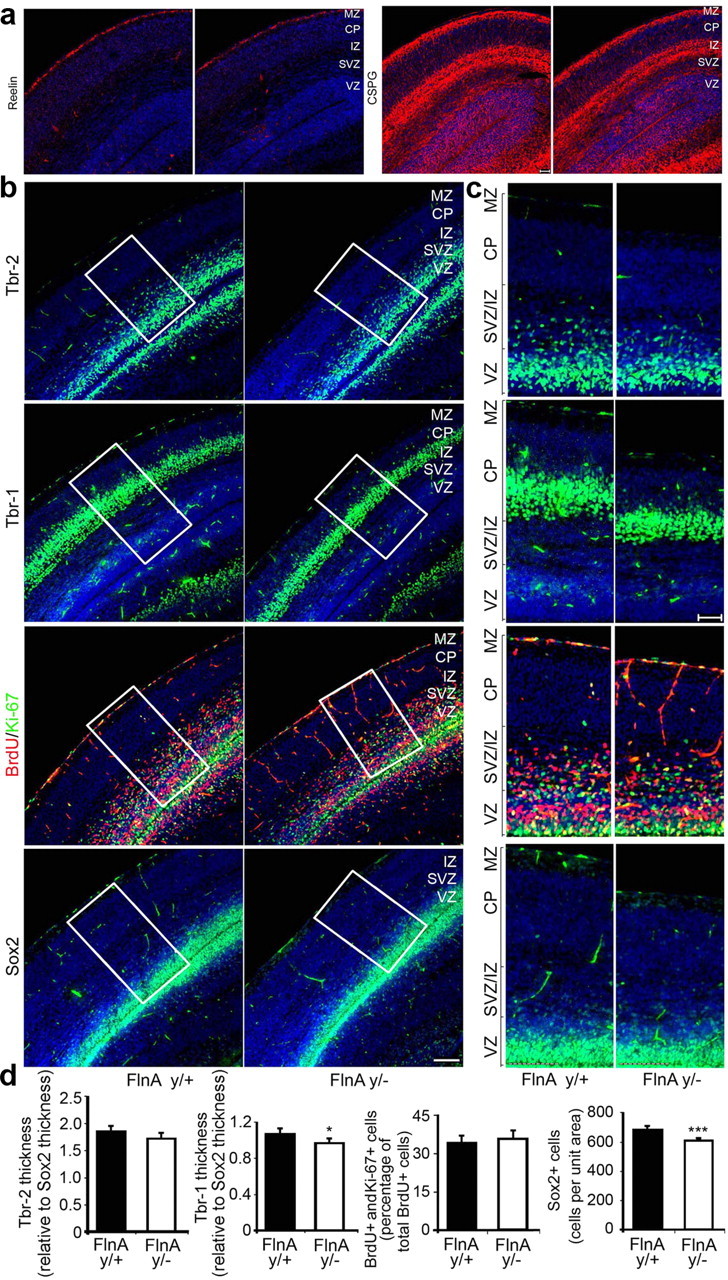
Diminished brain size in null FlnA mice is not due to an increase in neural differentiation. a, Relative rates of proliferation and differentiation of neural progenitors destined for both upper and lower cortical layers (corresponding to earlier and later born neurons, respectively) were identified after immunostaining of E18 brain sections with reelin and CSPG. Reelin served as a marker for the superficial marginal zone (molecular layer), whereas CSPG labeled both subplate and intermediate zone neurons. Staining for either of these markers was reduced or unchanged in the FlnAy/− cortex, suggesting no increase in early differentiation. b, Immunostaining for Tbr-2 (fluorescein, top), a differentiating progenitor marker, and Tbr-1 (fluorescein, second row), an earlier born neuronal marker, indicates a decrease in the width of the cortical layers and therefore decreases in the number of earlier born neurons in the FlnAy/− cortex compared to WT. Costaining for Ki-67 (fluorescein) and BrdU (rhodamine) demonstrated an increase of ∼3% in the relative number of proliferating progenitors in the FlnAy/− brain, consistent with a decreased rate of differentiation; immunostaining of Sox2 (fluorescein, fourth row), a progenitor marker, indicates a declination of neural progenitor amount in FlnAy/− cortex. c, Higher-magnification photomicrographs of the images in b demonstrated the reduction in the staining of the various differentiation markers. d, Quantification of the images is shown below. Statistical analyses were performed on serial sections from n > 3 brains per experimental variable and demonstrated a decrease in labeled cells per unit area (relative to the number of Sox2-positive cells) by 5.5 and 4.2%, respectively, for Tbr-1and Tbr-2. The number of Sox2 progenitors was also decreased by ∼10% in the FlnAy/− cortex compared to control. Sections were counterstained with nuclear Hoechst (DAPI). MZ, Marginal zone; CP, cortical plate; SP, subplate. Scale bars: b, 100 μm; c, 50 μm. *p < 0.05; ***p < 0.001.
Another measure of proliferation versus differentiation can be made through dual labeling studies using Ki-67 and BrdU (Fig. 4b–d). Pulsed injection of BrdU labels progenitors undergoing cell division at a particular instance in time. Secondary labeling with Ki-67 at 24 h after BrdU injection captures a subset of BrdU+ cells that remain progenitors, as opposed to the Ki-67− and BrdU+ cells that have exited the cell cycle and adopted postmitotic neuronal fates. We observed fewer BrdU+ progenitors situated above the ventricular zone (Figs. 2, 3, brackets referring to the intermediate zone) in FlnAy/− cortex compared to FlnAy/+ cortex, suggestive of slower or delayed differentiation. Additionally, a greater proportion of BrdU+ and Ki-67+ labeled cells were seen in the FlnAy/− mice (37 vs 34% in FlnAy/− E18 brain; n > 3; p < 0.05 and p < 0.01, respectively), indicating again a decline in differentiation. Finally, costaining with Tuj1, a neuronal marker, revealed an increased proportion of Tuj1 to Sox2 cells in the FlnAy/− cortices compared to WT (data available when required). These findings also indicated that early differentiation was not the cause of the reduction in proliferation observed above in FlnAy/− mice. Similar, albeit less pronounced, changes were seen in the analysis of the E15.5 FlnAy/− cortex (data available when required). Together, the decline in progenitor pool numbers, due to loss of FlnA, was not derived from a premature-onset differentiation of neural progenitors.
Loss of FlnA prolongs cell cycle progression and delays G2/M to G1 phase transition
One possible mechanism that could account for the reduction in neural progenitor numbers would be a role for FlnA in regulating the cell cycle. Given that phenotypic changes due to loss of FlnA might not be apparent until later in development (i.e., E15.5 and E18), we performed in vivo pulse BrdU labeling for 1.5 and 2 h and cumulative BrdU labeling for 2, 3, 9, and 14 h in E14 embryos to analyze loss of FlnA effects on the cell cycle (Fig. 5). The percentage of BrdU+ cells with respect to the total number of cells in the ventricular zone [labeling index (LI); the maximal LI is 1 when all the cells are BrdU positive] was quantified by counting the number of BrdU+ cells in a defined region of mediodorsal frontal cortex. Similar to the control data reported previously (Takahashi et al., 1993), the LI in FlnAy/+ cortices was 0.42 ± 0.01, 0.46 ± 0.02, 0.85 ± 0.015, and 0.97 ± 0.01, respectively, for 2, 3, 9, and 14 h cumulative BrdU labeling (Fig. 5). In contrast, LI in FlnAy/− cortex was significantly reduced to 0.43 ± 0.02 and 0.75 ± 0.025, respectively, for 3 and 9 h BrdU labeling, but was unchanged for 2 and 14 h cumulative labeling (Fig. 5). A linear fit plot of the LI as a function of labeling time allowed for determination of the duration for each cell cycle phase. By 14 h, the number of BrdU+ cells in either WT or mutant mouse had reached a maximal plateau. From the plot, Tc (the whole cell cycle length) minus Ts (S-phase length) corresponded to the minimal time necessary to reach the maximal LI (10.8 h for FlnAy/+ cells vs 12.9 h for FlnAy/− cells). Ts could be determined from the relative ratio of the LI for Ts versus Tc (Ts/Tc = 0.28/Growth Fraction). Thus, FlnA loss caused an increase of the whole cell cycle length Tc to 17.9 h vs 15.1 h in WT, and an increase in S-phase length Ts to 5 h (FlnAy/−), compared to 4.3 h in WT. TG2+M (the length of G2 and M phases) was measured from the minimum time required for all mitotic cells (PH3+) along the ventricular surface to become BrdU labeled. After a 1.5 h interval, 74 and 68% of PH3+ cells were BrdU labeled along the FlnAy/+ and FlnAy/− ventricular surfaces, respectively (Fig. 5, BrdU/PH3 staining). By 2 h, the mitotic labeling index increased to 98 ± 2% for FlnAy/+ cells and to 90 ± 2% for FlnAy/− cells. Therefore, for FlnAy/+ mitotic cells, the maximal LI was achieved within 2 h (TG2+M for WT), whereas the time interval for the maximal LI was interpolated to be 2.3 h (TG2+M) for FlnAy/− mitotic cells, assuming a linear rate of LI ascent after 2 h. TG1 (G1-phase length) could be calculated by TG1 = Tc − Ts − TG2+M and became 10.6 h in null FlnA mice, compared to 8.8 h for WT mice. Finally, M-phase length was estimated by Tc times the ratio of M-phase cells to total cells in the ventricular zone (Fig. 5, PH3 staining). For FlnAy/+ PH3+ cells, the ratio was 0.043 ± 0.004, giving an M-phase length of 40 min (TM = 0.66 h). In contrast, the ratio for FlnAy/− PH3+ cells was 0.063 ± 0.005, and so M-phase length was 66 min (TM = 1.1 h). G2-phase length became 1.2 h in FlnAy/− mice, as opposed to 1.34 h in WT mice. The duration of each phase of the cell cycle (TC, TG1, TS, TG2+M, TG2, and TM) lengths is summarized in Table 1. It is noteworthy that loss of FlnA affected every phase length in the cell cycle with the most significant changes arising in M-phase and G1-phase lengths, with 66 and 20% increases, respectively. Therefore, loss of FlnA function led to a prolonged cell cycle, resulting in an overall reduction in the number of progenitors generated.
Figure 5.
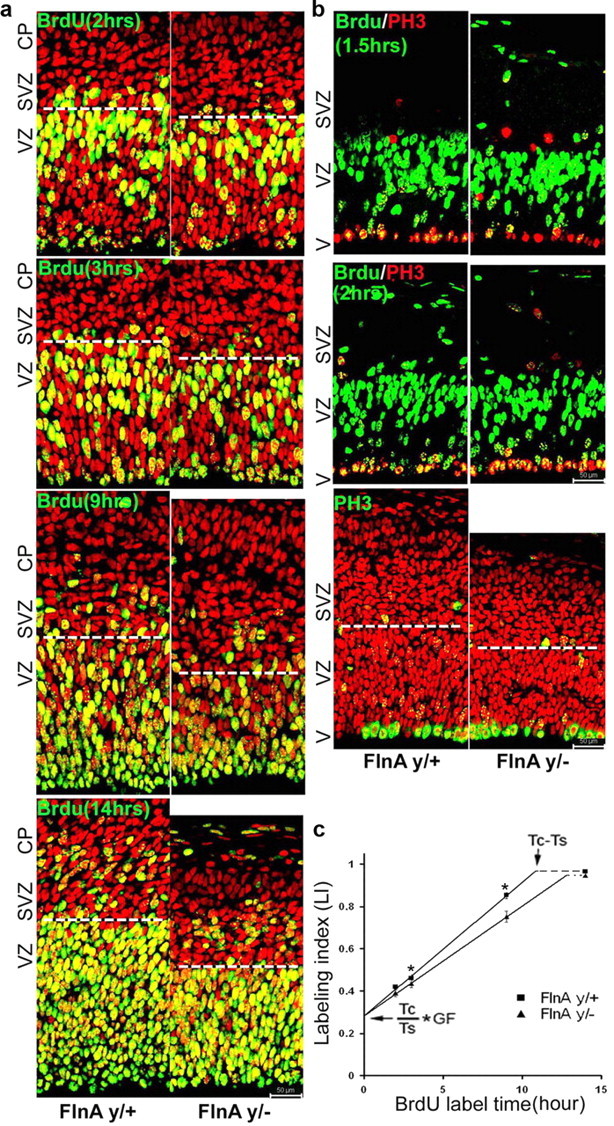
FlnA loss causes a prolongation of cell cycle length in vivo. a, Cumulative BrdU labeling estimates the time required for neural progenitors in the VZ to complete each phase of the cell cycle. With loss of FlnA function, fewer progenitors incorporated BrdU at 3 and 9 h, consistent with an overall prolongation of the cell cycle. By 14 h, virtually all VZ progenitors were labeled in both mutant and WT mice. b, Costaining for PH3 at various times after BrdU labeling enabled determination of the time required to complete G2 to M phase (TG2+M, when all PH3+ cells were BrdU positive). Mitotic BrdU labeling indexes were calculated from the proportion of BrdU+ and PH3+ nuclei to total PH3+ nuclei along the ventricular surface. The ratio of M-phase cells to the total cells in ventricular zone was measured by direct cell count. Scale bars: b (for a, b), 50 μm. c, The labeling index, obtained from the cumulative BrdU experiments, allowed for determination of the entire cell cycle length (Tc), as well as time required to complete S phase (Ts). Time to complete M phase (TM) was estimated by taking the ratio of cells along the ventricular lining, compared to the total number of progenitors within the VZ. V, Ventricle; CP, cortical plate. Based on the labeling index at each time interval, BrdU labeling curves for FlnAy/+ (■) and FlnAy/− (▴) neural progenitors were developed by linear fit. *p < 0.05.
Table 1.
Summary of cell cycle length changes due to loss of FlnA function
| Tc | TG1 | TS | TG2+M | TG2 | TM | |
|---|---|---|---|---|---|---|
| FlnA y/+ | 15.1 | 8.8 | 4.3 | 2.0 | 1.34 | 0.66 |
| FlnA y/− | 17.9 | 10.6 | 5.0 | 2.3 | 1.2 | 1.1 |
Time is counted in hours.
The cell cycle analyses in vivo prompted us to further characterize FlnA function and regulation of cell cycle in vitro. Consistent with the impaired proliferation seen in vivo, the doubling time of cultured E13.5 FlnAy/− neural progenitors was prolonged by >25% compared to that of FlnAy/+ progenitors (12.7 h for FlnAy/+ cells vs 16.9 h for FlnAy/− cells) (Fig. 6a,b). To better characterize the effects of FlnA suppression that were observed on cell cycle transitions from S phase to G1 phase, we again pulse labeled progenitors with BrdU for 40 min and used flow cytometry to examine progression through phases of the cell cycle (Fig. 6c, 0 h). Slower cell cycle progression from S phase to G1 phase was seen in the FlnAy/− progenitor population (Fig. 6c, arrow). Given the above in vivo results (Table 1), we suspected that the slower S-G2/M-G1 phase transition of FlnAy/− progenitor might be due to an M-phase delay. We therefore synchronized the neural progenitors to the G2/M phase by nocodazole treatment and observed the cell cycle progression after nocodazole release by flow cytometry (Fig. 6d). More than 40% FlnAy/+ progenitors passed through M phase to G1 phase within 1.5 h, compared to <20% of the FlnAy/− progenitors (n > 3, p ≤ 0.001). The cell cycle progression of FlnAy/− progenitors was still delayed after 8 h (Fig. 6d). Overall, these findings indicated that the neural progenitor proliferation defects seen following FlnA inhibition arose from a defect in cell cycle progression, principally from G2/M to G1 phase transition and secondarily from G1 phase.
Figure 6.
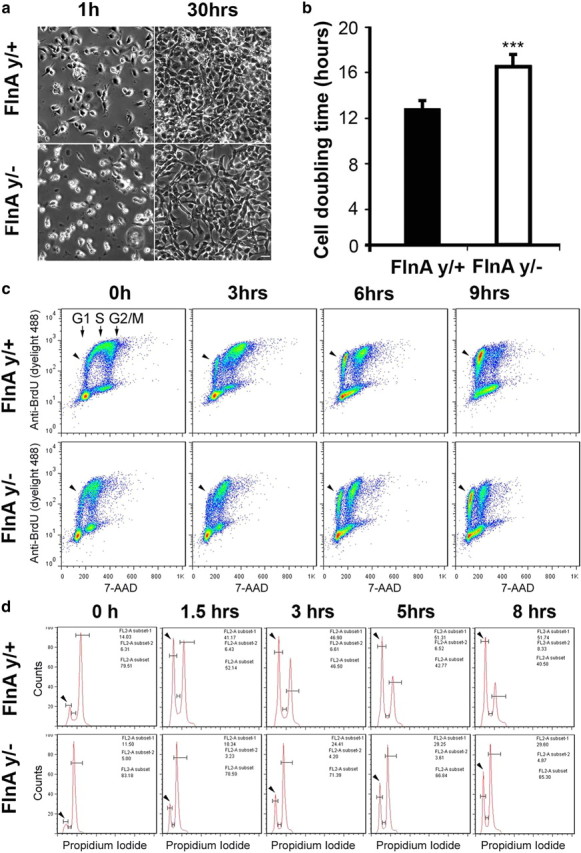
FlnA regulates cell cycle progression from G2 to M phase. a, FlnAy/− progenitors underwent a slower rate of growth as visualized with phase contrast microscopy. Neural progenitors from E13.5 brain cortex were plated on laminin-coated dishes at a cell density of 5 × 10⁴ cells/cm2. FlnAy/+ progenitor cells grew to confluency within 30 h after plating, whereas FlnAy/− progenitor cells achieved only 70–80% confluency during the same time interval and under the same culture conditions. Scale bar, 50 μm. b, Quantification to the right indicates a 25% decrease in the proliferation rate for FlnAy/− neural progenitors compared to progenitors isolated from littermate controls (n ≥ 3 independent samples per variable; ***p < 0.001). c, Flow cytometric analyses demonstrated a faster cell cycle progression from S to G1 phase in FlnAy/+progenitors. The cell cycle of BrdU-labeled progenitors progresses from S to G1 phase (arrowheads) for varied culture time post BrdU pulse. Cultured progenitor cells were pulse labeled with BrdU for 40 min and fixed at various time points after pulse. The fixed cells were stained with anti-BrdU antibody and 7-AAD, a fluorescent dye for DNA. d, Flow cytometric analyses showed that FlnAy/+progenitors underwent a faster cell cycle progression from G2/M (second unlabeled peak to the right) to G1 (arrowheads) phase. Cultured neural progenitors were synchronized to G2/M phase by nocodazole treatment and then released from nocodazole to allow cycle progression. The cells were harvested at various time points and stained with PI. Sample flow cytometry results were shown for n > 3 replicates (p < 0.001).
FlnA regulates cyclin B1 degradation through cdk1 Tyr15 phosphorylation in neural progenitors
To transition through the various phases of mitosis, neural progenitors entering metaphase must first inactivate cdk1 (through phosphorylation of cdk1) to initiate degradation of cyclin B1 through the APC system. Progression from metaphase to anaphase and anaphase to G1 is regulated by activators of the APC, cdh1 and cdc20. To address whether FlnA regulated cyclin B1 levels, we first examined the temporal course of cyclin B1 expression in both FlnAy/+ and FlnAy/− progenitors after nocodazole synchronization (time 0 corresponding to G2/M entry phase). Cyclin B1 levels rapidly declined in FlnAy/+ cells as mitosis progressed over a 180 min time period, but the decline was significantly slower in the FlnAy/− cells (Fig. 7a). Both cdh1 and cdc20, which promoted cyclin B1 degradation through the APC system, however, also underwent significantly slower rates of clearance in the FlnAy/− progenitors compared to FlnAy/+ cells. To determine whether the slower rates of decline in the levels of expression for these proteins in FlnAy/− progenitors were due to impairments in protein degradation or increased protein synthesis, we examined the expression levels of cyclin B1 and cdc20 after addition of the protein synthesis inhibitor, cyclohexamide (Fig. 7b). Similar to the results from the nocodazole treatment studies, both proteins exhibited increased expression levels in the FlnAy/− progenitors compared to WT cells over time, indicating a disruption in the clearance of these cell cycle proteins. Cdc20 and cdh1 promote cyclin B1 degradation through the APC system. The expression levels of these APC regulators were actually increased but not decreased in FlnAy/− neural progenitors (Fig. 7c), suggesting that the impaired rate of cyclin B1 degradation was not attributable to either of these proteins, and more likely another molecule in the APC system.
Figure 7.
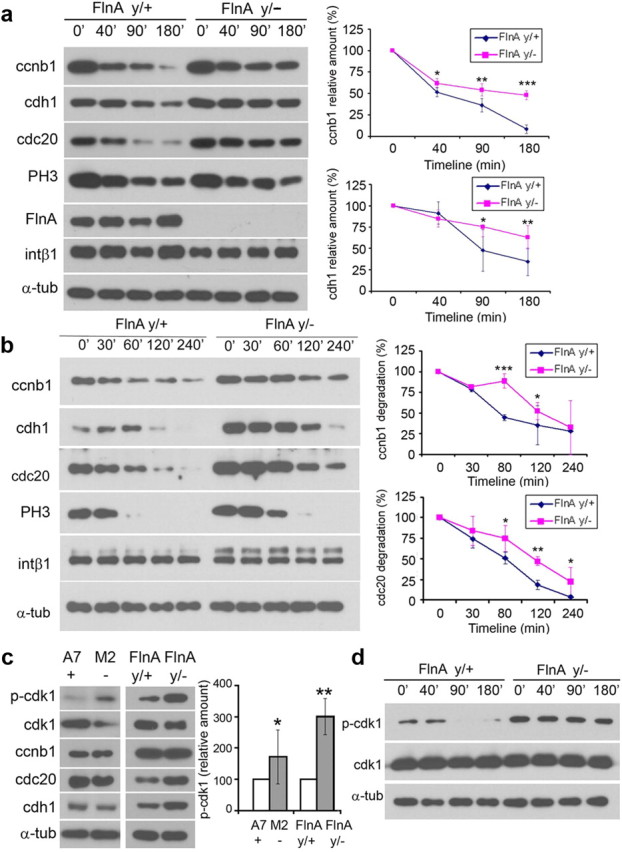
FlnA impairs cyclin B degradation and inhibits cdk1 phosphorylation. a, Expression of cyclin B1 and cyclin B1-associated proteins was prolonged in FlnAy/− progenitors during the transition from G2/M to G1. In FlnAy/+ cells, protein levels of cyclin B1, cdh1, and cdc20 gradually declined as cells progressed through M phase. The decline of these protein levels in FlnAy/− cells was much slower. As a downstream target of cdk1/cyclin B1, PH3 levels also decreased, albeit at a slower rate in the FlnAy/− progenitors. b, Delayed degradation of cyclin B1 and cyclin B1-associated proteins in FlnAy/− progenitors. Cultured neural progenitors were treated with cycloheximide to block protein synthesis. Cyclin B1 and cdc20 in FlnAy/+ progenitors underwent gradual degradation over a period of 240 min, but their degradation rates were significantly delayed in FlnAy/− progenitors. c, Levels of phosphorylated cdk1 (Tyr15) in null FlnA neural progenitors and M2 melanoma cells were increased compared to controls by Western blot analyses. The levels of cdc20 and cdh1 were increased in FlnAy/− neural progenitors but unchanged in FLNA-null M2 melanoma cells. Noticeably, total cdk1 expression levels were decreased, but cdk1 phosphorylation (Tyr15) levels were significantly increased by threefold in both FlnA-null progenitor and melanoma cell lines. d, The high levels of phospho-cdk1 were maintained for the entirety of the M-phase in FlnAy/− neural progenitors, as evidenced by Western blot. Quantitative plots are shown to the right. The values reflect the mean ± SD from three separate experiments. *p < 0.05; **p < 0.01; ***p < 0.001.
With cyclin B1, cdk1 phosphorylates several target substrates that promote activation of the APC degradation system (Rudner and Murray, 2000; Golan et al., 2002). Cdk1 activation is regulated by binding to cyclin B1 and also inhibited by cdk1 phosphorylation at tyrosine 15 (Tyr15). In FlnAy/− progenitors and FLNA-null M2 cells, we detected a significant (more than threefold) increase in cdk1 phosphorylation at Tyr15 site (Fig. 7c), suggesting that a greater proportion of cdk1 existed in the inactivated versus activated state in FlnAy/− cells. Furthermore, cdk1 Tyr15 phosphorylation levels remained increased in FlnAy/− progenitors throughout the entire period of mitosis after nocodazole release (Fig. 7d), whereas cdk1 phosphorylation in FlnAy/+ progenitors abruptly decreased as mitosis progressed (Fig. 7d). Overall, these observations indicated that FlnA regulated cyclin B1 degradation by affecting the status of cdk1 Tyr15 phosphorylation in neural progenitors.
FlnA interacts with Wee1-like proteins in neural progenitors
To clarify the molecular mechanism by which FlnA regulated cdk1 inactivation via Tyr15 phosphorylation, we first addressed whether FlnA physically interacted with several regulators of cdk1 activity. Wee1 is conserved among all eukaryotes and phosphorylates Tyr15, whereas members of the cdc25 family are phosphatases, counteracting this activity. We could not demonstrate binding of FlnA to cyclin B1 or cdc25c (Fig. 8a,b). Compared with control coimmunoprecipitation, FlnA weakly interacted with the protein 14-3-3, a regulator of Wee1 (Fig. 8c), but significantly bound to Wee1 endogenously in both neural progenitors and FLNA-expressing A7 cells (Fig. 8d,e). We observed previously that the FlnA C-terminal fragment bound to several proline-rich proteins (our unpublished data) and Wee1 contain a proline-rich domain at the N-terminal. As expected, Wee1 was able to bind the C-terminal portion of FLNA, further suggesting that the actin-binding protein interacted with Wee1 through the proline-rich region (Fig. 8f). Immunostaining showed overlapping FlnA and Wee1 expression at the cell membrane and perinuclear region (Fig. 8g). FLNA appeared to regulate the localization of Wee1 as FLNA suppression in the M2 cell led to a diffusion of Wee1 to the cytoplasm (Fig. 8h). Furthermore, Wee1 expression levels were higher in unsynchronized FlnAy/− cells (Fig. 8i, left two bands), and Wee1 degradation was slower in nocodazole-synchronized FlnAy/− cells as progenitors advanced through mitosis (Fig. 8i, right lanes). Our results suggested that FlnA regulated Wee1 stability and expression levels, and thereby directed cdk1 phosphorylation and inactivation.
Figure 8.

FlnA interacts with Wee1 to promote entry into M phase. a, FlnA did not physically interact endogenously with cyclin B1. Western blot analysis was performed using WT neural progenitors synchronized by nocodazole treatment. Cdk1 was strongly coimmunoprecipitated by cyclin B1, but FlnA was not. b, Cdc25c did not show a strong physical interaction with FLNA. Although FLNA is immunoprecipitated from the homogenized solution of nocodazole treated A7 melanoma cells, cdc25c is not detected from the pull down. c, FlnA weakly binds to 14-3-3 protein by Western blot analyses. d, Western blot analysis shows that FlnA significantly interacts with Wee1 by endogenous coimmunoprecipitation using anti-Wee1 antibody and neural progenitor homogenized lysate. e, The same physical binding was observed using FLNA-expressing A7 melanoma cells. f, Wee1 was pulled down by purified GST-FLNA-C terminal recombinant protein from A7 cell lyses. g, Fluorescent photomicrographs demonstrated FLNA (fluorescein) overlapping expression with Wee1 (rhodamine) at the cell membrane and perinuclear region of A7 melanoma cells. h, Fluorescent photomicrographs showed Wee1 (rhodamine) expression within the Golgi (GM130 Golgi marker, arrow) and cell membrane (arrow) in FLNA-replete A7 cells. In the absence of FLNA (M2 cell line), Wee1 became more diffusely localized throughout the cytoplasm and membrane (arrows). i, Degradation of Wee1 was also impaired in FlnAy/− progenitors. Cells were nocodazole synchronized, and expression levels of Wee1 protein were greater in the FlnAy/− cells compared to controls, at all time points sampled. All the assays involving Wee1 coimmunoprecipitation were confirmed with at least three replicates. Scale bars: 10 μm.
Discussion
FlnA interactions with transmembrane receptors and actin provide for a variety of signaling pathways with which to regulate neural progenitor proliferation. For example, FlnA binds integrin β1, which is a cell adhesion receptor for extracellular matrix proteins like laminin, fibronectin, and collagen (Loo et al., 1998). FlnA shares some common functional characteristics with integrins (Schwartz and Assoian, 2001; Aszodi et al., 2003; LaFlamme et al., 2008): (1) both promote proliferation through regulating cell cycle progression, particularly in M phase and in G1 phase; (2) they promote progenitor differentiation; and (3) they both regulate focal adhesion formation and stress fiber maturation (our unpublished observation). In this respect, FlnA might serve as a key bridge in the signal transduction between integrin and downstream molecules. Our current studies provided a possible signaling pathway, whereby integrin could regulate M-phase progression. Integrin has been found to influence cytokinesis in chondrocytes. FlnA has also been reported to regulate cytokinesis during cell division (Playford et al., 2006), and our immunostaining for FlnA suggested that the protein was concentrated near the cleavage furrow and at the midbody (our unpublished data). Alternatively, both FlnA and integrin have been implicated in G1-phase progression. FlnA has been reported to bind several downstream molecules of the ERK–MAPK pathway, such as Ras GTPase and MKK4 (Ohta et al., 1999; Sarkisian et al., 2006), and integrin has been found to promote G1-phase progression via the ERK pathway (Schwartz and Assoian, 2001; Aszodi et al., 2003). Thus, FlnA might also regulate G1-phase progression via the potential integrin–ERK pathway. Finally, FlnA binds and interacts with F-actin, and F-actin has also been reported to promote cell proliferation by regulating G1-phase progression (Huang and Ingber, 2002). Interestingly, we do see a significant decrease in F-actin staining in the FlnA-null E18 brain (our unpublished observation), and this loss would potentially influence G1-phase progression, even if secondarily. Overall, the filamin family of actin-binding proteins likely plays a complex regulatory role in maintenance and stabilization of various proteins involved in cell cycle regulation.
FlnA regulation of cyclin B1 degradation is a key factor for progression through mitosis once a cell enters metaphase. Our study found that the rate of cyclin B1 degradation in FlnA-null progenitors was significantly reduced, which could explain the delayed mitotic progression of FlnA-null progenitors. Prior studies have reported physical binding of FlnA to cyclin B1, leading to FlnA phosphorylation by cyclin B1-activated kinase cdk1 and the ability of FlnA to cross-link actin (Cukier et al., 2007). We did find that FlnA was highly phosphorylated in neural progenitors during G2/M phase, but were unable to confirm endogenous interactions between FlnA and cyclin B1 via bidirectional coimmunoprecipitation. Differences of sequence and structure between mouse FlnA and human FLNA may be in part responsible for this discrepancy. Alternatively, the prior work's findings may reflect nonphysiologic interactions given the tendency for nonspecific binding of the filamins and the reliance on overexpression of FLNA or cyclin B1 to demonstrate a physical interaction. Whether direct or indirect, both studies would suggest some shared role between FlnA and cyclin B1.
Various components in the APC system can regulate cyclin B1 degradation (Visintin et al., 1997). We found that the expression levels of both cdc20 and cdh1 (APC regulators that promote progression through metaphase to anaphase and anaphase to G1 as well as cyclin B1 degradation) in null FlnA progenitors were not decreased but increased, and their degradation rates were also slower, similar to that of cyclin B1. This observation suggested that a primary activation defect in the APC system might collectively lead to the slower degradation of cyclin B1, cdc20, and cdh1. Previous reports have demonstrated that phosphorylation of APC subunits by activated cdk1 or pilk1 leads to activation of the APC system (Rudner and Murray, 2000; Golan et al., 2002). Moreover, phosphorylation of cdk1 at amino acid sites theronine-14 and tyrosine 15 inactivates cdk1 (Gould and Nurse, 1989; Atherton-Fessler et al., 1993). We found that loss of FlnA promoted cdk1 phosphorylation on tyrosine 15 in neural progenitors and that phosphorylation levels remained elevated throughout mitosis, suggesting that cdk1 activity was inhibited throughout the mitotic cycle. We interpreted these findings to indicate that the delayed degradation of cyclin B1 seen after loss of FlnA and during mitosis was linked to a primary dysregulation of cdk1 phosphorylation.
Wee1-like family kinases, like Wee1 and Pkymt1, can phosphorylate cdk1 on tyrosine 15, whereas cdc25c family phosphatases with its partner protein 14-3-3 can dephosphorylate cdk1 at this site. Recently, FLNA was also reported to regulate entry into mitosis through cdc25c participation (Telles et al., 2011). We could not identify any significant binding between FLNA and cdc25c. The difference in results from those reported likely is due to the fact that the prior work used either GST or overexpression studies through transfection to demonstrate binding between these two proteins. Additionally, we did not find any change in neural progenitor expression levels of cdc25c or 14-3-3 after FlnA suppression. We did, however, identify a weak interaction between FlnA and 14-3-3, suggesting that this pathway might still contribute to and promote entry into mitosis. More prominently, the expression of Wee1-like kinases in FlnA-null progenitors was increased compared to that in FlnA-WT progenitors. Our findings that FlnA endogenously coimmunoprecipitated with Wee1 indicated that FlnA likely regulates the levels of Wee1 protein in neural progenitors, and this pathway led to the increased phosphorylation of cdk1 in FlnA-null progenitors. Given that Wee1 and Pkymt1 share similar proline-rich domains and are expressed in neural progenitors, it is likely that Pkymt1 will be capable of binding FlnA. One possibility might be that FlnA regulates the degradation of these proteins through the ubiquitination system, given APC's role as an E3 ubiquitin ligase and FlnA interactions with members of the Skp–Cullin–F-box-containing complex pathway (our unpublished observations). Further clarification of how FlnA regulates either Wee1 or Pkymt1 will need investigation.
The current studies demonstrate that loss of FlnA in mice does not lead to PH formation in the lateral ventricles of mice but rather a reduction in brain size. The mild microcephaly seen in the mice mirrors the human phenotype in males that harbor mutations in FLNA. The female heterozygous FlnA mice show a mild reduction in brain size but no heterotopia formation in the lateral ventricles. There has been a prior report of nodular formation in the third ventricles of null FlnA mice, although this appears to be an inconsistent finding (Adams et al., 2012). We observe a thinning in the neuroependymal lining of null FlnA mice but no PH formation (our unpublished observations). The absence of PH may reflect the fact that the mice are late embryonic lethal, and heterotopia formation may not yet have occurred at this stage of development. Alternatively, we showed previously that disruption of the neuroependymal lining can lead to nodular heterotopia with loss of BIG2, the second gene mutation in humans that causes PH (our unpublished observations) (Ferland et al., 2009). In this context, it is possible that the mechanical stressors in the human neuroepithlium may be greater than that in the mouse and that loss of FlnA function alone is not sufficient to cause PH formation in mice. Finally, the observed microcephaly and thinning of the neuroependyma with loss of FlnA may extend from a common role for filamins in regulation of vesicle trafficking, and therefore the turnover of cell surface and intracellular proteins. For example, loss of cell surface adhesion proteins such as integrins and cadherins would likely lead to weakening of the neuroependyma and disrupt progenitor proliferation through integrin-mediated cyclin activity. Additional studies will be required to understand this possible relationship.
While our findings demonstrate a novel role for actin-binding proteins in regulating the degradation of cell cycle-related proteins in the brain and giving rise to microcephaly, loss of FlnA function also influences the development of various other organ systems. FlnA appears to be involved in blood vessel and heart formation given the vasculopathy and valvular defects seen in the null mice. Suppression of this actin-binding protein also leads to midline closure defects involving the sternum and palate, suggesting a defect in skeletal formation. Additionally, development of omphalocele and observed shortening of the gut similarly implies a disruption in gastrointestinal development. Finally, the null FlnA mouse exhibits an overall reduction in body size. Taken in total, these observations raise the possibility that FlnA function as it relates to cell cycle regulation of the neural progenitor pool may extend more broadly to other progenitors across various tissue and organ systems, and thereby provide a general mechanism of function and action.
Footnotes
This work was supported by National Institutes of Health Grant NS063997-01 to V.L.S. and the Empire State Stem Cell Fund through the New York State Department of Health Contract C024324 to R.F. and V.L.S. The opinions expressed here are solely those of the authors and do not necessarily reflect those of the Empire State Stem Cell Board, the New York State Department of Health, or the State of New York. V.L.S. is a Doris Duke Clinical Scientist Developmental Award recipient. We thank Fumihiko Nakamura for the gift of anti-FLNA antibodies (1-7 and 4-4). The reelin antibody (Cat. No. R4B) developed by Andre Goffinet was obtained from the Developmental Studies Hybridoma Bank developed under the auspices of the NICHD and maintained by The University of Iowa, Department of Biology, Iowa City, IA 52242. We also thank Dr. Karina Tuz and Barbara Beyer.
The authors declare no competing financial interests.
References
- Adams M, Simms RJ, Abdelhamed Z, Dawe HR, Szymanska K, Logan CV, Wheway G, Pitt E, Gull K, Knowles MA, Blair E, Cross SH, Sayer JA, Johnson CA. A meckelin-filamin A interaction mediates ciliogenesis. Hum Mol Genet. 2012;21:1272–1286. doi: 10.1093/hmg/ddr557. [DOI] [PMC free article] [PubMed] [Google Scholar]
- Aszodi A, Hunziker EB, Brakebusch C, Fassler R. Beta1 integrins regulate chondrocyte rotation, G1 progression, and cytokinesis. Genes Dev. 2003;17:2465–2479. doi: 10.1101/gad.277003. [DOI] [PMC free article] [PubMed] [Google Scholar]
- Bond J, Woods CG. Cytoskeletal genes regulating brain size. Curr Opin Cell Biol. 2006;18:95–101. doi: 10.1016/j.ceb.2005.11.004. [DOI] [PubMed] [Google Scholar]
- Cremisi F, Philpott A, Ohnuma S. Cell cycle and cell fate interactions in neural development. Curr Opin Neurobiol. 2003;13:26–33. doi: 10.1016/s0959-4388(03)00005-9. [DOI] [PubMed] [Google Scholar]
- Cukier IH, Li Y, Lee JM. Cyclin B1/Cdk1 binds and phosphorylates Filamin A and regulates its ability to cross-link actin. FEBS Lett. 2007;581:1661–1672. doi: 10.1016/j.febslet.2007.03.041. [DOI] [PubMed] [Google Scholar]
- Cunningham CC, Gorlin JB, Kwiatkowski DJ, Hartwig JH, Janmey PA, Byers HR, Stossel TP. Actin-binding protein requirement for cortical stability and efficient locomotion. Science. 1992;255:325–327. doi: 10.1126/science.1549777. [DOI] [PubMed] [Google Scholar]
- Dehay C, Kennedy H. Cell-cycle control and cortical development. Nat Rev Neurosci. 2007;8:438–450. doi: 10.1038/nrn2097. [DOI] [PubMed] [Google Scholar]
- Farkas LM, Huttner WB. The cell biology of neural stem and progenitor cells and its significance for their proliferation versus differentiation during mammalian brain development. Curr Opin Cell Biol. 2008;20:707–715. doi: 10.1016/j.ceb.2008.09.008. [DOI] [PubMed] [Google Scholar]
- Ferland RJ, Gaitanis JN, Apse K, Tantravahi U, Walsh CA, Sheen VL. Periventricular nodular heterotopia and Williams syndrome. Am J Med Genet A. 2006;140:1305–1311. doi: 10.1002/ajmg.a.31259. [DOI] [PubMed] [Google Scholar]
- Ferland RJ, Batiz LF, Neal J, Lian G, Bundock E, Lu J, Hsiao YC, Diamond R, Mei D, Banham AH, Brown PJ, Vanderburg CR, Joseph J, Hecht JL, Folkerth R, Guerrini R, Walsh CA, Rodriguez EM, Sheen VL. Disruption of neural progenitors along the ventricular and subventricular zones in periventricular heterotopia. Hum Mol Genet. 2009;18:497–516. doi: 10.1093/hmg/ddn377. [DOI] [PMC free article] [PubMed] [Google Scholar]
- Fox JW, Lamperti ED, Ekşioğlu YZ, Hong SE, Feng Y, Graham DA, Scheffer IE, Dobyns WB, Hirsch BA, Radtke RA, Berkovic SF, Huttenlocher PR, Walsh CA. Mutations in filamin 1 prevent migration of cerebral cortical neurons in human periventricular heterotopia. Neuron. 1998;21:1315–1325. doi: 10.1016/s0896-6273(00)80651-0. [DOI] [PubMed] [Google Scholar]
- Golan A, Yudkovsky Y, Hershko A. The cyclin-ubiquitin ligase activity of cyclosome/APC is jointly activated by protein kinases Cdk1-cyclin B and Plk. J Biol Chem. 2002;277:15552–15557. doi: 10.1074/jbc.M111476200. [DOI] [PubMed] [Google Scholar]
- Gould KL, Nurse P. Tyrosine phosphorylation of the fission yeast cdc2+ protein kinase regulates entry into mitosis. Nature. 1989;342:39–45. doi: 10.1038/342039a0. [DOI] [PubMed] [Google Scholar]
- Hart AW, Morgan JE, Schneider J, West K, McKie L, Bhattacharya S, Jackson IJ, Cross SH. Cardiac malformations and midline skeletal defects in mice lacking filamin A. Hum Mol Genet. 2006;15:2457–2467. doi: 10.1093/hmg/ddl168. [DOI] [PubMed] [Google Scholar]
- Huang S, Ingber DE. A discrete cell cycle checkpoint in late G(1) that is cytoskeleton-dependent and MAP kinase (Erk)-independent. Exp Cell Res. 2002;275:255–264. doi: 10.1006/excr.2002.5504. [DOI] [PubMed] [Google Scholar]
- Kintner C. Neurogenesis in embryos and in adult neural stem cells. J Neurosci. 2002;22:639–643. doi: 10.1523/JNEUROSCI.22-03-00639.2002. [DOI] [PMC free article] [PubMed] [Google Scholar]
- LaFlamme SE, Nieves B, Colello D, Reverte CG. Integrins as regulators of the mitotic machinery. Curr Opin Cell Biol. 2008;20:576–582. doi: 10.1016/j.ceb.2008.06.006. [DOI] [PMC free article] [PubMed] [Google Scholar]
- Leise W, 3rd, Mueller PR. Multiple Cdk1 inhibitory kinases regulate the cell cycle during development. Dev Biol. 2002;249:156–173. doi: 10.1006/dbio.2002.0743. [DOI] [PubMed] [Google Scholar]
- Lew DJ, Kornbluth S. Regulatory roles of cyclin dependent kinase phosphorylation in cell cycle control. Curr Opin Cell Biol. 1996;8:795–804. doi: 10.1016/s0955-0674(96)80080-9. [DOI] [PubMed] [Google Scholar]
- Loo DT, Kanner SB, Aruffo A. Filamin binds to the cytoplasmic domain of the beta1-integrin. Identification of amino acids responsible for this interaction. J Biol Chem. 1998;273:23304–23312. doi: 10.1074/jbc.273.36.23304. [DOI] [PubMed] [Google Scholar]
- Miyata T, Kawaguchi D, Kawaguchi A, Gotoh Y. Mechanisms that regulate the number of neurons during mouse neocortical development. Curr Opin Neurobiol. 2010;20:22–28. doi: 10.1016/j.conb.2010.01.001. [DOI] [PubMed] [Google Scholar]
- Murray AW, Kirschner MW. Cyclin synthesis drives the early embryonic cell cycle. Nature. 1989;339:275–280. doi: 10.1038/339275a0. [DOI] [PubMed] [Google Scholar]
- Ohnuma S, Harris WA. Neurogenesis and the cell cycle. Neuron. 2003;40:199–208. doi: 10.1016/s0896-6273(03)00632-9. [DOI] [PubMed] [Google Scholar]
- Ohta Y, Suzuki N, Nakamura S, Hartwig JH, Stossel TP. The small GTPase RalA targets filamin to induce filopodia. Proc Natl Acad Sci U S A. 1999;96:2122–2128. doi: 10.1073/pnas.96.5.2122. [DOI] [PMC free article] [PubMed] [Google Scholar]
- Okamoto K, Sagata N. Mechanism for inactivation of the mitotic inhibitory kinase Wee1 at M phase. Proc Natl Acad Sci U S A. 2007;104:3753–3758. doi: 10.1073/pnas.0607357104. [DOI] [PMC free article] [PubMed] [Google Scholar]
- Playford MP, Lyons PD, Sastry SK, Schaller MD. Identification of a filamin docking site on PTP-PEST. J Biol Chem. 2006;281:34104–34112. doi: 10.1074/jbc.M606277200. [DOI] [PubMed] [Google Scholar]
- Rudner AD, Murray AW. Phosphorylation by Cdc28 activates the Cdc20-dependent activity of the anaphase-promoting complex. J Cell Biol. 2000;149:1377–1390. doi: 10.1083/jcb.149.7.1377. [DOI] [PMC free article] [PubMed] [Google Scholar]
- Sarkisian MR, Bartley CM, Chi H, Nakamura F, Hashimoto-Torii K, Torii M, Flavell RA, Rakic P. MEKK4 signaling regulates filamin expression and neuronal migration. Neuron. 2006;52:789–801. doi: 10.1016/j.neuron.2006.10.024. [DOI] [PMC free article] [PubMed] [Google Scholar]
- Schwartz MA, Assoian RK. Integrins and cell proliferation: regulation of cyclin-dependent kinases via cytoplasmic signaling pathways. J Cell Sci. 2001;114:2553–2560. doi: 10.1242/jcs.114.14.2553. [DOI] [PubMed] [Google Scholar]
- Sheen VL, Jansen A, Chen MH, Parrini E, Morgan T, Ravenscroft R, Ganesh V, Underwood T, Wiley J, Leventer R, Vaid RR, Ruiz DE, Hutchins GM, Menasha J, Willner J, Geng Y, Gripp KW, Nicholson L, Berry-Kravis E, Bodell A, et al. Filamin A mutations cause periventricular heterotopia with Ehlers-Danlos syndrome. Neurology. 2005;64:254–262. doi: 10.1212/01.WNL.0000149512.79621.DF. [DOI] [PubMed] [Google Scholar]
- Sheen VL, Ferland RJ, Harney M, Hill RS, Neal J, Banham AH, Brown P, Chenn A, Corbo J, Hecht J, Folkerth R, Walsh CA. Impaired proliferation and migration in human Miller-Dieker neural precursors. Ann Neurol. 2006;60:137–144. doi: 10.1002/ana.20843. [DOI] [PubMed] [Google Scholar]
- Takahashi T, Nowakowski RS, Caviness VS., Jr Cell cycle parameters and patterns of nuclear movement in the neocortical proliferative zone of the fetal mouse. J Neurosci. 1993;13:820–833. doi: 10.1523/JNEUROSCI.13-02-00820.1993. [DOI] [PMC free article] [PubMed] [Google Scholar]
- Takahashi T, Nowakowski RS, Caviness VS., Jr The cell cycle of the pseudostratified ventricular epithelium of the embryonic murine cerebral wall. J Neurosci. 1995;15:6046–6057. doi: 10.1523/JNEUROSCI.15-09-06046.1995. [DOI] [PMC free article] [PubMed] [Google Scholar]
- Takahashi T, Nowakowski RS, Caviness VS., Jr The leaving or Q fraction of the murine cerebral proliferative epithelium: a general model of neocortical neuronogenesis. J Neurosci. 1996;16:6183–6196. doi: 10.1523/JNEUROSCI.16-19-06183.1996. [DOI] [PMC free article] [PubMed] [Google Scholar]
- Telles E, Gurjar M, Ganti K, Gupta D, Dalal SN. Filamin A stimulates cdc25C function and promotes entry into mitosis. Cell Cycle. 2011;10:776–782. doi: 10.4161/cc.10.5.14954. [DOI] [PubMed] [Google Scholar]
- Visintin R, Prinz S, Amon A. CDC20 and CDH1: a family of substrate-specific activators of APC-dependent proteolysis. Science. 1997;278:460–463. doi: 10.1126/science.278.5337.460. [DOI] [PubMed] [Google Scholar]
- Watanabe N, Arai H, Nishihara Y, Taniguchi M, Watanabe N, Hunter T, Osada H. M-phase kinases induce phospho-dependent ubiquitination of somatic Wee1 by SCFbeta-TrCP. Proc Natl Acad Sci U S A. 2004;101:4419–4424. doi: 10.1073/pnas.0307700101. [DOI] [PMC free article] [PubMed] [Google Scholar]
- Yonemura S, Hirao-Minakuchi K, Nishimura Y. Rho localization in cells and tissues. Exp Cell Res. 2004;295:300–314. doi: 10.1016/j.yexcr.2004.01.005. [DOI] [PubMed] [Google Scholar]