Abstract
Abnormal interactions of Cu and Zn ions with the amyloid β (Aβ) peptide are proposed to play an important role in the pathogenesis of Alzheimer’s disease (AD). Disruption of these metal–peptide interactions using chemical agents holds considerable promise as a therapeutic strategy to combat this incurable disease. Reported herein are two bifunctional compounds (BFCs) L1 and L2 that contain both amyloid-binding and metal-chelating molecular motifs. Both L1 and L2 exhibit high stability constants for Cu2+ and Zn2+ and thus are good chelators for these metal ions. In addition, L1 and L2 show strong affinity toward Aβ species. Both compounds are efficient inhibitors of the metal–mediated aggregation of the Aβ42 peptide and promote disaggregation of amyloid fibrils, as observed by ThT fluorescence, native gel electrophoresis/Western blotting, and transmission electron microscopy (TEM). Interestingly, the formation of soluble Aβ42 oligomers in presence of metal ions and BFCs leads to an increased cellular toxicity. These results suggest that for the Aβ42 peptide – in contrast to the Aβ40 peptide, the previously employed strategy of inhibiting Aβ aggregation and promoting amyloid fibril dissagregation may not be optimal for the development of potential AD therapeutics, due to formation of neurotoxic soluble Aβ42 oligomers.
Keywords: Alzheimer’s disease, metal chelator, Thioflavin T, stability constant, binding constant, peroxide formation
Introduction
Alzheimer’s disease (AD) is the most common cause of age-related senile dementia, as more than 5 million in the US and 24 million people worldwide suffer from this neurodegenerative disease.1–3 To date there is no treatment for AD and its diagnosis with high accuracy requires a detailed post-mortem examination of the brain.4 The brains of AD patients are characterized by the deposition of amyloid plaques whose main component is the amyloid β (Aβ) peptide.5 The main alloforms of the Aβ peptide are 42 and 40 amino acids long (Aβ42 and Aβ40, respectively);6,7 Aβ40 is present in larger amounts in the brain, yet Aβ42 is more neurotoxic and has a higher tendency to aggregate.8–11 According to the amyloid cascade hypothesis, the increased production and accumulation of the Aβ peptide promote the formation of Aβ oligomers, protofibrils, and ultimately amyloid fibrils that lead to neurodegeneration.12,13 However, recent in vivo studies have shown that the soluble Aβ oligomers are possibly more neurotoxic than amyloid plaques,14–17 and are likely responsible for synaptic dysfunction and memory loss in AD patients and AD animal models.18–21 In this regard, efforts to rationally design AD therapeutics based on compounds that control Aβ aggregation have been hampered by the lack of a complete understanding of the neurotoxic role of various Aβ aggregates.22
Remarkably high concentrations of Zn, Cu, and Fe have been found within the amyloid deposits in AD-affected brains,23,24 and several studies have investigated the interactions of metal ions with monomeric Aβ peptides and their correlation with amyloid plaque formation.23–29 Thus, these metal ions have been shown to promote Aβ40 aggregation,23–27,29–32 as well as lead to formation of reactive oxygen species (ROS) and oxidative stress.3,26–31,33–36 However, the role of metal ions in Aβ42 aggregation still remains unclear and only few reports are available in the literature.37–41 For example, while Zn2+ was shown to cause rapid formation of nonfibrillar aggregates,41 Cu2+ was shown to reduce Aβ42 aggregation.39,40 Overall, these studies confirm that metal ions modulate the various pathways of Aβ aggregation and toxicity,42 yet the molecular mechanisms of metal-Aβ species interactions, especially for the more neurotoxic Aβ42, are not completely understood.
Given the recognized interactions of Aβ with transition metal ions, several studies have shown that metal chelators can reduce the metal-mediated Aβ aggregation, ROS formation, and neurotoxicity in vitro.43–45 For example, the non-specific chelator clioquinol (CQ) showed decreased Aβ aggregate formation that resulted in improved cognition in clinical trials.24,25,43–45 However, use of non-specific chelators (i.e., CQ) that do not interact selectively with the Aβ–metal species exhibit adverse side effects that will likely limit their long term clinical use.3,28,29,31,44,46–48
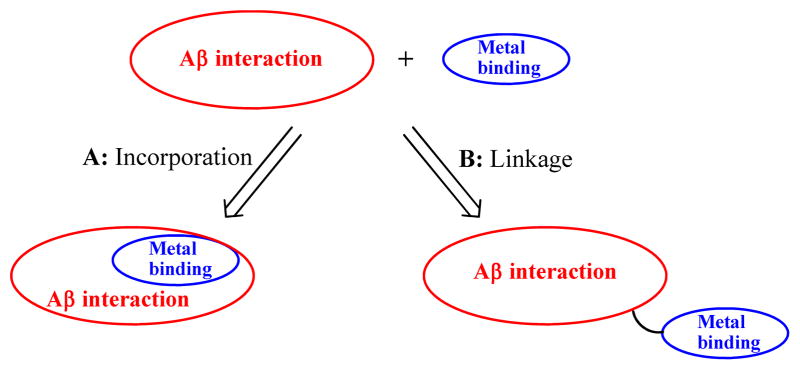
Recent efforts in studying the Aβ–metal interactions have focused on small molecules – bifunctional chelators (BFCs), which can interact with the Aβ peptide and also bind the metal ions from the Aβ–metal species. Such bifunctional compounds should potentially lead to more effective therapeutic agents, as well as provide an increased understanding of the metal–Aβ associated neuropathology. In this context, two approaches have been pursued in BFC design. 31,49–58 One strategy is based on the direct incorporation of metal-binding atom donors into the structural framework of an Aβ-interacting compoud (Scheme 1, approach A), and the other involves linking the metal-chelating and Aβ-binding molecular fragments (Scheme 1, approach B). While the former approach has recently been employed in several classes of compounds,51,52,57,59 only a few examples have been designed based on the latter approach.49,53,54
Scheme 1.
Pictorial representation of the two approaches employed in bifunctional chelator design.
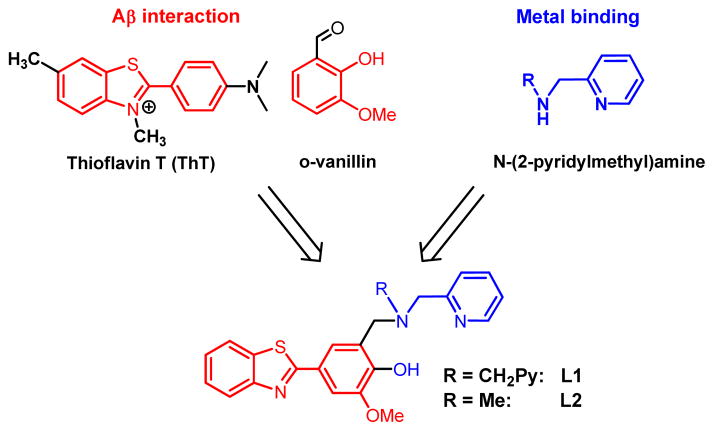
Reported herein are two new BFCs, L1 and L2, that were designed following the linkage approach and contain metal-binding N-(2-pyridylmethyl)amine groups and amyloid-interacting 2-phenylbenzothiazole and o-vanillin molecular fragments (Scheme 2).59 The bifunctional character of the two compounds was confirmed by metal-chelating and Aβ-binding studies that reveal a tight binding to Cu and Zn ions and high affinity for the Aβ fibrils. The Aβ-binding ability of the two bifunctional compounds was determined by taking advantage of their intrinsic fluorescence properties. L1 and L2 are, to the best of our knowledge, the first bifunctional chelators for which Aβ fibril binding affinities were measured. In addition, the corresponding Cu2+ and Zn2+ complexes were isolated and characterized structurally and spectroscopically. These BFCs were also able to inhibit the metal-mediated Aβ aggregation and disassemble pre-formed Aβ aggregates. Most notably, this is the first detailed study of the interaction of bifunctional compounds with the more aggregation-prone Aβ42 peptide, which is proposed to be physiologically relevant due to the formation of Aβ42 oligomers.10,11,18–20 Intriguingly, the ability of the developed BFCs to inhibit Aβ fibril formation and promote fibril dissagregation leads to increased cellular toxicity. This suggests that the previously proposed strategy of limiting Aβ aggregation may not be optimal for the Aβ42 peptide as it may generate neurotoxic soluble Aβ42 oligomers. As such, future bifunctional chelator design approaches should be aimed at controlling these soluble Aβ42 oligomers.
Scheme 2.
Employed synthetic strategy for bifunctional chelators.
Experimental Section
General Methods
All reagents were purchased from commercial sources and used as received unless stated otherwise. Solvents were purified prior to use by passing through a column of activated alumina using an MBRAUN SPS. All solutions and buffers were prepared using metal-free Millipore water that was treated with Chelex overnight and filtered through a 0.22 μm nylon filter. 1H (300.121 MHz) and 13C (151 MHz) NMR spectra were recorded on a Varian Mercury-300 spectrometer. Chemical shifts are reported in ppm and referenced to residual solvent resonance peaks. UV–visible spectra were recorded on a Varian Cary 50 Bio spectrophotometer and are reported as λmax, nm (ε, M−1 cm−1). ESI-MS experiments were performed using a Bruker Maxis QTOF mass spectrometer with an electrospray ionization source. Solution magnetic susceptibility measurements were obtained by the Evans method60 using coaxial NMR tubes and CD3CN or CD2 Cl2 as a solvent at 298 K; diamagnetic corrections were estimated using Pascal’s constants.61 ESI mass-spectrometry was provided by the Washington University Mass Spectrometry NIH Resource (Grant no. P41RR0954), and elemental analyses were carried out by the Columbia Analytical Services Tucson Laboratory. TEM analysis was performed at the Nano Research Facility (NRF) at Washington University.
Syntheses
L1
Paraformaldehyde (0.296 g, 9.86 mmol) was added to a solution of bis–(2–picolyl)amine (1.798 g, 9.02 mmol) in EtOH (75 mL) and the resultant mixture was heated to reflux for 1 h. Then 2–(4–hydroxy–3–methoxy)-benzothiazole62 (2.113 g, 8.99 mmol) in EtOH (70 mL) was added, the solution was refluxed for an additional 48 hours, and then cooled to room temperature. The solvent was removed to give a light yellow residue that was purified by silica gel column chromatography using EtOAc/iPrOH/NH4OH (75:20:5) to yield a white solid (2.98 g, yield 71%). 1H NMR (CDCl3): δ 8.56 (d, 2H, PyH), 8.01 (d, 1H, ArH), 7.87 (d, 1H, ArH), 7.60–7.66 (m, 3H, ArH), 7.43–7.49 (m, 1H, ArH), 7.31–7.38 (m, 3H, PyH and phenol H), 7.15–7.19 (m, 2H, PyH and PyH3), 4.05 (s, 3H, OCH3), 3.93 (s, 4H, NCH2Py), 3.89 (s, 2H, CH2N). 13C NMR (CDCl3): δ 168.5, 158.3, 154.4, 150.4, 149.1, 149.0, 137.1, 135.0, 126.3, 124.8, 124.4, 123.8, 122.8, 122.6, 122.6, 122.4, 121.6, 110.1, 59.1, 56.7, 56.3. UV–vis, MeCN, λmax, nm (ε, M−1 cm−1): 226 (35,800), 330 (25,800). HR-MS: Calcd for [M+H]+, 469.1698; found, 469.1689.
L2
Paraformaldehyde (0.086 g, 2.86 mmol) was added to a solution of N–Methyl–2–pyridinemetanamine (0.235 g, 1.925 mmol) in EtOH (5 mL) and the resultant mixture was heated to reflux for 1 h. A hot solution of 2–(4–hydroxy–3–methoxy)benzothiazole (0.5 g, 1.923 mmol) in EtOH (10 mL) was added to the reaction flask and the solution was refluxed for an additional 24 h. The solvent was removed and the resulting residue was purified by silica gel column chromatography using EtOAc/Hexane (1:1) to yield a white solid (0.510 g, yield 67%). 1H NMR (CDCl3): δ 8.61 (d, 1H, Py2H), 8.01 (d, 1H, ArH), 7.87 (d, 1H, ArH), 7.69 (dt, 1H, PyH4), 7.59 (d, 1H, ArH), 7.47 (t, 1H, ArH), 7.33–7.37 (m, 3H, ArH and PyH3), 7.32 (s, 1H, ArH), 7.22 (t. 1H, PyH5), 4.03 (s, 3H, OCH3), 3.88 (s, 4H, CH2NCH2), 2.37 (s, 3H, NCH3). 13C NMR (CDCl3): δ 168.4, 157.1, 154.3, 150.5, 149.5, 148.6, 137.1, 134.9, 126.3, 124.8, 124.7, 123.4, 122.8, 122.8, 122.7, 121.6, 121.1, 110.1, 63.0, 60.2, 56.3, 42.0. UV–vis, MeCN, λmax, nm, (ε, M−1 cm−1): 226 (36,300), 348 (25,300). HR-MS: Calcd for [M+H]+, 392.1433; found, 392.1426.
[(L1)CuII]2(ClO4)2·H2O (1)
A solution of [CuII(H2O)6](ClO4)2 (0.119 g, 0.32 mmol) was added to a stirring solution of L1 (0.15 g, 0.32 mmol) in MeCN (5 mL) and Et3N (0.064 g, 0.64 mmol). The brown solution was stirred for 30 min. Addition of Et2O resulted in the formation of a brown precipitate which was filtered, washed with Et2O, and dried under vacuum (0.209 g, yield 54%). UV–vis, MeCN, λmax, nm, (ε, M−1 cm−1): 226 (63,100), 348 (60,200), 425 (650), 832 (230). HR-MS: Calcd for [(L1)Cu]22+, 530.0838; found, 530.0833. Room temperature solution magnetic moment μeff = 1.72 μB/Cu2+. Anal. Found: C, 50.22; H, 3.35; N, 9.09. Calcd for C54H46Cl2Cu2N8O12S2·H2O: C, 50.70; H, 3.78; N, 8.76.
[(L1)ZnII]2(ClO4)4·2MeOH·2H2O (2)
A solution of [ZnII(H2O)6](ClO4)2 (0.040 g, 0.106 mmol) in H2O (1 mL) was added to a stirring solution of L1 (0.05 g, 0.106 mmol) and Et3N (0.022 g, 0.212 mmol) in MeOH (5 mL). The light yellow solution was stirred for 30 min, and the white precipitate obtained was filtered, washed with Et2O, and dried under vacuum (0.048 g, yield 68%). 1H NMR (CD3CN): δ 8.69 (m, 4H), 8.10–7.97 (m, 6H), 7.87 (m, 4H), 7.64–7.35 (m, 10H), 7.22 (m, 4H), 4.04 (s, 6H, OCH3), 3.92 (s, 8H, NCH2Py), 3.88 (s, 4H, CH2N). UV–vis, MeCN, λmax, nm, (ε, M−1 cm−1): 226 (19,300), 340 (17,900). HR-MS: Calcd for [(L1)Zn]22+, 531.0833; found, 531.0829. Anal. Found: C, 49.13; H, 4.92; N, 8.59. Calcd for C54H46Cl2N8O12S2Zn2·2MeOH·2H2O: C, 49.28; H, 4.28; N, 8.21.
[(L2)2CuII] (3)
A solution of [CuII(H2O)6](ClO4)2 (0.057 g, 0.153 mmol) in MeCN (1 mL) was added to a stirring solution of L2 (0.06 g, 0.153 mmol) and Et3N (0.031 g, 0.306 mmol) in MeCN (5 mL). The resulting dark brown solution was stirred for 30 min. Addition of Et2O resulted in the formation of a dark brown precipitate which was filtered, washed with Et2O, and dried under vacuum (0.040 g, yield 46%). UV–vis, CH2Cl2, λmax, nm, (ε, M−1 cm−1): 370 (43,100), 430 (13,700), 520 (1,700), 660 (220). HRMS: Calcd for [(L2)Cu]+, 453.0571; found, 453.0572. Room temperature solution magnetic moment μeff = 1.73 μB/Cu2+. Anal. Found: C, 62.21; H, 4.34; N, 9.66. Calcd for C44H40CuN6O4S2: C, 62.58; H, 4.77; N, 9.95.
[(L2)3ZnII3(O)](ClO4)·5H2O·2MeOH·MeCN (4)
A suspension of [ZnII(H2O)6](ClO4)2 (0.076 g, 0.204 mmol) in THF (1 mL) was added to a stirring solution of L2 (0.08 g, 0.204 mmol) and Et3N (0.042 g, 0.408 mmol) in THF (5 mL). The yellowish solution was stirred for 30 min. Addition of Et2O resulted in the formation of a light yellow precipitate which was filtered, washed with Et2O, recrystallized from CH2Cl2/Et2O, and dried under vacuum (0.082 g, yield 70%). 1H NMR (CDCl3): δ 9.04 (d, 1H), 8.44(d, 1H), 8.16 (d, 1H), 7.95(d, 2H), 7.88 (d, 2H), 7.75 (s, 1H), 7.60 (t, 1H), 7.48–7.33 (m, 5H), 7.18 (s, 1H), 7.01(d, 1H), 6.94 (s, 1H), 6.71 (t, 1H), 4.07–3.46 (m, 14H, OCH3 and CH2NCH2), 2.85 (s, 3H, NCH3), 2.49 (s, 3H, NCH3). UV–vis, MeCN, λmax, nm, (ε, M−1 cm−1): 260 (19,200), 348 (15,500). HR-MS: Calcd for [(L2)Zn]22+, 454.0568; found, 454.0564. Anal. Found: C, 49.88; H, 5.32; N, 8.10. Calcd for C66H60ClN9O11S3Zn3·5H2O·2MeOH·MeCN: C, 50.09; H, 4.86; N, 8.35.
X–ray Crystallography
Suitable crystals of appropriate dimensions were mounted in a Bruker Kappa Apex-II CCD X–Ray diffractometer equipped with an Oxford Cryostream LT device and a fine focus Mo Kα radiation X–Ray source (λ = 0.71073 Å). Preliminary unit cell constants were determined with a set of 36 narrow frame scans. Typical data sets consist of combinations of ϖ and φ scan frames with a typical scan width of 0.5° and a counting time of 15–30 seconds/frame at a crystal-to-detector distance of ~4.0 cm. The collected frames were integrated using an orientation matrix determined from the narrow frame scans. Apex II and SAINT software packages (Bruker Analytical X–Ray, Madison, WI, 2008) were used for data collection and data integration. Final cell constants were determined by global refinement of reflections from the complete data set. Data were corrected for systematic errors using SADABS (Bruker Analytical X–Ray, Madison, WI, 2008). Structure solutions and refinement were carried out using the SHELXTL- PLUS software package (Sheldrick, G. M. (2008), Bruker-SHELXTL, Acta Cryst. A64,112–122). The structures were refined with full matrix least-squares refinement by minimizing Σw(Fo2–Fc2)2. All non-hydrogen atoms were refined anisotropically to convergence. All H atoms were added in the calculated position and were refined using appropriate riding models (AFIX m3). For 1, the benzothiazole ring atoms of one of the ligands were displaced over two positions which were refined with a site occupation factor of 0.5/0.5. Additional crystallographic details can be found in the Supporting Information.
Acidity and Stability Constant Determination
UV–vis pH titrations were employed for the determination of acidity constants of L1 and L2 and the stability constants of their Cu2+ and Zn2+ complexes. For acidity constants, solutions of BFCs (50 μM, 0.1 M NaCl, pH 3) were titrated with small aliquots of 0.1 M NaOH at room temperature. At least 30 UV-vis spectra were collected in the pH 3–11 range. Due to the limited solubility of L1 and L2 in water, MeOH stock solutions (10 mM) were used and titrations were performed in a MeOH–water mixture in which MeOH did not exceed 20% (v:v). Similarly, stability constants were determined by titrating solutions of L1 or L2 and equimolar amounts of Cu(ClO4)2·6H2O (50 μM or 0.5 mM) or Zn(ClO4)2·6H2O (50 μM) with small aliquots of 0.1 M NaOH at room temperature. At least 30 UV-vis spectra were collected in the pH 3–11 range. The acidity and stability constants were calculated using the HypSpec computer program (Protonic Software, UK).63 Speciation plots of the compounds and their metal complexes were calculated using the program HySS2009 (Protonic Software, UK).64
Amyloid β Peptide Experiments
Aβ monomeric films were prepared by dissolving commercial Aβ42 (or Aβ40 for Aβ fibril binding studies) peptide (Keck Biotechnology Resource Laboratory, Yale University) in HFIP (1 mM) and incubating for 1 h at room temperature.65 The solution was then aliquoted out and evaporated overnight. The aliquots were vacuum centrifuged and the resulting monomeric films stored at −80 °C. Aβ fibrils were generated by dissolving monomeric Aβ films in DMSO, diluting into the appropriate buffer, and incubating for 24 h at 37 °C with continuous agitation (final DMSO concentration was < 2%). For metal-containing fibrils, the corresponding metal ions were added before the initiation of the fibrilization conditions. For inhibition studies, BFCs (50 μM, DMSO stock solutions) were added to Aβ solutions (25 mM) in the absence or presence of metal salts (CuCl2 or ZnCl2, 25 μM) and incubated for 24 h at 37 °C with constant agitation. For disaggregation studies, the pre-formed Aβ fibrils in the absence or presence of metal ions were treated with BFCs and further incubated for 24 h at 37 °C with constant agitation. For preparation of soluble Aβ42 oligomers a literature protocol was followed.14,65 A monomeric film of Aβ42 was dissolved in anhydrous DMSO, followed by addition of DMEM-F12 media (1:1 v:v, without phenol red, Invitrogen). The solution (50–100 μM) was incubated at 4 °C for 24 h and then centrifuged at 10,000 g for 10 min. The supernatant was used as a solution of soluble Aβ42 oligomers.
Fluorescence Measurements
All fluorescence measurements were performed using a SpectraMax M2e plate reader (Molecular Devices). For ThT fluorescence studies, samples were diluted to a final concentration of 2.5 μM Aβ in PBS containing 10 μM ThT and the fluorescence measured at 485 nm (λex = 435 nm). For Aβ fibril binding studies, a 5 μM Aβ fibril solution was titrated with small amounts of compound and their fluorescence intensity measured (λex/λem = 330/450 nm). For ThT competition assays, a 5 μM Aβ fibril solution with 2 μM ThT was titrated with small amounts of compound and the ThT fluorescence measured λex/λem = 435/485 nm). For calculating Ki values, a Kd value of 1.17 μM was used for the binding of ThT to Aβ fibrils (Figure S21b).
Fluorescence Microscopy
A solution of Aβ42 fibrils in PBS (100 μM) was incubated with a 1 mg/mL EtOH solution of compound (final ratio of 4:1 v:v) for 10 min at room temperature. The fibrils were cleaned with distilled water and suspended in water–glycerol (2:1) before their analysis. Positive binding controls were performed under the same conditions with ThT. Images were obtained using with a Nikon A1 Microscope (60x lens) with 405 nm excitation and 450–500 nm emission range.
Transmission Electron Microscopy (TEM)
Glow-discharged grids (Formar/Carbon 300-mesh, Electron Microscopy Sciences) were treated with Aβ samples (25 μM, 5 μL) for 2–3 min at room temperature. Excess solution was removed using filter paper and grids were rinsed twice with H2O (5 μL). Grids were stained with uranyl acetate (1% w/v, H2O, 5 μL) for 1 min, blotted with filter paper, and dried for 15 min at room temperature. Images were captured using a FEI G2 Spirit Twin microscope (60–80 kV, 6,500–97,000x magnification).
Hydrogen Peroxide Assays
Hydrogen peroxide production was determined using a HRP/Amplex Red assay.51,66–72 A general protocol from Invitrogen’s Amplex Red Hydrogen Peroxide/Peroxidase Assay kit was followed. Reagents were added directly to a 96-well plate in the following order to give a 100 μL final solution: CuCl2 (100, 200 or 400 nM), phosphate buffer, Aβ peptide (200 nM), compounds (400 or 800 nM), sodium ascorbate (10 μM). The reaction was allowed to incubate for 30 min at room temperature. After this incubation, 50 μL of freshly prepared working solution containing 100 nM Amplex Red (AnaSpec) and 0.2 U/mL HRP (Sigma) in phosphate buffer was added to each well, and the reaction was allowed to incubate for 30 min at room temperature. Fluorescence was measured using a SpectraMax M2e plate reader (λex/λem = 530/590). Error bars represent standard deviations for at least five measurements.
Native Gel Electrophoresis and Western Blotting
All gels, buffers, membranes, and other reagents were purchased from Invitrogen and used as directed except where otherwise noted. Samples were separated on 10–20% gradient Tris-tricine mini gels. The gel was transferred to a nitrocellulose membrane in an ice bath and the protocol was followed as suggested except that the membrane was blocked overnight at 4 °C. After blocking, the membrane was incubated in a solution (1:2,000 dilution) of 6E10 anti-Aβ primary antibody (Covance) for 3 h. Invitrogen’s Western Breeze Chemiluminescent kit was used to visualize the bands. An alkaline-phosphatase anti-mouse secondary antibody was used, and the protein bands were imaged using a FUJIFILM Luminescent Image Analyser LAS-1000CH.
Cytotoxicity Studies (Alamar Blue Assay)
Mouse neuroblastoma Neuro2A (N2A) cell lines were purchased from the American Type Culture Collection (ATCC). Cells were grown in DMEM/10% FBS, which is the regular growth media for N2A cells. N2A cells were plated to each well of a 96 well plate (2.5×10⁴/well) with DMEM/10% FBS. The media was changed to DMEM/N2 media 24 h later. After 1 hour, the reagents (20 μM Aβ42 species, compounds, and metals) were added. Due to the poor solubility of compounds in water or media, the final amount of DMSO used was 1% (v:v). After an additional incubation of 40 h, the Alamar blue solution was added in each well and the cells were incubated for 90 min at 37 °C. Absorbance was measured at 570 nm (control OD = 600 nm). For the toxicity studies, three types of Aβ42 species were tested: freshly made monomeric Aβ42 (MAβ42), Aβ42 oligomers (OAβ42), and Aβ42 fibrils (FAβ42). These Aβ42 species were prepared as described above.
Results and Discussion
Synthesis and Characterization of L1 and L2
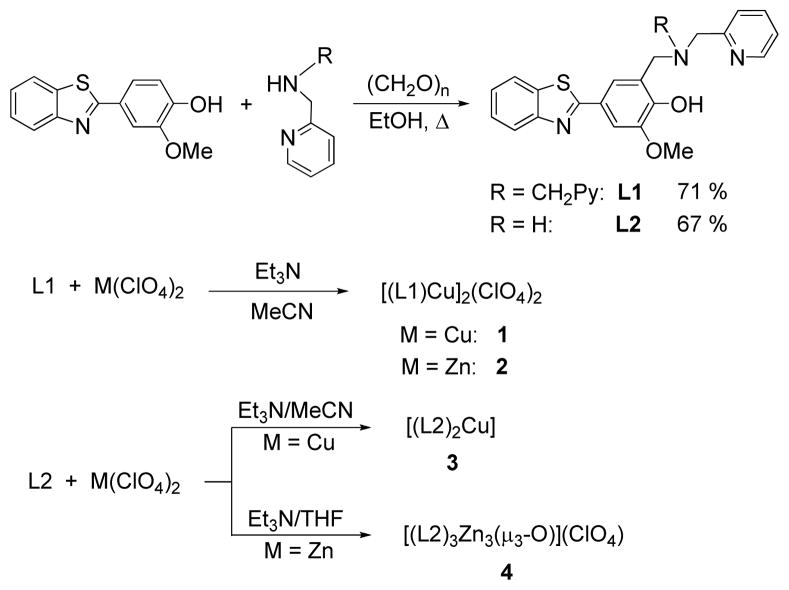
Based on the linkage strategy for bifunctional chelator design (Scheme 1, approach A), we developed two compounds L1 and L2 that contain a 2-phenylbenzothiazole/vanillin group for Aβ binding59 and a N-(2-pyridylmethyl) molecular fragment for metal chelation (Scheme 2).73,74 The two BFCs were synthesized in good yields through the Mannich reaction of 2-(4-hydroxy-3-methoxy)benzothiazole62 with paraformaldehyde and bis-(2-picolyl)amine for L1 or N-methyl-2-pyridinemethanamine for L2 (Scheme 3). The obtained compounds exhibit UV absorption bands in MeCN at 223 nm and 330 nm for L1 and 226 nm and 330 nm for L2 (Figures S8 and S9). Due to the presence of the 2-phenylbenzothiazole group reminiscent of the amyloid-binding fluorescence dye thioflavin T (ThT), L1 and L2 exhibit fluorescence emission at ~450 nm upon excitation at 330 nm, both in MeCN and PBS (Figures S14–S16).
Scheme 3.
Synthesis of BFCs and their metal complexes.
An important aspect of designing molecules for potential use in the central nervous system is their ability to cross the blood-brain barrier (BBB).31,75 Considering the restrictive Lipinski’s rules for BBB penetration (MW ≤ 450, clogP ≤5, hydrogen bond donors ≤ 5, hydrogen bond acceptors ≤ 10, polar surface area ≤ 90 Å2) and the calculated logBB values (Table S2), both L1 and L2 satisfy these requirements, suggesting that these compounds should be capable of crossing the BBB.
Acidity Constants of Compounds L1 and L2
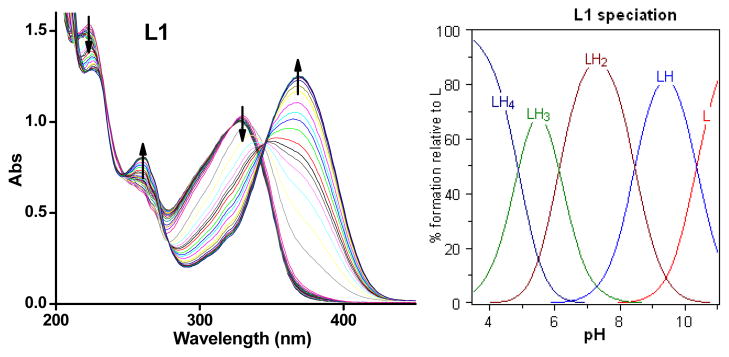
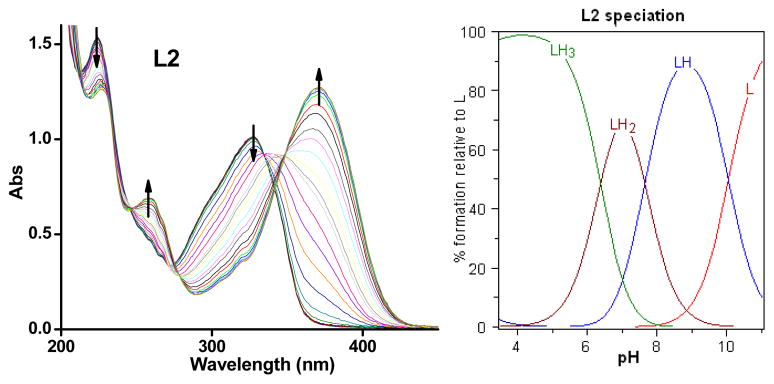
Since both L1 and L2 contain several acidic and basic functional groups, their acidity constants (pKa) were determined by UV-vis spectrophotometric titrations. For L1, UV-vis titrations from pH 3.0 to 11.0 reveal several changes in the spectra (Figure 1). The best fit to the data was obtained with four pKa values: 4.875(5), 6.129(4), 8.462(2) and 10.356(1) (Table 1). Based on previously reported acidity constants for phenols, amines,76 and pyridines,52 we assigned the two lower pKa values to the deprotonation of the two pyridinium groups, and the third pKa value to the ammonium group. The highest pKa value is likely due to phenol deprotonation in L1. For L2, UV-vis titrations from pH 3.0 to 11.0 reveal changes in the spectra (Figure 2) that are also best fit with four pKa values: 1.94(1), 6.393(4), 7.637(7) and 10.037(4) (Table 1). The highest three pKa values can be assigned to the deprotonation of the pyridinium group, the ammonium group, and the phenol group, respectively, similar to the values obtained for L1. In addition, the low pKa value of 1.94(1) is assigned to the deprotonation of the nitrogen atom of the benzothiazole group, similar to previous reports.77
Figure 1.
Variable pH UV spectra of L1 ([L1] = 50 μM, 25 °C, I = 0.1 M NaCl) and species distribution plot.
Table 1.
Acidity constants (pKa’s) of L1 and L2 determined by spectrophotometric titrations (errors are for the last digit).
| Reaction | L1 | L2 |
|---|---|---|
| [H4L]3+= [H3L]2+ + H+ (pKa1) | 4.875(5) | 1.94(1) |
| [H3L]+2= [H2L]+ + H+ (pKa2) | 6.129(4) | 6.393(4) |
| [H2L]+= [HL] + H+ (pKa3) | 8.462(2) | 7.637(7) |
| [HL] = [L]− + H+ (pKa4) | 10.356(1) | 10.037(4) |
Figure 2.
Variable pH (pH 3–11) UV spectra of L2 ([L2] = 50 μM, 25 °C, I = 0.1 M NaCl) and species distribution plot.
Stability Constants for Metal Complexes of L1 and L2
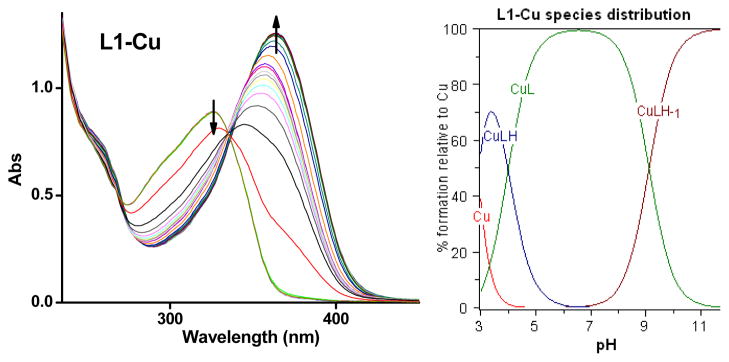
Similar spectrophotometric titrations were performed to determine the stability constants and solution speciation of Cu2+ and Zn2+ with L1 and L2. The pKa values of the ligands and the deprotonation of metal-bound water molecules were included in the calculations.76 The calculated values show that L1 exhibits larger binding constants (logK’s) with Cu2+ and Zn2+ than the L2 ligand (Table 2) as expected given the additional metal-binding N-(2-pyridylmethyl) arm for L2. In addition, both L1 and L2 have a slightly higher affinity for Cu2+ than for Zn2+. A visible spectrophotometric titration performed at a higher concentration of L1 and Cu2+ (0.5 mM) reveals spectral changes corresponding to the formation of the brown Cu(L1) complex and confirms its high logK value (Figure S1).
Table 2.
Stability constants (logK’s) of the Cu2+ and Zn2+ complexes of L1 and L2.
| Reaction | log K | |||
|---|---|---|---|---|
| L1 | L2 | |||
| Cu2+ | Zn2+ | Cu2+ | Zn2+ | |
| M2+ + HL = [MHL]+2 | 3.99(1) | 6.68(5) | 5.30(2) | 6.12(3) |
| M2+ + L− = [ML]+ | 22.00(2) | 16.52(1) | 16.49(1) | 15.19(1) |
| [ML(H2O)]+1 = [ML(OH)] + H+ | −9.11(3) | |||
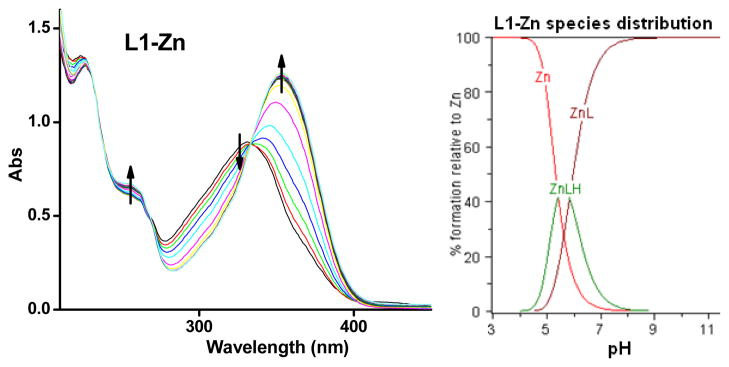
Based on the obtained stability constants, solution speciation diagrams were calculated for Cu2+ and Zn2+ with L1 and L2 (Figures 3, 4, S2, and S3). These diagrams suggest that in all four cases a 1:1 metal:ligand complex is the predominant species formed (vide infra). In addition, Figures 3 and 4 show that the concentration of free Cu2+ with L1 is negligible above pH 4.5, while free Zn2+ is present up to pH 7.0. From the solution speciation diagrams the concentrations of unchelated Cu2+ and Zn2+ (pM = −log[Munchelated]) at a specific pH value and total ion concentration can be calculated (Table 3). These pM values represent a direct estimate of the ligand-metal affinity by taking into account all relevant equilibria and thus can be used to compare the metal affinity among various ligands.76 In our case, the pCu values for L1 are 9.6 and 10.4 at pH 6.6 and 7.4, respectively, while for L2 the values are 7.0 and 7.9, respectively. The pZn values at pH 7.4 were 8.0 and 7.3 for L1 and L2, respectively. Interestingly, these pM values are comparable to those calculated for the strong chelating agent DTPA (diethylenetriaminepentaacetic acid), suggesting that our compounds have a high metal-binding affinity, especially for Cu2+ ions.78
Figure 3.
Variable pH (pH 3–11) UV spectra of L1 and Cu2+ system ([L1] = [Cu2+] = 50 μM, 25 °C, I = 0.1 M NaCl) and species distribution plot.
Figure 4.
Variable pH (pH 3–11) UV spectra of L1 and Zn2+ ([L1] = [Zn2+] = 50 μM, 25 °C, I = 0.1 M NaCl) and species distribution plot.
Table 3.
Calculated pM (−log[M]free; M = Zn2+, Cu2+) for a solution containing a 1:1 metal:ligand mixture ([M2+]tot = [chelator]tot = 50 μM).
| Chelator | pZn | pCu | |
|---|---|---|---|
| pH 7.4 | pH 6.6 | pH 7.4 | |
| L1 | 8.0 | 9.6 | 10.4 |
| L2 | 7.3 | 7.0 | 7.9 |
| DTPAa | 9.3 | 9.7 | 10.7 |
diethylenetriaminepentaacetic acid (DTPA), ref78.
Moreover, the calculated pCu and pZn for L1 and L2 can be used to predict the ability of these compounds to sequester metal ions from metal-Aβ adducts. These pM values represent approximate dissociation constants and compare favorably with the Kd values reported for Cu-Aβ (nM-μM) and Zn-Aβ (μM).26,29,31,57,76,79,80 As such, the metal-binding affinities of L1 and L2 at relevant pH and metal ion concentrations strongly suggest their ability to chelate metal ions from metal-Aβ species, supporting the observed role of these compounds in metal-mediated Aβ aggregation (vide infra).
Characterization of Metal Complexes
The binding stoichiometry of L1 and L2 with Cu and Zn in solution was determined by Job’s plot analysis.81 For L1, a break at 0.5 mole fraction of metal ion suggests the formation of a 1:1 metal complex for both Cu2+ and Zn2+ ions (Figures S4 and S5). For L2, formation of an 1:1 Cu2+ complex in solution is suggested based on the break at 0.5 (Figure S6), while for Zn2+ the break between 0.33 and 0.5 indicates the formation of a mixture of 1:1 and 1:2 Zn:ligand complexes (Figure S7). In addition, the presence of mononuclear Cu complexes in solution for both L1 and L2 was confirmed by the measured magnetic moments of ~1.73 μB/Cu2+.
The Cu and Zn complexes of L1 and L2 were synthesized following common procedures (Scheme 3) and their formation was confirmed by MS, 1H NMR, and UV-vis spectroscopy. Cu complexes 1 and 3 show characteristic d–d transition bands (i.e., 832 nm for 1 and 660 nm for 3) as well as phenolate-to-Cu charge transfer bands (425 nm for 1 and 520 nm for 3, Figures S10 and S12). For Zn2+ complexes 2 and 4, the ligand-based absorption bands at ~330 nm shift to ~350 nm upon complex formation (Figures S11 and S13). As expected, the observed ligand fluorescence is quenched by the Cu2+ ion in 1 and 3. However, the presence of Zn2+ causes a significant enhancement of the emission intensity in 2 and 4, (Figures S17 and S18), similar to the reported Zn fluorescent sensors containing N-(2-pyridylmethyl) arms.73,74
X–ray Structure of Metal Complexes
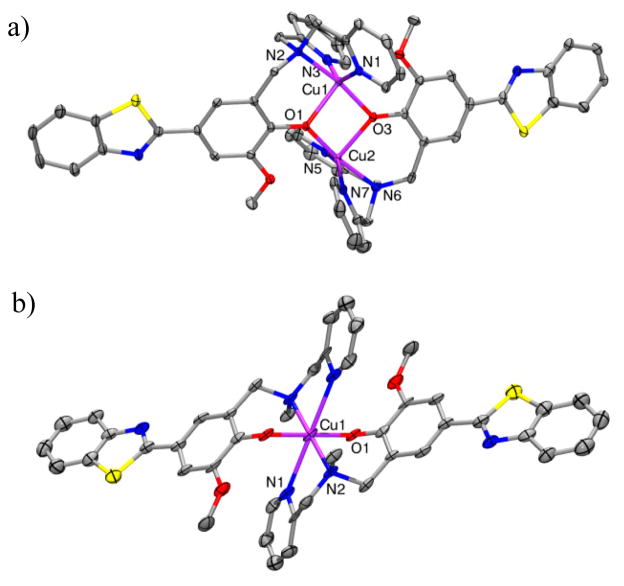
Complexes 1–4 were characterized by X–ray crystallography, and the relevant bond distances and bond angles are given in Tables S3–S6. The structures of the complexes 1 and 2 of L1 with Cu and Zn, respectively, reveal the formation in the solid state of dinuclear complexes with a 2:2 metal:ligand stoichiometry (Scheme 3). Each metal ion is bound to the two pyridine N’s and the amine N atom of one ligand molecule, while the two phenolate O’s bridge the two metal centers (Figures 5a and S19). Both Cu2+ centers in 1 exhibit a distorted square–pyramidal coordination geometry with trigonality index parameters82 τ of 0.32 and 0.44, respectively. By comparison, the τ values of 0.63 and 0.50 support a distorted trigonal bipyramidal geometry for the Zn2+ centers in 2. Interestingly, while L2 forms a 2:1 complex with Cu2+ in which the metal center adopts a pseudo–octahedral coordination environment (Figure 5b), reactions of L2 with Zn2+ leads to formation of a symmetric trinuclear complex 4 in which each Zn center exhibits a distorted square pyramidal geometry with a τ value of 0.29 (Figure S20). Similar to 2, the Zn2+ ions in 4 are bridged by the phenolate O’s of the L2 ligand, and an additional μ3-oxo group bridges all three Zn centers.
Figure 5.
ORTEP view of (a) the dication of 1 and (b) 3 with 50% probability ellipsoids. All hydrogen atoms, counteranions, and solvent molecules are omitted for clarity. Selected bond distances, 1: Cu(1)···Cu(2) 3.0848(2), Cu1–N1 2.0024(19), Cu1–N2 2.0179(18), Cu1–N3 2.022(2), Cu1–O1 2.1260(16), Cu1–O3 1.9357(16), Cu2–N5 1.985(2), Cu2–N6 2.0281(19), Cu2–N7 1.992(2), Cu2–O3 2.1479(16); 3: Cu–N1 2.563(5), Cu–N2 2.102(4), Cu–O1 1.956(4).
While L1 is a tetradentate ligand and thus is expected to form 1:1 Cu and Zn complexes, L2 is a tridentate ligand that can generate metal complexes with different stoichiometry in solution versus the solid state. Notably, while the solid state structure for 3 shows a 1:2 Cu:ligand complex, the Job’s plot analysis and UV-vis titrations suggest the formation of a 1:1 complex in solution. In addition, the Zn-L2 complex 4 is isolated as a 1:1 complex in the solid state, yet the Job’s plot analysis suggests formation of a mixture of 1:1 and 1:2 complexes in solution.
Interaction of L1 and L2 with Aβ Species
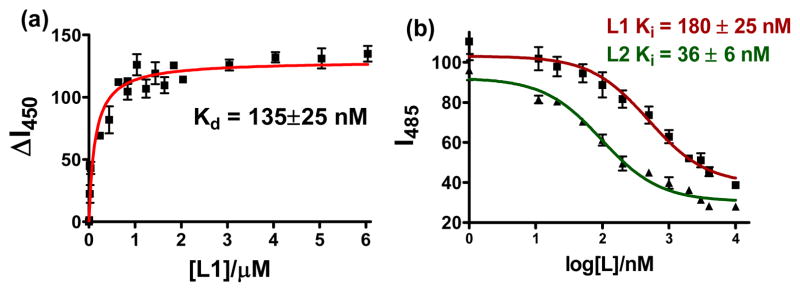
The compounds described herein contain a 2-phenylbenzothiazole fragment reminiscent of Thioflavin T (ThT), a common fluorescent dye used to detect the beta sheet structure of fibrillar Aβ aggregates. In this context, the affinity of L1 and L2 toward Aβ fibrils was investigated by fluorescence spectroscopy. These studies were performed with Aβ fibrils obtained from the Aβ40 peptide, which forms more homogenous fibrillar structures without any non-fibrillar aggregates (Figure S21a).83,84 Interestingly, an increase in the emission intensity of L1 is observed in presence of Aβ fibrils (Figure S22a). When a solution of Aβ fibrils was titrated with L1 and the emission intensity increase corrected for the intrinsic fluorescence of L1, a saturation behavior is observed that is best fit with a one-site binding model to give a Kd of 135±25 nM (Figure 6a). This value suggests that L1 exhibits a high affinity for the Aβ fibrils comparable to other neutral ThT derivatives,83,85 suggesting that appending a metal-binding group to the 2-phenylbenzothiazole fragment does not limit its amyloid binding affinity. By comparison, performing the same titration of Aβ fibrils with ThT yields a Kd of 1.17±0.14 μM (Figure S21b), a value similar to those reported previously.83,85
Figure 6.
(a) Fluorescence titration assay of L1 with Aβ fibrils ([Aβ] = 5 μM, λex/λem = 330/450 nm); (b) ThT fluorescence competition assays with L1 and L2 ([Aβ] = 5 μM, [ThT] = 2 μM).
The L2 compound exhibits an increased fluorescence intensity compared to L1, yet its emission does not change in presence of Aβ fibrils (Figure S22b). This behavior is likely not due to the lack of L2 binding to Aβ fibrils, but is merely a failure of Aβ to impact the fluorescence of L2.86 Indeed, a ThT fluorescence competition assay performed by addition of L1 or L2 to a solution of Aβ fibrils in presence of ThT shows a dramatic decrease in ThT fluorescence upon addition of nanomolar amounts of BFCs. A control experiment performed in absence of Aβ fibrils confirms that L1 and L2 do not quench the ThT fluorescence. Titrations with various amounts of compounds reveal competitive binding curves that yield Ki values 180±25 nM and 36±6 nM for L1 and L2, respectively (Figure 6b).84,85 While the Ki value for L1 is similar to the Kd value obtained directly, the Ki value obtained for L2 shows an even stronger binding affinity to Aβ fibrils. Overall, these studies strongly suggest that the tested BFCs bind tightly to Aβ fibrils and that appending a metal-binding arm to the 2-phenylbenzothiazole group does not negatively affect the amyloid binding affinity of these compounds. While other reported BFCs have employed benzothiazole fragments as amyloid-binding motifs, no binding affinities for the Aβ species have been measured for those systems.49,53,54 Moreover, L1 and L2 represent to the best of our knowledge the first bifunctional metal-chelators for which the Aβ fibril binding affinities were measured directly.87
In order to test the bifunctional character of the synthesized compounds, the Aβ fibrils were treated with Zn2+ ions and employed in a ThT competition assay, in order to test the amyloid-binding ability of L1 and L2 in presence of metal ions. The ThT competition binding assays with the Zn-Aβ fibrils yield Ki value of 275±40 nM and 270±40 nM for L1 and L2, respectively (Figure S23). While the Ki value for L1 in presence of Zn2+ is less than two-fold larger than that in absence of Zn2+, a seven-fold difference is observed for L2. This suggests that the amyloid binding affinity is more sensitive to the presence of metal ions for the latter compound, possibly due to its weaker metal-binding ability and the formation of a 1:2 metal complex in solution (vide supra). Similar amyloid-binding competition assays could not be performed in presence of Cu2+ due to quenching of ThT fluorescence.
Fluorescence Microscopy Binding Assays
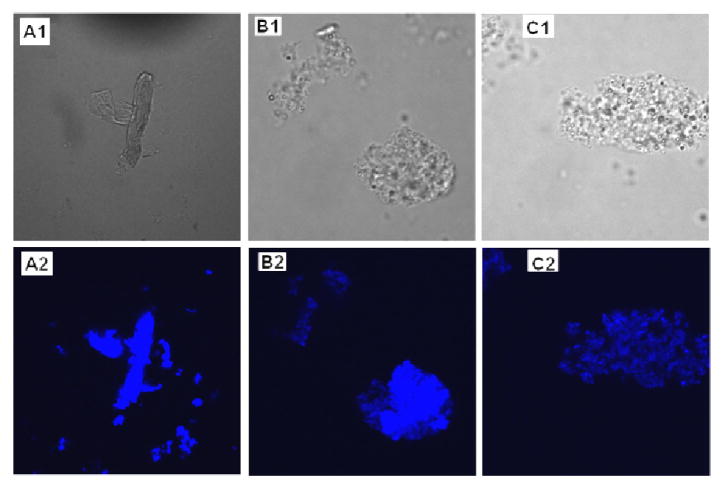
The emission properties of L1 and L2 were further explored by fluorescence microscopy studies of Aβ fibrils, a complementary method for assessing the interaction of such compounds with amyloid fibrils.57 Incubation of ThT, L1, and L2 with Aβ42 fibrils for 10 min followed by fluorescence microscopy imaging shows that the areas rich in Aβ42 aggregates exhibit a bright blue fluorescence, the emission intensity for L1 and L2 being similar to that observed for ThT (Figure 7). These studies provide further evidence that the tested BFCs exhibit both amyloid-binding affinity and fluorescence properties similar to ThT and thus constitute molecular motifs that can be used in future studies for the development of novel amyloid-binding compounds.
Figure 7.
Visualization of Aβ42 fibrils stained with (A) ThT, (B) L1, and (C) L2. Panels A1–C1: phase–contrast microscopy images to account for the presence of fibrils; panels A2–C2: fluorescence microscopy images (magnification = 60x, λex = 405 nm).
Effect of L1 and L2 on Aβ42 Aggregation
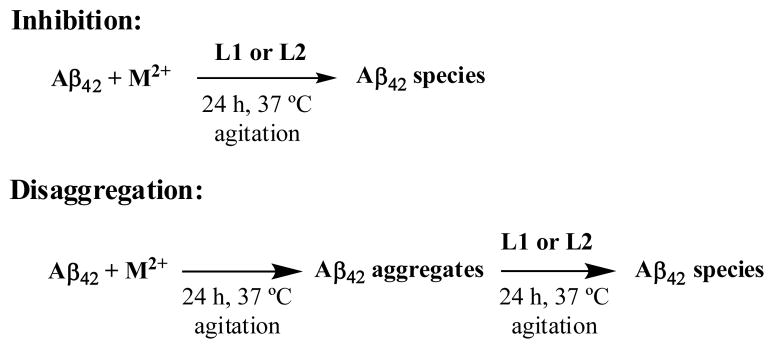
Having confirmed the bifunctionality of L1 and L2 through metal-chelating and Aβ-binding studies, we explored the ability of these molecules to modulate the metal-mediated aggregation of the Aβ42 peptide (Scheme 4). To the best our knowledge, our Aβ aggregation studies with bifunctional chelators are the first to use the more aggregation-prone Aβ42 peptide, which was also shown to form neurotoxic soluble Aβ oligomers.18–20 For these experiments, freshly prepared monomeric Aβ42 solutions were treated with metal ions, BFCs, or both. In these studies, the measurement of ThT fluorescence intensity is not a viable method to quantify the extent of Aβ aggregation, since L1 and L2 dramatically reduce the ThT emission intensity due to their competitive binding to Aβ fibrils (Figure S24). In addition, both Cu2+ and Zn2+ ions lead to a reduced ThT fluorescence, due to emission quenching by the paramagnetic Cu2+ ions or Zn2+-induced formation of non-fibrillar Aβ aggregetes.41,88 A more quantitative analysis of the Aβ aggregation studies is provided by native gel electrophoresis/Western blot analysis and transmission electron microscopy (TEM) techniques. While the former type of analysis reveals the presence of smaller, soluble Aβ aggregates and their molecular weight distribution, the latter method allows the characterization of the larger, insoluble Aβ aggregates that cannot be analyzed by gel electrophoresis. Thus, the use of both these methods provides a more complete picture of the extent and pathways of Aβ aggregation under various conditions.51,52
Scheme 4.
Inhibition and disaggregation experiments
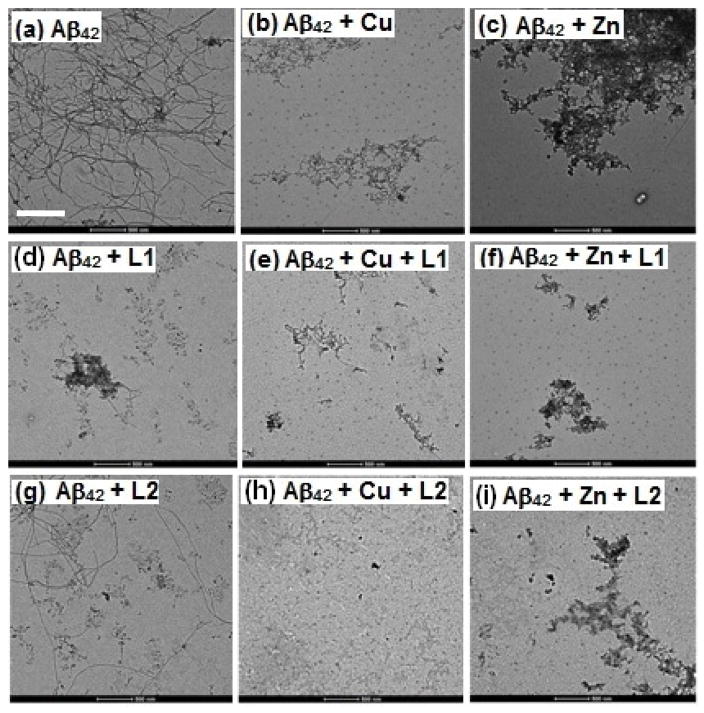
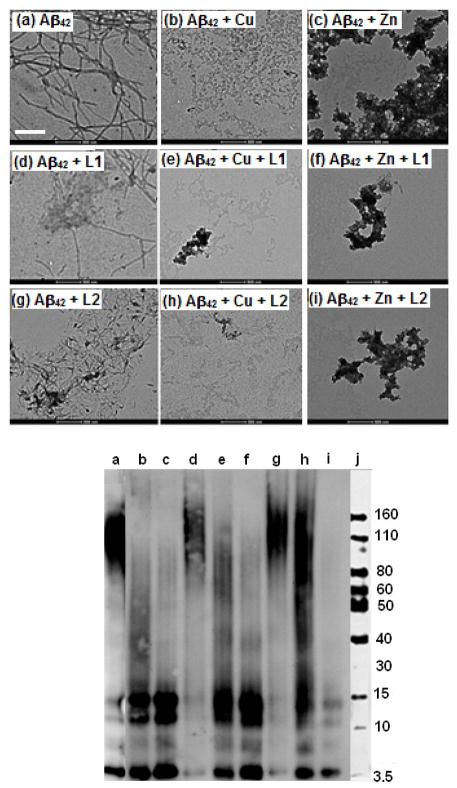
The aggregation of Aβ42 for 24 h at 37 °C leads to well-defined Aβ fibrils, as confirmed by TEM (Figure 8, panel a), and native gel/Western blot analysis shows a small amount of soluble Aβ oligomers (Figure 9, lane a). However, Aβ aggregation in presence of Cu shows formation of almost no Aβ fibrils by TEM (Figure 8, panel b), while Western blotting shows the formation of soluble Aβ42 oligomers with masses in the 10–110 kDa range (Figure 9, lane b). By comparison, the aggregation of Aβ42 in presence of Zn2+ leads to a small amount of amorphous aggregates (Figure 8, panel c), and native gel/Western blot analysis shows formation of soluble Aβ42 oligomers of various sizes (Figure 9, lane c).88 These results suggest that metal ions are able to stabilize the soluble Aβ42 oligomers and thus partially inhibit the Aβ42 aggregation.89 This is in contrast with a large number of reports showing the aggregation-promoting effect of metal ions on the Aβ peptide.23–27,29–32,37,38 However, most of these previous studies have employed the Aβ40 peptide that follows a more direct aggregation pathway to form homogenous, well-defined fibrillar structures.83,84 Detailed metal-mediated aggregation studies of monomeric Aβ42 are currently underway in order to decipher the complex aggregation pathways that include soluble Aβ42 oligomers and non-fibrillar aggregates.90,91
Figure 8.
TEM images of the inhibition of Aβ42 aggregation by L1 and L2, in the presence or absence of metal ions ([Aβ42] = [M2+] = 25 μM, [compound] = 50 μM, 37 °C, 24 h, scale bar = 500 nm). Samples: (a) Aβ42; (b) Aβ42 + Cu2+; (c) Aβ42 + Zn2+; (d) Aβ42 + L1; (e) Aβ42 + L1 + Cu2+; (f) Aβ42 + L1 + Zn2+; (g) Aβ42 + L2; (h) Aβ42 + L2 + Cu2+; (i) Aβ42 + L2 + Zn2+.
Figure 9.
Native gel electrophoresis/Western blot analysis for the inhibition of Aβ42 aggregation by L1 and L2, in the presence or absence of metal ions ([Aβ42] = [M2+] = 25 μM, [compound] = 50 μM, 37 °C, 24 h). Lanes are as follows: (a) Aβ42; (b) Aβ42 + Cu2+; (c) Aβ42 + Zn2+; (d) Aβ42 + L1; (e) Aβ42 + L1 + Cu2+; (f) Aβ42 + L1 + Zn2+; (g) Aβ42 + L2; (h) Aβ42 + L2 + Cu2+; (i) Aβ42 + L2 + Zn2+; and (j) MW marker.
Interestingly, both L1 and L2 were observed to be good inhibitors of aggregation, noticeably fewer Aβ42 fibrils being observed in presence vs. the absence of these compounds (Figure 8, panels d and g). When Aβ aggregation is performed in presence of both compounds and metal ions, TEM analysis shows no Aβ fibril formation. While Cu2+ and L1 or L2 leads to complete disappearance of any large aggregates (Figure 8, panels e and h), the presence of Zn2+ and L1 or L2 generates only a small amount of amorphous nonfibrillar aggregates Figure 8, panels f and i). Native gel/Western blot analysis shows formation of a wide range of soluble Aβ42 oligomers – including higher-mass aggregates, in presence of Cu and L1 or L2 (Figure 9, lanes e and h), L2 having a more pronounced effect. Presence of Zn2+ and L1 or L2 leads to a higher amount of small Aβ42 oligomers with masses of 10–30 kDa (Figure 9, lanes f and i). These studies clearly show the metal ions and compounds tested have an inhibitory effect on Aβ42 fibrillization, suggesting that these bifunctional chelators can modulate the neurotoxicity of the formed Aβ42 species (vide infra).
Disaggregation of Aβ aggregates by L1 and L2
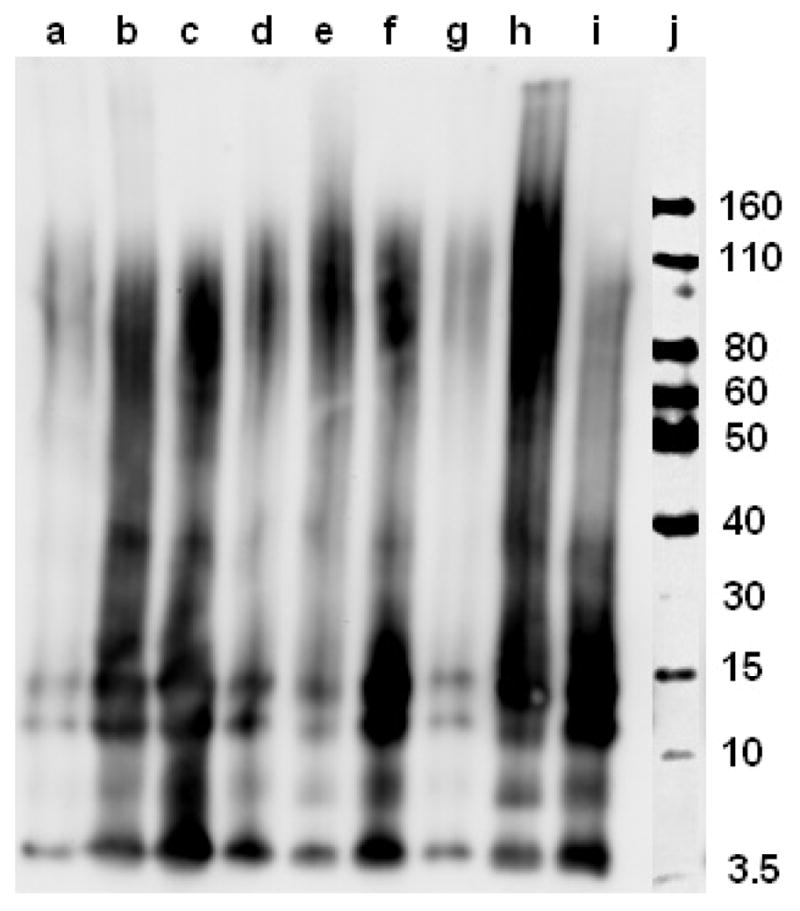
The ability of L1 and L2 to disaggregate pre-formed Aβ42 fibrils was also studied (Scheme 4). The Aβ42 fibrils (formed by incubating for 24 hours at 37 °C) were incubated with BFCs for an additional 24 hours at 37 °C and analyzed by TEM and native gel/Western blotting (Figure 10). The 48 h total incubation leads to mature Aβ42 fibrils, as observed by TEM (Figure 10, panel a) while the Western blot shows the presence of higher order Aβ42 oligomers (Figure 10, lane a), likely due to an assembly-disassembly equilibrium that is established for mature Aβ fibrils.89–91 While the presence of Cu2+ or Zn2+ during the initial 24 h incubation at 37 °C leads to formation of smaller aggregates and soluble oligomers (Figure 8, panels b and c; Figure 9, lanes b and c), the additional 24 h incubation leads to mature Aβ aggregates (Figure 10, panels b and c) along with a decrease in the amount of soluble Aβ oligomers (Figure 10, lanes b and c). Addition of L1 or L2 to Aβ42 fibrils leads to a dissociation of the large Aβ42 aggregates, as observed by TEM (Figure 10, panels d and g), although small Aβ42 fibrils are still present. By contrast, the disaggregation effect of L1 and L2 is more pronounced in presence of Cu2+ or Zn2+. The Cu2+-Aβ42 aggregates are efficiently disassembled by L1 and especially by L2 to form a wide range of soluble Aβ42 oligomers of various sizes (Figure 10, lanes e and h), which are expected to lead to increased neurotoxicity (vide infra). This effect is similar to that observed for the inhibition of Aβ42 aggregation by L1 and L2 in presence of Cu2+ (Figure 9, lanes e and h). The addition of L1 and L2 to Zn2+-Aβ42 aggregates generates a small amount of amorphous nonfibrillar aggregates (Figure 10, panels f and j). Overall, both inhibition and disaggregation studies show that L1 and L2 are able to control the Aβ aggregation process both in the absence and presence of metal ions, highlighting the bifunctional character of these compounds.
Figure 10.
Top: TEM images of Aβ species from disaggregation experiments ([Aβ] = [M2+] = 25 μM, [compound] = 50 μM, 37 °C, 24 h, scale bar = 500 nm). Bottom: Native gel electrophoresis/Western blot analysis, panels and lanes are as follows: (a) Aβ; (b) Aβ + Cu2+; (c) Aβ + Zn2+; (d) Aβ + L1; (e) Aβ + L1 + Cu2+; (f) Aβ + L1 + Zn2+; (g) Aβ + L2; (h) Aβ + L2 + Cu2+; (i) Aβ + L2 + Zn2+; and (j) MW marker.
Control of Cu-Aβ H2O2 Production by L1 and L2
The interaction of the Aβ peptides with redox-active metal ions such as Cu2+ has been proposed to lead to formation of ROS (e.g., H2O2) and oxidative stress associated with Aβ neurotoxicity.3,26–31,33–36 As such, the developed BFCs should ideally be able to control ROS formation.30,36,51 The effect of L1 and L2 on H2O2 production by Cu2+–Aβ42 species was examined using the HRP/Amplex Red assay.35,51,66,72 Under reducing conditions, the Cu2+–Aβ42 species react with O2 to generate H2O2 (Figure S25). Addition of L1 to such a solution reduces the production of H2O2 by >65% for the Cu–Aβ42 species. L2 shows an even more pronounced effect, almost completely eliminating (>90%) H2O2 production (Figure S25). By comparison, other metal chelators such as clioquinol (CQ) and phenanthroline (phen) have almost no effect on H2O2 production, while the strong chelator ethylenediaminetetraacetic acid (EDTA) shows a reduction in H2O2 formation similar to that of L2. Interestingly, the metal-binding compound N-methyl-N,N-bis(2-pyridylmethyl)amine (L*), which resembles the metal-chelating fragments in L1 and L2, exhibits also a dramatic reduction of H2O2 production by Cu2+ and Cu2+–Aβ42 species (Figure S25), suggesting an intrinsic anti-oxidant property of this metal-binding molecular fragment. Overall, these results support not only the strong chelating ability of L1 and L2 for Cu2+, but also their ability to control ROS formation and the redox properties of both free Cu2+ and Cu2+–Aβ42 species, important multifunctional features needed for the future use of these compounds in vivo.
Effect of L1 and L2 on Aβ42 Neurotoxicity in Neuronal Cells
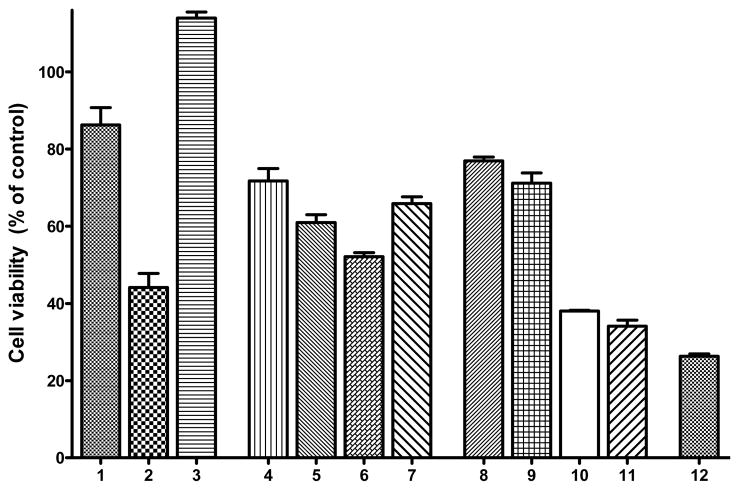
Since metal-Aβ species have been shown to be neurotoxic,25,51,92 development of compounds that will control this toxicity is desired. In this context, we investigated the effect of L1 and L2 on metal-Aβ neurotoxicity in Neuro-2A (N2A)90 cells using an Alamar Blue cell viability assay, which has been shown to give more reproducible results than the MTT assay.93,94 Firstly, we observe a limited neurotoxicity of Aβ42 fibrils (86±8% cell viability, Figure 11, lane 1), while the presence of both Aβ42 fibrils and Cu2+ shows no cell death (Figure 11, lane 3), supporting the previously reported diminished toxicity of Aβ42 fibrils.14–17,19 Secondly, we tested the neurotoxicity of our compounds, which shows that L1 and L2 exhibit 72±4% and 77±2% cell survival, respectively, when used in 2 μM concentrations (Figure 11, lanes 4 and 8). By comparison, the clinically tested compound CQ shows <30% cell survival at concentrations >2 μM, while EDTA shows 90–95% cell survival up to 20 μM concentration (Figure S26).51,52 While our compounds show a more pronounced toxicity at 20 μM, their effect on the metal-Aβ species toxicity can be evaluated at 2 μM given their high affinity for both metal ions and Aβ species.95 The toxicity of L1 and L2 was tested also in presence of Cu2+ to show only a slight decrease in cell viability (Figure 11, lanes 5 and 9).
Figure 11.
Cell viability (% control) upon incubation of Neuro2A cells with (1) Aβ42 fibrils (FAβ42); (2) Aβ42 oligomers (OAβ42); (3) FAβ42 + Cu2+; (4) L1; (5) L1 + Cu2+; (6) MAβ42 + L1 + Cu2+; (7) FAβ42 + L1 + Cu2+; (8) L2; (9) L2 + Cu2+; (10) MAβ42 + L2 + Cu2+; (11) FAβ42 + L2 + Cu2+; and (12) FAβ42 + CQ + Cu2+. Conditions: [Compound] = 2 μM; [Cu2+] = 20 μM; [Aβ42] = 20 μM.
The effect of L1 and L2 on Aβ42-induced neurotoxicity was investigated under both inhibition conditions (i.e., in presence of monomeric Aβ42) and disaggregation conditions (i.e., in presence of pre-formed Aβ42 fibrils). The presence of monomeric Aβ42 (20 μM), L1 (2 μM), and Cu2+ (20 μM) leads to 52±3% cell viability, while a 65±5% cell survival was observed in presence of Aβ42 fibrils (Figure 11, lanes 6 and 7, respectively). Interestingly, treatment of the N2A cells with Aβ42 (20 μM), L2 (2 μM), and Cu2+ (20 μM) dramatically lowers the cell survival to 38±2% under inhibition conditions (Figure 11, lane 10) and 34±4% under disaggregation conditions (Figure 11, lane 11). This increased neurotoxicity of Aβ42 species in presence of Cu2+ and L2 is most likely due to the formation of a range of soluble Aβ42 oligomers of various sizes, as observed by Western blotting in the inhibition and dissagregation studies (lanes h in Figures 9 and 10). This is confirmed by the decreased cell survival of 44±8% in presence of soluble Aβ42 oligomers (Figure 11, lane 2), supporting the increased neurotoxicity of Aβ42 oligomers versus Aβ42 fibrils.16,19 The formation of larger soluble Aβ42 oligomers in presence of L1 is not as pronounced as that observed for L2 (Figures 9 and 10, lanes h vs. e), which likely leads to an increased cell survival for L1 vs. L2 (Figure 11, lanes 10–11 vs. 6–7). As expected, addition of CQ to Aβ42 fibrils in presence of Cu2+ leads to marked cell toxicity (Figure 11, lane 12), likely due to the ability of CQ to disaggregate Aβ fibrils.96
These cell toxicity results provide another perspective on the neurotoxicity of metal-Aβ species. Almost all previous studies investigating the effect of bifunctional compounds on the neurotoxicity of metal-Aβ species have focused on the less neurotoxic and possibly even anti-amyloidogenic Aβ40 peptide.9,97,98 Except for one recent report,99 compounds that inhibit metal-mediated Aβ40 aggregation or promote disaggregation of amyloid fibrils were shown to lead to increased cell viability.49,51,52 However, this approach may not be optimal for the Aβ42 peptide, given the increased toxicity observed for the soluble Aβ42 oligomers.90 Future studies aimed at the development of bifunctional chelators that control the metal-Aβ neurotoxicity in vivo should take into consideration the formation of neurotoxic soluble Aβ42 oligomers and their proposed role in AD neuropathogenesis.
Summary
The use of chemical agents that can modulate the interaction of metal ions with the Aβ peptide can be a useful tool in studying the role of metal ions and metal-Aβ species in AD neuropathogenesis. In this regard, we employed a linking strategy to design a new family of bifunctional chelators that bind metal ions and can also interact with Aβ species. The bifunctional character of the synthesized compounds L1 and L2 was confirmed by metal-chelating and Aβ-binding studies. First, both compounds were found to bind Cu2+ and Zn2+ with high affinities, and their corresponding complexes were synthesized and structurally characterized. Second, L1 and L2 exhibit high affinity toward Aβ species, as determined through fluorescence titration assays and fluorescence microscopy studies. These BFCs were able to inhibit the metal-mediated Aβ aggregation and disassemble pre-formed Aβ fibrils, as well as dramatically reduce H2O2 formation by Cu2+-Aβ species, thus exhibiting also an anti-oxidant functionality. Most notably, this is the first detailed study of the interaction of bifunctional compounds with the more aggregation-prone Aβ42 peptide, which forms neurotoxic soluble Aβ42 oligomers. Intriguingly, the ability of the developed BFCs to inhibit Aβ fibril formation and promote fibril dissagregation leads to increased cellular toxicity, especially for L2, which is likely due to formation of soluble Aβ42 oligomers of various sizes. These studies suggest that the previously employed strategy of inhibiting Aβ40 aggregation and amyloid fibril dissagregation may not be optimal for the Aβ42 peptide, due to formation of neurotoxic soluble Aβ42 oligomers. Future bifunctional chelator design strategies should be aimed at controlling these soluble Aβ42 oligomers, especially for in vivo studies and potential AD therapeutics development.
Supplementary Material
Acknowledgments
We thank the Department of Chemistry at Washington University for startup funds, the Oak Ridge Associated Universities for a Ralph E. Powe Junior Faculty Award to L.M.M., Washington University Knight Alzheimer’s Disease Research Center (NIH P50-AG05681) for a pilot research grant to L.M.M., and NIH P30NS69329 to J.K.. L.M.M. is a Sloan Fellow.
Footnotes
Supporting Information. X–ray crystallographic files in CIF format, crystallographic data for 1–4, spectrophotometric titrations, Job’s plots, UV–vis and fluorescence spectra for L1, L2 and metal complexes, ORTEP plots for 2 and 4, binding studies of L1 and L2 to Aβ fibrils, H2O2 production studies by Aβ-Cu and chelators, cell viability assay for L1, L2, EDTA, and CQ, Aβ aggregation inhibition studies. This material is available free of charge via the Internet at http://pubs.acs.org.
References
- 1.Alzheimer’s Disease Facts and Figures Annual Report from www.alz.org.
- 2.Ferri CP, Prince M, Brayne C, Brodaty H, Fratiglioni L, Ganguli M, Hall K, Hasegawa K, Hendrie H, Huang YQ, Jorm A, Mathers C, Menezes PR, Rimmer E, Scazufca M. Lancet. 2005;366:2112. doi: 10.1016/S0140-6736(05)67889-0. [DOI] [PMC free article] [PubMed] [Google Scholar]
- 3.Jakob-Roetne R, Jacobsen H. Angew Chem Int Ed. 2009;48:3030. doi: 10.1002/anie.200802808. [DOI] [PubMed] [Google Scholar]
- 4.Perrin RJ, Fagan AM, Holtzman DM. Nature. 2009;461:916. doi: 10.1038/nature08538. [DOI] [PMC free article] [PubMed] [Google Scholar]
- 5.LaFerla FM, Green KN, Oddo S. Nat Rev Neurosci. 2007;8:499. doi: 10.1038/nrn2168. [DOI] [PubMed] [Google Scholar]
- 6.Roher AE, Lowenson JD, Clarke S, Woods AS, Cotter RJ, Gowing E, Ball MJ. Proc Natl Acad Sci USA. 1993;90:10836. doi: 10.1073/pnas.90.22.10836. [DOI] [PMC free article] [PubMed] [Google Scholar]
- 7.Jarrett JT, Berger EP, Lansbury PT. Biochemistry. 1993;32:4693. doi: 10.1021/bi00069a001. [DOI] [PubMed] [Google Scholar]
- 8.McGowan E, et al. Neuron. 2005;47:191. doi: 10.1016/j.neuron.2005.06.030. [DOI] [PMC free article] [PubMed] [Google Scholar]
- 9.Kim J, Onstead L, Randle S, Price R, Smithson L, Zwizinski C, Dickson DW, Golde T, McGowan E. J Neurosci. 2007;27:627. doi: 10.1523/JNEUROSCI.4849-06.2007. [DOI] [PMC free article] [PubMed] [Google Scholar]
- 10.Kuperstein I, et al. EMBO J. 2010;29:3408. doi: 10.1038/emboj.2010.211. [DOI] [PMC free article] [PubMed] [Google Scholar]
- 11.Pauwels K, Williams TL, Morris KL, Jonckheere W, Vandersteen A, Kelly G, Schymkowitz J, Rousseau F, Pastore A, Serpell LC, Broersen K. J Biol Chem. 2012;287:5650. doi: 10.1074/jbc.M111.264473. [DOI] [PMC free article] [PubMed] [Google Scholar]
- 12.Hardy JA, Higgins GA. Science. 1992;256:184. doi: 10.1126/science.1566067. [DOI] [PubMed] [Google Scholar]
- 13.Hardy J, Selkoe DJ. Science. 2002;297:353. doi: 10.1126/science.1072994. [DOI] [PubMed] [Google Scholar]
- 14.Lambert MP, Barlow AK, Chromy BA, Edwards C, Freed R, Liosatos M, Morgan TE, Rozovsky I, Trommer B, Viola KL, Wals P, Zhang C, Finch CE, Krafft GA, Klein WL. Proc Nat Acad Sci USA. 1998;95:6448. doi: 10.1073/pnas.95.11.6448. [DOI] [PMC free article] [PubMed] [Google Scholar]
- 15.Hsia AY, Masliah E, McConlogue L, Yu GQ, Tatsuno G, Hu K, Kholodenko D, Malenka RC, Nicoll RA, Mucke L. Proc Natl Acad Sci. 1999;96:3228. doi: 10.1073/pnas.96.6.3228. [DOI] [PMC free article] [PubMed] [Google Scholar]
- 16.Lesne S, Koh MT, Kotilinek L, Kayed R, Glabe CG, Yang A, Gallagher M, Ashe KH. Nature. 2006;440:352. doi: 10.1038/nature04533. [DOI] [PubMed] [Google Scholar]
- 17.Ahmed M, Davis J, Aucoin D, Sato T, Ahuja S, Aimoto S, Elliott JI, Van Nostrand WE, Smith SO. Nat Struct Mol Biol. 2011;17:561. doi: 10.1038/nsmb.1799. [DOI] [PMC free article] [PubMed] [Google Scholar]
- 18.Gong YS, Chang L, Viola KL, Lacor PN, Lambert MP, Finch CE, Krafft GA, Klein WL. Proc Nat Acad Sci USA. 2003;100:10417. doi: 10.1073/pnas.1834302100. [DOI] [PMC free article] [PubMed] [Google Scholar]
- 19.Walsh DM, Selkoe DJ. J Neurochem. 2007;101:1172. doi: 10.1111/j.1471-4159.2006.04426.x. [DOI] [PubMed] [Google Scholar]
- 20.Haass C, Selkoe DJ. Nat Rev Mol Cell Biol. 2007;8:101. doi: 10.1038/nrm2101. [DOI] [PubMed] [Google Scholar]
- 21.Borutaite V, Morkuniene R, Valincius G. BioMol Concepts. 2011;2:211. doi: 10.1515/bmc.2011.019. [DOI] [PubMed] [Google Scholar]
- 22.Mucke L. Nature. 2009;461:895. doi: 10.1038/461895a. [DOI] [PubMed] [Google Scholar]
- 23.Lovell MA, Robertson JD, Teesdale WJ, Campbell JL, Markesbery WR. J Neuro Sci. 1998;158:47. doi: 10.1016/s0022-510x(98)00092-6. [DOI] [PubMed] [Google Scholar]
- 24.Barnham KJ, Masters CL, Bush AI. Nat Rev Drug Disc. 2004;3:205. doi: 10.1038/nrd1330. [DOI] [PubMed] [Google Scholar]
- 25.Bush AI. Neurobiol Aging. 2002;23:1031. doi: 10.1016/s0197-4580(02)00120-3. [DOI] [PubMed] [Google Scholar]
- 26.Faller P, Hureau C. Dalton Trans. 2009:108. doi: 10.1039/b813398k. [DOI] [PubMed] [Google Scholar]
- 27.Faller P. ChemBioChem. 2009;10:2837. doi: 10.1002/cbic.200900321. [DOI] [PubMed] [Google Scholar]
- 28.Zatta P, Drago D, Bolognin S, Sensi SL. Trends Pharmacol Sci. 2009;30:346. doi: 10.1016/j.tips.2009.05.002. [DOI] [PubMed] [Google Scholar]
- 29.Gaggelli E, Kozlowski H, Valensin D, Valensin G. Chem Rev. 2006;106:1995. doi: 10.1021/cr040410w. [DOI] [PubMed] [Google Scholar]
- 30.Rauk A. Chem Soc Rev. 2009;38:2698. doi: 10.1039/b807980n. [DOI] [PubMed] [Google Scholar]
- 31.Scott LE, Orvig C. Chem Rev. 2009;109:4885. doi: 10.1021/cr9000176. [DOI] [PubMed] [Google Scholar]
- 32.Karr JW, Kaupp LJ, Szalai VA. J Am Chem Soc. 2004;126:13534. doi: 10.1021/ja0488028. [DOI] [PubMed] [Google Scholar]
- 33.Cappai R, Barnham K. Neurochem Res. 2008;33:526. doi: 10.1007/s11064-007-9469-8. [DOI] [PubMed] [Google Scholar]
- 34.Zhu X, Su B, Wang X, Smith M, Perry G. Cell Mol Life Sci. 2007;64:2202. doi: 10.1007/s00018-007-7218-4. [DOI] [PMC free article] [PubMed] [Google Scholar]
- 35.Hureau C, Faller P. Biochimie. 2009;91:1212. doi: 10.1016/j.biochi.2009.03.013. [DOI] [PubMed] [Google Scholar]
- 36.Molina-Holgado F, Hider R, Gaeta A, Williams R, Francis P. BioMetals. 2007;20:639. doi: 10.1007/s10534-006-9033-z. [DOI] [PubMed] [Google Scholar]
- 37.Atwood CS, Moir RD, Huang XD, Scarpa RC, Bacarra NME, Romano DM, Hartshorn MK, Tanzi RE, Bush AI. J Biol Chem. 1998;273:12817. doi: 10.1074/jbc.273.21.12817. [DOI] [PubMed] [Google Scholar]
- 38.Atwood CS, Scarpa RC, Huang XD, Moir RD, Jones WD, Fairlie DP, Tanzi RE, Bush AI. J Neurochem. 2000;75:1219. doi: 10.1046/j.1471-4159.2000.0751219.x. [DOI] [PubMed] [Google Scholar]
- 39.Yoshiike Y, Tanemura K, Murayama O, Akagi T, Murayama M, Sato S, Sun XY, Tanaka N, Takashima A. J Biol Chem. 2001;276:32293. doi: 10.1074/jbc.M010706200. [DOI] [PubMed] [Google Scholar]
- 40.Zou J, Kajita K, Sugimoto N. Angew Chem Int Ed. 2001;40:2274. [PubMed] [Google Scholar]
- 41.Tõugu V, Karafin A, Zovo K, Chung RS, Howells C, West AK, Palumaa P. J Neurochem. 2009;110:1784. doi: 10.1111/j.1471-4159.2009.06269.x. [DOI] [PubMed] [Google Scholar]
- 42.Bush AI. Curr Opin Chem Biol. 2000;4:184. doi: 10.1016/s1367-5931(99)00073-3. [DOI] [PubMed] [Google Scholar]
- 43.Bush AI. Trends Neurosci. 2003;26:207. doi: 10.1016/S0166-2236(03)00067-5. [DOI] [PubMed] [Google Scholar]
- 44.Cherny RA, et al. Neuron. 2001;30:665. doi: 10.1016/s0896-6273(01)00317-8. [DOI] [PubMed] [Google Scholar]
- 45.Barnham KJ, Bush AI. Curr Opin Chem Biol. 2008;12:222. doi: 10.1016/j.cbpa.2008.02.019. [DOI] [PubMed] [Google Scholar]
- 46.Cahoon L. Nat Med. 2009;15:356. doi: 10.1038/nm0409-356. [DOI] [PubMed] [Google Scholar]
- 47.Arbiser JL, Kraeft SK, Van Leeuwen R, Hurwitz SJ, Selig M, Dickerson GR, Flint A, Byers HR, Chen LB. Mol Med. 1998;4:665. [PMC free article] [PubMed] [Google Scholar]
- 48.Adlard PA, et al. Neuron. 2008;59:43. doi: 10.1016/j.neuron.2008.06.018. [DOI] [PubMed] [Google Scholar]
- 49.Scott LE, Telpoukhovskaia M, Rodriguez-Rodriguez C, Merkel M, Bowen ML, Page BDG, Green DE, Storr T, Thomas F, Allen DD, Lockman PR, Patrick BO, Adam MJ, Orvig C. Chem Sci. 2011;2:642. [Google Scholar]
- 50.Perez LR, Franz KJ. Dalton Trans. 2011;39:2177. doi: 10.1039/b919237a. [DOI] [PMC free article] [PubMed] [Google Scholar]
- 51.Hindo SS, Mancino AM, Braymer JJ, Liu YH, Vivekanandan S, Ramamoorthy A, Lim MH. J Am Chem Soc. 2009;131:16663. doi: 10.1021/ja907045h. [DOI] [PMC free article] [PubMed] [Google Scholar]
- 52.Choi JS, Braymer JJ, Nanga RPR, Ramamoorthy A, Lim MH. Proc Natl Acad Sci. 2010;107:21990. doi: 10.1073/pnas.1006091107. [DOI] [PMC free article] [PubMed] [Google Scholar]
- 53.Zhang Y, Chen LY, Yin WX, Yin J, Zhang SB, Liu CL. Dalton Trans. 2011;40:4830. doi: 10.1039/c1dt00020a. [DOI] [PubMed] [Google Scholar]
- 54.Dedeoglu A, Cormier K, Payton S, Tseitlin KA, Kremsky JN, Lai L, Li XH, Moir RD, Tanzi RE, Bush AI, Kowall NW, Rogers JT, Huang XD. Exp Gerontol. 2004;39:1641. doi: 10.1016/j.exger.2004.08.016. [DOI] [PubMed] [Google Scholar]
- 55.Hureau C, Sasaki I, Gras E, Faller P. ChemBioChem. 2010;11:950. doi: 10.1002/cbic.201000102. [DOI] [PubMed] [Google Scholar]
- 56.Choi J-S, Braymer JJ, Park SK, Mustafa S, Chae J, Lim MH. Metallomics. 2011;3:284. doi: 10.1039/c0mt00077a. [DOI] [PubMed] [Google Scholar]
- 57.Rodriguez-Rodriguez C, de Groot NS, Rimola A, Alvarez-Larena A, Lloveras V, Vidal-Gancedo J, Ventura S, Vendrell J, Sodupe M, Gonzalez-Duarte P. J Am Chem Soc. 2009;131:1436. doi: 10.1021/ja806062g. [DOI] [PubMed] [Google Scholar]
- 58.Braymer JJ, DeToma AS, Choi JS, Ko KS, Lim MH. Int J Alzheimers Dis. 2011;2011:623051. doi: 10.4061/2011/623051. [DOI] [PMC free article] [PubMed] [Google Scholar]
- 59.Necula M, Kayed R, Milton S, Glabe CG. J Biol Chem. 2007;282:10311. doi: 10.1074/jbc.M608207200. [DOI] [PubMed] [Google Scholar]
- 60.Evans DF. J Chem Soc. 1959:2003. [Google Scholar]
- 61.De Buysser K, Herman GG, Bruneel E, Hoste S, Van Driessche I. Chem Phys. 2005;315:286. [Google Scholar]
- 62.Mashraqui SH, Kumar S, Vashi D. J Inclusion Phenom Macro. 2004;48:125. [Google Scholar]
- 63.Gans P, Sabatini A, Vacca A. Ann Chim. 1999:45. [Google Scholar]
- 64.Alderighi L. Coord Chem Rev. 1999;184:311. [Google Scholar]
- 65.Klein WL. Neurochem Int. 2002;41:345. doi: 10.1016/s0197-0186(02)00050-5. [DOI] [PubMed] [Google Scholar]
- 66.Himes RA, Park GY, Siluvai GS, Blackburn NJ, Karlin KD. Angew Chem Int Ed. 2008;47:9084. doi: 10.1002/anie.200803908. [DOI] [PMC free article] [PubMed] [Google Scholar]
- 67.Mohanty JG, Jaffe JS, Schulman ES, Raible DG. J Immunol Meth. 1997;202:133. doi: 10.1016/s0022-1759(96)00244-x. [DOI] [PubMed] [Google Scholar]
- 68.Zhou M, Diwu Z, Panchuk-Voloshina N, Haugland RP. Anal Biochem. 1997;253:162. doi: 10.1006/abio.1997.2391. [DOI] [PubMed] [Google Scholar]
- 69.Richer SC, Ford WCL. Mol Hum Reprod. 2001;7:237. doi: 10.1093/molehr/7.3.237. [DOI] [PubMed] [Google Scholar]
- 70.Votyakova TV, Reynolds IJ. J Neurochem. 2001;79:266. doi: 10.1046/j.1471-4159.2001.00548.x. [DOI] [PubMed] [Google Scholar]
- 71.Dickens MG, Franz KJ. ChemBioChem. 2010;11:59. doi: 10.1002/cbic.200900597. [DOI] [PMC free article] [PubMed] [Google Scholar]
- 72.Folk DS, Franz KJ. J Am Chem Soc. 2010;132:4994. doi: 10.1021/ja100943r. [DOI] [PMC free article] [PubMed] [Google Scholar]
- 73.Nolan EM, Lippard SJ. Acc Chem Res. 2008;42:193. doi: 10.1021/ar8001409. [DOI] [PMC free article] [PubMed] [Google Scholar]
- 74.Tomat E, Lippard SJ. Curr Opin Chem Biol. 2010;14:225. doi: 10.1016/j.cbpa.2009.12.010. [DOI] [PMC free article] [PubMed] [Google Scholar]
- 75.Lipinski CA, Lombardo F, Dominy BW, Feeney PJ. Adv Drug Del Rev. 2001;46:3. doi: 10.1016/s0169-409x(00)00129-0. [DOI] [PubMed] [Google Scholar]
- 76.Storr T, Merkel M, Song-Zhao GX, Scott LE, Green DE, Bowen ML, Thompson KH, Patrick BO, Schugar HJ, Orvig C. J Am Chem Soc. 2007;129:7453. doi: 10.1021/ja068965r. [DOI] [PubMed] [Google Scholar]
- 77.Perrin DD. Dissociation constants of organic bases in aqueous solution. Butterworths; London: 1972. [Google Scholar]
- 78.Martell AE, Smith RM. Critical Stability Constants. IV Plenum; New York: 1976. [Google Scholar]
- 79.Danielsson J, Pierattelli R, Banci L, Gräslund A. FEBS Journal. 2007;274:46. doi: 10.1111/j.1742-4658.2006.05563.x. [DOI] [PubMed] [Google Scholar]
- 80.Hou L, Zagorski MG. J Am Chem Soc. 2006;128:9260. doi: 10.1021/ja046032u. [DOI] [PubMed] [Google Scholar]
- 81.Huang CY. Methods Enzymol. 1982;87:509. doi: 10.1016/s0076-6879(82)87029-8. [DOI] [PubMed] [Google Scholar]
- 82.Addison AW, Rao TN, Reedijk J, van Rijn J, Verschoor GC. J Chem Soc, Dalton Trans. 1984:1349. [Google Scholar]
- 83.Klunk WE, Wang YM, Huang GF, Debnath ML, Holt DP, Mathis CA. Life Sci. 2001;69:1471. doi: 10.1016/s0024-3205(01)01232-2. [DOI] [PubMed] [Google Scholar]
- 84.Lockhart A, Ye L, Judd DB, Merritt AT, Lowe PN, Morgenstern JL, Hong GZ, Gee AD, Brown J. J Biol Chem. 2005;280:7677. doi: 10.1074/jbc.M412056200. [DOI] [PubMed] [Google Scholar]
- 85.Yona RL, Mazeres S, Faller P, Gras E. ChemMedChem. 2008;3:63. doi: 10.1002/cmdc.200700188. [DOI] [PubMed] [Google Scholar]
- 86.Reinke AA, Seh HY, Gestwicki JE. Bioorg Med Chem Lett. 2009;19:4952. doi: 10.1016/j.bmcl.2009.07.082. [DOI] [PMC free article] [PubMed] [Google Scholar]
- 87.Only one other study reports the Aβ-binding affinity of rhenium complexes of 2-phenylbenzothiazole derivatives: KS, Debnath MLMCA, Klunk WE. Bioorg Med Chem Lett. 2009;19:2258. doi: 10.1016/j.bmcl.2009.02.096.
- 88.Garai K, Sahoo B, Kaushalya SK, Desai R, Maiti S. Biochemistry. 2007;46:10655. doi: 10.1021/bi700798b. [DOI] [PubMed] [Google Scholar]
- 89.Tew DJ, Bottomley SP, Smith DP, Ciccotosto GD, Babon J, Hinds MG, Masters CL, Cappai R, Barnham KJ. Biophys J. 2008;94:2752. doi: 10.1529/biophysj.107.119909. [DOI] [PMC free article] [PubMed] [Google Scholar]
- 90.Dahlgren KN, Manelli AM, Stine WB, Baker LK, Krafft GA, LaDu MJ. J Biol Chem. 2002;277:32046. doi: 10.1074/jbc.M201750200. [DOI] [PubMed] [Google Scholar]
- 91.Stine WB, Dahlgren KN, Krafft GA, LaDu MJ. J Biol Chem. 2003;278:11612. doi: 10.1074/jbc.M210207200. [DOI] [PubMed] [Google Scholar]
- 92.Huang XD, et al. J Biol Chem. 1999;274:37111. doi: 10.1074/jbc.274.52.37111. [DOI] [PubMed] [Google Scholar]
- 93.Wogulis M, Wright S, Cunningham D, Chilcote T, Powell K, Rydel RE. J Neurosci. 2005;25:1071. doi: 10.1523/JNEUROSCI.2381-04.2005. [DOI] [PMC free article] [PubMed] [Google Scholar]
- 94.Stine BW, Jungbauer L, Yu C, LaDu MJ. Met Mol Biol. 2010;670:13. doi: 10.1007/978-1-60761-744-0_2. [DOI] [PMC free article] [PubMed] [Google Scholar]
- 95.The inhibition of Aβ42 aggregation in presence of 2 μM and 10 μM of L1 or L2 was also investigated by TEM and Western blotting and gave similar results (Figures S27 and S28)
- 96.Mancino AM, Hindo SS, Kochi A, Lim MH. Inorg Chem. 2009;48:9596. doi: 10.1021/ic9014256. [DOI] [PubMed] [Google Scholar]
- 97.Murray MM, Bernstein SL, Nyugen V, Condron MM, Teplow DB, Bowers MT. J Am Chem Soc. 2009;131:6316. doi: 10.1021/ja8092604. [DOI] [PMC free article] [PubMed] [Google Scholar]
- 98.Yan Y, Wang C. J Mol Biol. 2007;369:909. doi: 10.1016/j.jmb.2007.04.014. [DOI] [PubMed] [Google Scholar]
- 99.A recent study reports a bifunctional compound that leads to increased metal-based Aβ40 neurotoxicity, although the formation of soluble Aβ oligomers was not unambiguously demonstrated (Ref. 53).
Associated Data
This section collects any data citations, data availability statements, or supplementary materials included in this article.


