

Abstract
Homocysteine is an amino acid required for the metabolism of methionine. Excess homocysteine is implicated in cardiovascular and neurological disease and new data suggest a role in various retinopathies. Mice lacking cystathionine-beta-synthase (cbs−/−) have an excess of retinal homocysteine and develop anatomical abnormalities in multiple retinal layers, including photoreceptors and ganglion cells; heterozygous (cbs+/−) mice demonstrate ganglion cell loss and mitochondrial abnormalities in the optic nerve. The purpose of the present study was to determine whether elevated homocysteine, due to absent or diminished cbs, alters visual function. We examined cbs−/− (3 weeks) and cbs−+/− mice (5, 10, 15, 30 weeks) and results were compared to those obtained from wildtype (WT) littermates. Light- and dark-adapted ERGs were recorded along with dc-ERG to assess retinal pigment epithelial (RPE) function. The visual evoked potential (VEP) was used to assess transmission to the visual cortex. The amplitudes of the major ERG components were reduced in cbs−/− mice at age 3 weeks and VEPs were delayed markedly. These findings are consistent with the early retinal disruption observed anatomically in these mice. In comparison, at 3 weeks of age, responses of cbs+/− mice did not differ significantly from those of WT mice. Functional abnormalities were not observed in cbs+/− mice until 15 weeks of age, at which time amplitude reductions were noted for the ERG a- and b-wave and the light peak component, but not for other components generated by the RPE. VEP implicit times were delayed in cbs+/− mice at 15 and 30 weeks. The later onset of functional defects in cbs+/− mice is consistent with a slow loss of ganglion cells reported previously in the heterozygous mutant. Light peak abnormalities indicate that RPE function is also compromised in older cbs+/− mice. The data suggest that severe elevations of homocysteine are associated with marked alterations of retinal function while modest homocysteine elevation is reflected in modest and delayed alterations of retinal function. The work lays the foundation to explore the role of homocysteine in retinal diseases such as glaucoma and optic neuropathy.
Keywords: electroretinogram, visual evoked potential, retina, optic nerve, mouse, retinal function, electrophysiology, retinal degeneration
1. Introduction
Homocysteine, a nonproteinogenic and sulfur-containing amino acid, is an intermediate compound in methionine metabolism. Excess homocysteine is detrimental to normal physiological function; hence homocysteine is typically remethylated to methionine or converted via the transsulfuration pathway to cysteine under the control of the enzyme cystathionine-beta-synthase (CBS). CBS activity plays a critical role in regulating homocysteine concentrations, and CBS dysfunction is associated with elevated homocysteine levels. In human, CBS mutations underlie a complex phenotype with ocular, skeletal, neurological and cardiovascular components (Mudd, 2011).
In patient-based studies, elevated homocysteine has been detected in a number of clinical conditions affecting the eye, including AMD (Axer-Siegel et al., 2004; Seddon et al., 2006); maculopathy and retinal degeneration (Tsina et al., 2005); primary and secondary open-angle glaucoma (Bleich et al., 2002); exfoliative glaucoma (Vessani et al., 2003), pigmentary glaucoma (Jaksic et al, 2010 ), proliferative vitreoretinopathy (Aydemir et al., 2008), type 2 diabetes mellitus (Yang et al., 2002), central retinal vein occlusion (Lahey et al., 2003). Poloschek et al. (2005) reported abnormal electroretinograms (ERGs) and visual evoked potentials (VEPs) in a child with severe hyperhomocysteinemia due to methionine synthase deficiency.
To understand mechanisms of homocysteine-induced disruption of retina, in vitro and in vivo model systems have been used. Homocysteine upregulates VEGF expression and induces ER stress in cultured ARPE-19 cells (Roybal et al., 2004). It induces apoptotic death in the RGC-5 cell line (Ganapathy et al, 2010) and very modest levels of homocysteine induce apoptotic death of primary ganglion cells harvested from neonatal mice (Dun et al, 2007). Analysis of retinas of mice in which high concentrations of homocysteine were administered via an intravitreal route revealed marked ganglion cell loss and disruption of the inner retina within a few days of injection (Moore et al., 2001) and significant loss of photoreceptor cells when the retinas were exposed to homocysteine for several months (Chang et al., 2011). The availability of a mouse in which the cbs gene is deleted (cbs−/−) (Watanabe et al., 1995) has permitted analysis of the effects of endogenous elevation of homocysteine on retinal neurons. Depending upon whether the mouse has one cbs allele (cbs+/−) or no copies of cbs (cbs−/−), the plasma homocysteine ranges from moderate to severe, respectively. Comprehensive morphological analysis of retinas of homozygous mutant mice (cbs−/−) revealed alterations in the RPE, loss of cells in the ganglion cell layer, and marked disruption of the inner/outer nuclear retinal layers (Ganapathy et al., 2009). These mice have ~30-fold increase in plasma homocysteine, ~7-fold increase in retinal homocysteine and a lifespan of ~3–5 weeks; they are a model of severe hyperhomocysteinemia (Watanabe et al., 1995). Analysis of retinas of heterozygous mice (cbs+/−) reveals a much milder phenotype characterized by modest cell loss in the ganglion cell layer and decreased thickness of the inner plexiform and nuclear layers. Gross disruption of the retina has not been observed in heterozygous mice (cbs+/−), which have ~4–7- fold increase in plasma homocysteine and reflect moderate hyperhomocysteinemia. Interestingly, the retinal ganglion cell loss is accompanied by alterations of the mitochondria of the nerve fiber layer detectable at the ultrastructural level and by increased expression of two mitochondrial proteins, Opa1 and Fis1 (Ganapathy et al., 2011). Thus, the histological appearance of retinas of the cbs mutant mice has been analyzed comprehensively; however it is not known what functional alterations accompany these retinal abnormalities. The present study addressed this by using visual electrophysiological protocols to study cbs mutant mice at different ages.
2. Methods
2.1. Mice
Generation of mice deficient in cbs was reported by Watanabe et al. (1995) and a colony of mice has been established at the Jackson Laboratories (Bar Harbor, ME). Breeding pairs of cbs+/− mice (B6.129P2-Cbstm1Unc/J) were used to generate cbs−/−, cbs+/− and cbs+/+ mice. Genotyping, husbandry and housing conditions for the mice were as described (Ganapathy et al., 2009). All experiments involving mice were approved by the Institutional Animal Care and Use Committee of the Cleveland Clinic Foundation and adhered to the ARVO Statement for the Use of Animals in Ophthalmic and Vision Research.
2.2. Visual Electrophysiology
Three recording protocols were used. All were conducted following overnight dark adaptation, after which mice were anesthetized with ketamine (80 mg/kg) and xylazine (16 mg/kg), and placed on a temperature-regulated heating pad. The pupils were dilated with eyedrops (2.5% phenylephrine HCl, 1% cyclopentolate, 1% tropicamide); for ERG studies, the corneal surface was anesthetized with 1% proparacaine HCL eyedrops.
2.2.1. Dark- and light-adapted ERG
To evaluate responses of the outer retina, we used a conventional strobe-flash ERG protocol. The ERG was recorded using a stainless-steel wire active electrode that contacted the corneal surface through 1% methylcellulose. Needle electrodes placed in the cheek and tail served as reference and ground leads, respectively. Responses were differentially amplified (0.3–1,500 Hz), averaged, and stored using a UTAS E-3000 signal averaging system (LKC Technologies, Gaithersburg, MD). Strobe flash stimuli were initially presented in darkness within a ganzfeld bowl; across-trials flash luminance ranged from 3.6 to 2.1 log cd s/m2. Stimuli were presented in order of increasing luminance and the interstimulus interval (ISI) was progressively increased from 4 to 90 s. A steady adapting field (20 cd/m2) was presented in the ganzfeld. After a 7 min light adaptation period cone ERGs were evoked by strobe flash stimuli superimposed upon the adapting field. Flash luminance ranged from −0.8 to 1.9 log cd s/m2. Stimuli were presented at 2 Hz in order of increasing luminance and 25 successive responses were averaged for each stimulus condition. The amplitude of the a-wave was measured 7 ms after flash onset from the prestimulus baseline. The amplitude of the b-wave was measured from the a-wave trough to the peak of the b-wave or, if no a-wave was present, from the prestimulus baseline.
2.2.2. Direct current (dc)-ERG
To measure ERG components generated by the RPE, responses were obtained from the corneal surface of the left eye using a 1-mm-diameter borosilicate capillary tube with filament (BF100-50-10; Sutter Instrument, Novato, CA). The capillary was filled with Hank’s buffered salt solution to make contact with an Ag/Ag Cl wire electrode that was shielded from light stimulation. A similar electrode placed in contact with the right eye served as the reference. Responses were differentially amplified at dc-100 Hz (gain = ×1,000; DP-301, Warner Instruments, Hamden, CT), digitized at 20 Hz, and stored using LabScribe Data Recording Software (iWorx; Dover, NH). After the initial setup for each mouse was complete, the recorded baseline was monitored until the baseline became stable. White light stimuli were then derived from an optical channel using a Leica microscope illuminator as the light source and delivered to the test eye with a 1-cm-diameter fiber-optic bundle. The stimulus luminance was 2.4 log cd/m2. A Uniblitz shutter system was used to control stimulus duration at 7 min.
The mouse dc-ERG has four major components (Wu et al., 2004). The amplitude of the c-wave was measured from the prestimulus baseline to the peak of the c-wave. The amplitude of the fast oscillation (FO) was measured from the c-wave peak to the trough of the FO. The amplitude of the light peak (LP) was measured from the FO trough to the asymptotic value. The off-response amplitude was measured from the LP value just prior to stimulus light offset to the peak of the initial component.
2.2.3. Visual evoked potential
To measure responses of the visual cortex, VEPs were recorded using an active electrode positioned along the midline of the visual cortex. The positions of the reference and ground leads were the same as for ERG recordings and the bandpass filter settings were 1–100 Hz. VEPs were recorded to achromatic strobe flash stimuli presented in the LKC ganzfeld under dark-adapted conditions. The ISI ranged from 1.1 to 6 s, increasing with stimulus intensity from −2.4 to 2.1 log cd s/m2; 60 to 20 successive responses were averaged to obtain a VEP waveform. The mouse VEP is dominated by a negative component which is referred to as N1 (Peachey et al., 1997; Ridder and Nusinowitz, 2006; Yu et al., 2011). The implicit time of the N1 component was measured at the negative peak.
2.3. Statistical analysis
Response measures were analyzed statistically using repeated measures ANOVA. Because the standard error was not constant across all pairs of means, the degrees of freedom were adjusted by multiplying by the degrees of freedom of the Greenhouse-Geisser epsilon, and significance was adjusted accordingly. Where only a single stimulus intensity was used, data were analyzed using group Student’s t-test.
2.4. Histology
Comprehensive morphometric analyses of retinas of cbs−/−, +/−, and +/+ mice have been reported (Ganapathy et al., 2009). To confirm these observations and relate the electrophysiological data to retinal histology, eyes were immersion fixed in a solution of 2% paraformaldehyde/2.5%glutaraldehyde in 0.1 M cacodylate buffer and prepared for embedding in JB-4 solution ((Electron MicroscopySciences (EMS), Hatfield, PA) per our method (Ha et al., 2011). Retinal images were captured using an Axioplan-2 microscope equipped with an HRM camera (Carl Zeiss, Oberkochen, Germany).
3. Results
3.1. Dark- and light-adapted ERG: correlation with retinal histology
Figure 1 presents ERG data obtained from 3-week old cbs+/+ (WT), cbs+/− and cbs−/− mice. At this age, dark-adapted responses of WT and cbs+/− mice were comparable in waveform and amplitude, while those of cbs−/− mice were significantly reduced in amplitude (Fig. 1A, B). A similar result was obtained for the light-adapted ERG as the responses of WT and cbs+/− mice were very similar while those of cbs−/− mice were significantly reduced in amplitude (Fig. 1C, D). The normal ERG observed in cbs+/− mice at this age is consistent with the normal retinal histology observed in wildtype mice (Fig. 2A, B) and cbs+/− mice (data not shown). In the case of the cbs−/− mice, the altered electrophysiologic response (Fig. 1) is reflected in the disrupted morphologic appearance of the cbs−/− retina (Fig 2C–F). The retinal appearance in the homozygous mutant mice is variable, with some areas having a typical laminar appearance and only mild alterations (Fig. 2C,D) and other areas where the laminar appearance is altered significantly marked by areas of cellular hypertrophy (Fig. 2E) and rosette formation within the nuclear layers (Fig. 2F, arrows). These morphologic findings are similar to our previous report indicating that cbs−/− retinas have regions of profound ganglion cell dropout and disruption of the inner and outer nuclear layers (Ganapathy et al., 2009).
Figure 1.

ERG results obtained from 3 week old mice. (A) ERGs obtained from WT (cbs+/+), cbs+/−, and cbs−/− mice to strobe flash stimuli presented to the dark-adapted eye. (B) Intensity-response functions for the major ERG components. Responses of WT and cbs+/− mice are not statistically different. Responses of cbs−/− mice are significantly reduced in amplitude (a-wave: p<0.02; b-wave: p<0.005). (C) Cone ERGs obtained to strobe flash stimuli superimposed upon a steady adapting field. (D) Intensity responses for the cone ERG. In comparison to WT, cone ERGs of cbs+/− mice are comparable in amplitude while cbs−/− mice are significantly reduced in amplitude (p<0.05). Scale bar in A indicates 200 μV and 100 ms. Scale bar in C indicates 100 μV and 100 ms. In B and D, data points indicate the average (± SD) of 19 WT, 26 cbs+/− and 4 cbs−/− mice.
Figure 2.

Histology of retinas of 3 week old mice. Light micrographs of hematoxylin and eosin-stained inner (A) and outer (B) retinal regions in WT (cbs+/+) mice; inner (C) and outer (D) regions of homozygous mutant (cbs−/−) mice. Photomicrographs in E and F provide lower magnification of retinas of cbs−/− mice showing altered retinal architecture including rosette formation (arrows) within the nuclear layers. Calibration bar = 50 μm. Abbreviations: gcl = ganglion cell layer, ipl = inner plexiform layer, inl = inner nuclear layer, onl = outer nuclear layer, rpe = retinal pigment epithelium.
Owing to the shortened lifespan of cbs−/− mice of (~3 weeks) (Watanabe et al., 1995), it was not feasible to obtain ERG data from older cbs−/− mice. Consequently, we concentrated much of our functional analyses on cbs+/− mice in which a slow progressive loss of retinal cells has been reported (Ganapathy et al., 2009). Figure 3 compares dark-adapted (A–D) and light-adapted (E–H) intensity-response functions for WT and cbs+/− littermates at 5 weeks (Fig. 3A, E), 10 weeks (Fig. 3B, F), 15 weeks (Fig. 3C, G) and 30 weeks of age (Fig. 3D, H). Responses of cbs+/− mice did not differ from WT at 5 or 10 weeks of age. By 15 weeks of age, however, cbs+/−responses were significantly reduced in amplitude, under both dark- and light-adapted conditions (Fig. 3C,G). A similar reduction in amplitude was noted at the oldest age examined, 30 weeks (Fig. 3D,H).
Figure 3.

ERG changes in cbs+/− heterozygous mice. ERG intensity-response functions for WT and cbs+/− mice at 5 weeks (A, E), 10 weeks (B, F), 15 weeks (C, G) and 30 weeks (D, H) of age were obtained under dark-adapted (A–D) and light-adapted (E–H) conditions. For the dark-adapted condition, there was no significant difference between WT and cbs+/− mice at 5 or 10 weeks of age. At 15 and 30 weeks of age, both a- and b-waves were significantly reduced in cbs+/− mice (p<0.03). Light-adapted responses did not differ between WT and cbs+/− mice at 5 or 10 weeks of age, but cbs+/− responses were significantly reduced at 15 and 30 weeks of age (p<0.03 and 0.05, respectively). Data points indicate average (± SD) of 4–12 different mice.
Hematoxylin and eosin-stained retinal sections of 30 week old WTand cbs+/− mice are shown in Figure 4. The retinas of cbs+/− mice are generally well-organized and the nuclear and plexiform layers are similar in appearance and thickness to cbs+/+ mice. Figure 4A and B provide low power photomicrographs of retinas of the WT and cbs+/− mice, respectively. Higher magnification photomicrographs of the inner retina, middle retina and outer retina are shown in Fig. 4C and D, 4E and F, 4G and H, respectively. Aside from the thinner inner plexiform layer and ganglion cell drop-out, the histological appearance of the inner and outer nuclear layers is well-organized.
Figure 4.

Histology of retinas of 30 week old heterozygous and wildtype mice. Low magnification light micrographs of hematoxylin and eosin-stained retinas from (A) WT (cbs+/+) and (B) heterozygous (cbs+/−) mice. Higher magnification light photomicrograph images of inner (C,D), middle (E,F) and outer (G,H) retina of WT and cbs+/− mice, respectively. Generally, the laminar organization of the retina in cbs+/− mice is similar to that of WT mice, although the inner plexiform layer is slightly reduced in thickness and there is clear evidence of dropout of ganglion cells (arrows in panel B) in these retinas. There are occasional aberrations observed in the region of the RPE as shown in panel H. Calibration bar = A, B = 50 μm, C-H = 20μm. Abbreviations: gcl = ganglion cell layer, ipl = inner plexiform layer, inl = inner nuclear layer, opl = outer plexiform layer, onl = outer nuclear layer, is = inner segment, os = outer segment, rpe = retinal pigment epithelium.
3.2. RPE Electrophysiology
We used dc-ERG recordings to evaluate RPE function in WT and cbs+/− mice. Figure 5 compares average dc-ERGs obtained from mice at 5 weeks (A) and 30 weeks (B) of age. At 5 weeks, there was no difference between WT and cbs+/− mice in any of the major components of dc-ERG (c-wave, fast oscillation, light peak, off-response). At 30 weeks, the light peak component was significantly reduced in cbs+/− mice, while all other response components were not different from WT. The light peak reduction was not accompanied by marked alterations in the histologic appearance of the RPE (data not shown).
Figure 5.

Assessment of ERG components generated by the RPE. dc-ERG responses obtained to a 7-min duration stimulus were obtained from WT (blue) or cbs +/− (red) mice at 5 weeks (A) or 30 weeks (B) of age. At 5 weeks, tracings reflect the average of responses obtained from 9 WT or 3 cbs+/− mice. All response components were comparable at this age. At 30 weeks, tracings reflect the average of 9 WT or 4 cbs+/− responses. At 30 weeks of age, the amplitude of the light peak component was significantly reduced in amplitude (p<0.04). Amplitude scale bar indicates 1 mV.
3.3. Visual Evoked Potentials
To evaluate how the ganglion cell loss reported in cbs+/− mice (Ganapathy et al., 2009) impacts visual transmission to the visual cortex, we recorded VEPs to strobe flash stimuli presented in the dark. Figure 6A shows representative VEP waveforms obtained using 3 stimulus intensities from a WT mouse and a cbs+/− littermate at 30 weeks of age. The mouse VEP is dominated by a large negative wave (N1), the implicit time of which decreases with increasing flash intensity (Yu et al., 2011). Intensity-response functions for N1 implicit time are shown in Figure 6B–D for mice tested at 5 weeks (B), 10 weeks (C) or 30 weeks (D) of age. At 5 and 10 weeks of age, there was no difference in N1 implicit time between WT and cbs+/− mice. At 30 weeks of age, however, N1 implicit time was delayed significantly in cbs+/− mice.
Figure 6.

VEP changes in cbs+/− heterozygous mice.. (A) Representative VEP waveforms of 30-week old WT and cbs +/− mice obtained to strobe flash stimuli presented to the dark-adapted eye. Arrowheads indicate the implicit time of the main VEP component N1. Vertical dashed lines indicate the time of stimulus flash presentation. Note that the delay observed in response to low intensity stimuli were more pronounced in the cbs +/− mouse. Scale bar indicates 20 μV and 100 ms. (B–D) Intensity-response functions for N1 implicit time obtained at 5 weeks (B), 10 weeks (C) and 30 weeks (D). Data points indicate the average (± SD) of 4 WT and 10 cbs+/−mice tested at 5 weeks of age, 7 WT and 3 cbs+/− mice tested at 10 weeks of age, and 7 WT and 9 cbs+/− mice tested at 30 weeks of age. N1 implicit time did not differ between WT and cbs+/−mice at 5 or 10 weeks of age. N1 implicit times were significantly delayed in 30 week old cbs+/−mice (p<0.05).
Given the marked disruption of the cbs−/− retina (Ganapathy et al., 2009), we also recorded the VEP from these animals, albeit only at 3 weeks of age owing to their premature death. Figure 7 shows that N1 implicit time was markedly delayed in cbs−/− mice as compared with age-matched heterozygous and wildtype littermates. These data indicate altered optic nerve function at this very early age in mice with extremely high levels of homocysteine.
Figure 7.
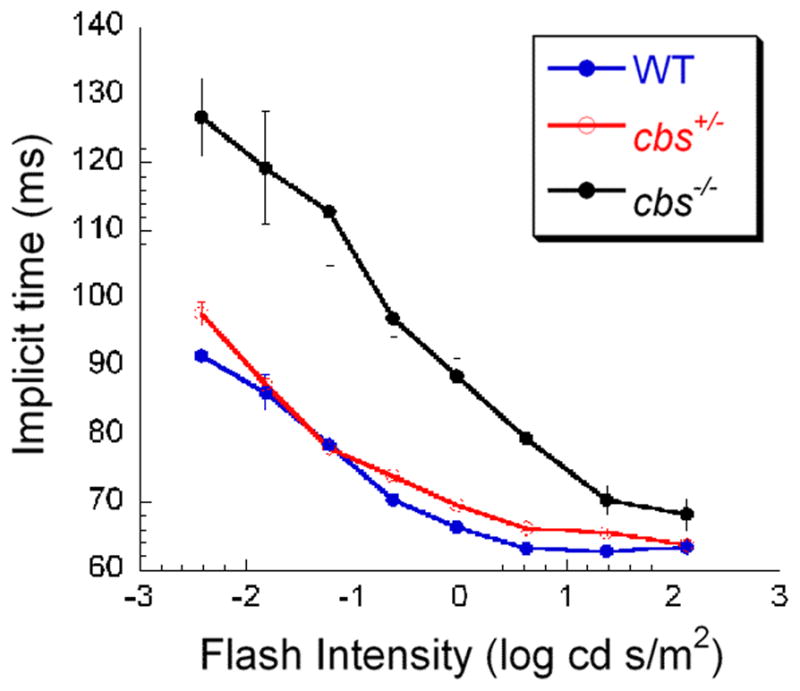
Visual evoked potential in 3 week homozygous mice compared to age-matched heterozygous and wildtype mice. Intensity-response functions for N1 implicit time were obtained from 3-week old WT (blue), cbs+/− (red) and cbs+/− (black) mice. Note the pattern of VEP delay observed in older cbs+/− mice (Fig. 6) is already detectable by 3-weeks in the cbs−/− animals.
4. Discussion
The present study represents the first comprehensive analysis of retinal function in an animal model of hyperhomocysteinemia due to deficiency of CBS. In mice with no CBS protein (cbs−/−) the electrophysiologic responses of the retina were markedly diminished at an early age. The dark- and light-adapted a- and b-waves, though discernable, were significantly reduced compared to WT and cbs+/− littermates. The cbs−/− mice also manifest abnormal retinal output to the visual cortex, as shown by the marked delay in VEP implicit time. Although additional defects may be present in the central visual pathway, these electrophysiological data are consistent with the pathologic changes observed in cbs−/− retinas, including disruption of the architecture of the inner and outer nuclear layers (Ganapathy et al., 2009; Fig. 2). In humans with severe deficiency of CBS, the retina has not been examined by microscopy or with imaging modalities. The first sign of ocular disturbance is typically dislocation of the lens due to degenerative changes in the zonular fibers that suspend the lens from the ciliary body (Mulvihill et al., 2001). Glaucoma occurs in most patients as an acute and painful event following lens dislocation (reviewed by Gerding, 1998).
In cbs+/− mice with only a modest increase in plasma homocysteine there was a gradual loss of retinal electrophysiologic function. At early ages (5, 10 weeks) the light- and dark-adapted a- and b-wave amplitudes were similar to age-matched WT animals reflecting normal function of photoreceptor cells and bipolar cells (Frishman and Wang, 2011). Functional changes were observed in older mice (15, 30 weeks), ages when retinal alterations begin to be appreciated (Ganapathy et al., 2009). The reduced dc-ERG light peak was not accompanied by other electrophysiological manifestations of RPE dysfunction. Component-specific changes have been noted in dc-ERG studies of other mouse mutants (Wu et al., 2007; Edwards et al., 2010).
VEP recordings revealed marked differences in visual transmission to the visual cortex in 30-week old cbs+/− mice compared to WT littermates. These VEP delays are noteworthy given the earlier documentation of ganglion cell loss in cbs+/− mice (Ganapathy et al., 2009) and the recent report that mitochondrial dynamics are altered in retinal ganglion cell axons of cbs mutant mice (Ganapathy et al., 2011). Ganapathy and colleagues noted that in comparison to WT, the cbs+/− retina has elevated levels of two mitochondrial proteins, Opa1 and Fis1, and that mitochondrial abnormalities could be observed ultrastructurally. Alterations in Opa1 are associated with glaucoma and optic neuropathies and mitochondrial dysfunction is implicated in the pathogenesis of these diseases (Carelli et al., 2004). Our functional evidence demonstrating delayed transmission to the visual cortex provides additional support for a role of elevated homocysteine in the pathogenesis of glaucoma. These data correlate with the ganglion cell losses noted here in cbs+/− mice and reported earlier (Ganapathy et al., 2009; Ganapathy et al., 2011). Within the past few years there have been several clinical studies reporting elevated homocysteine associated with various forms of glaucoma (Tranchina et al., 2011; Turgut et al., 2010; Jaksic et al., 2010; Micheal et al., 2009; Clement et al., 2009). It will be informative to determine whether mutations of CBS and genes encoding other proteins involved in homocysteine metabolism contribute to some forms of glaucoma or optic nerve dysfunction.
Severe hyperhomocysteinemia can be caused by mutations in genes other than cbs. For example, elevations in plasma homocysteine are caused by mutations in methylenetetrahydrofolate reductase (MTHFR), an important enzyme in homocysteine metabolism that catalyzes the conversion of 5,10-methylenetetrahydrofolate to 5-methyltetrahydrofolate, the predominant circulating form of folate. ERG studies of mthfr−/− mice have been recently reported (Lawrance et al., 2011). Both dark- and light-adapted ERGs of 6 week mthfr−/− mice were smaller than WT controls. This reduction was not progressive, however, and no difference was noted when mice were tested at 13 weeks of age. Although VEPs were not recorded, it is important to note that several cases of MTHFR mutations and visual defects associated with diabetic retinopathy, anterior ischemic optic neuropathy and glaucoma have been reported (Maeda et al., 2006; Felekis et al., 2010; Jaksic et al., 2010).
Methionine synthase is an enzyme, encoded by the MTR gene (5-methyltetrahydrofolate-homocysteine methyltransferase), which remethylates homocysteine to methionine using 5-methyltetrahydrofolate. Mutations in MTR are associated with elevated homocysteine and retinal abnormalities. Poloschek et al. (2005) performed comprehensive retinal electrophysiological evaluation over several years in a young patient with methione synthase deficiency and reported decreased amplitude of the a- and b-waves consistent with decreased photoreceptor function. In this patient, the flash VEP waveform was severely distorted. While this precluded precise implicit time measurements, this result is consistent with ganglion cell loss. Interestingly, reduced oscillatory potentials were also observed in this patient that may reflect microvascular damage in the inner retina.
Taken collectively, the data suggest that marked elevation of homocysteine has a deleterious effect on retinal function and modest elevation can alter retinal function and the retinal output signal. Determining the mechanism by which homocysteine alters retinal function, particularly that of ganglion cells under moderate homocysteine conditions and other retinal neurons under severe hyperhomocysteinemic conditions will be the focus of future work. The availability of cbs and mthfr mutant mice, with endogenous elevation of homocysteine, offers excellent experimental tools with which to pursue this line of inquiry.
Acknowledgments
This study was supported by NIH grant R01 EY12830, the Foundation Fighting Blindness, Challenge Grants from Research to Prevent Blindness, and the VA Medical Research Service.
Literature cited
- Axer-Siegel R, Bourla D, Ehrlich R, et al. Association of neovascular age-related macular degeneration and hyperhomocysteinemia. Am J Ophthalmol. 2004;137:84–89. doi: 10.1016/s0002-9394(03)00864-x. [DOI] [PubMed] [Google Scholar]
- Aydemir O, Türkçüğlu P, Güler M, Celiker U, Ustündağ B, Yilmaz T, Metin K. Plasma and vitreous homocysteine concentrations in patients with proliferative diabetic retinopathy. Retina. 2008;28:741–743. doi: 10.1097/IAE.0b013e31816079fb. [DOI] [PubMed] [Google Scholar]
- Bleich S, Jünemann A, Von Ahsen N, et al. Homocysteine and risk of open-angle glaucoma. J Neural Transm. 2002;109:1499–1504. doi: 10.1007/s007020200097. [DOI] [PubMed] [Google Scholar]
- Carelli V, Ross-Cisneros FN, Sadun AA. Mitochondrial dysfunction as a cause of optic neuropathies. Prog Retin Eye Res. 2004;1:53–89. doi: 10.1016/j.preteyeres.2003.10.003. [DOI] [PubMed] [Google Scholar]
- Chang HH, Lin DP, Chen YS, Liu HJ, Lin W, Tsao ZJ, Teng MC, Chen BY. Intravitreal homocysteine-thiolactone injection leads to the degeneration of multiple retinal cells, including photoreceptors. Mol Vis. 2011;17:1946–1956. [PMC free article] [PubMed] [Google Scholar]
- Clement CI, Goldberg I, Healey PR, Graham SL. Plasma homocysteine, MTHFR gene mutation, and open-angle glaucoma. J Glaucoma. 2009;1:73–78. doi: 10.1097/IJG.0b013e31816f7631. [DOI] [PubMed] [Google Scholar]
- Dun Y, Thangaraju M, Prasad P, Ganapathy V, Smith SB. Prevention of excitotoxicity in primary retinal ganglion cells by (+)-Pentazocine, a sigma receptor-1-specific ligand. Invest Ophthamol Vis Sci. 2007;48:4785–4794. doi: 10.1167/iovs.07-0343. [DOI] [PMC free article] [PubMed] [Google Scholar]
- Edwards MM, Marín deEvsikova C, Collin GB, Gifford E, Wu J, Hicks WL, Whiting C, Varvel NH, Maphis N, Lamb BT, Naggert JK, Nishina PM, Peachey NS. Photoreceptor degeneration, azoospermia, leukoencephalopathy and abnormal retinal pigment epithelial cell function in mice expressing an early stop mutation in CLCN2. Invest Ophthamol Vis Sci. 2010;51:3264–3272. doi: 10.1167/iovs.09-4887. [DOI] [PMC free article] [PubMed] [Google Scholar]
- Felekis T, Katsanos KH, Zois CD, Vartholomatos G, Kolaitis N, Asproudis I, Tsianos EV. Anterior ischemic optic neuropathy in a patient with Crohn’s disease and aberrant MTHFR and GPIIIa gene variants. J Crohns Colitis. 2010;4:471–474. doi: 10.1016/j.crohns.2010.02.008. [DOI] [PubMed] [Google Scholar]
- Frishman LJ, Wang MH. Electroretinogram of human, monkey and mouse. In: Levin LA, Nilsson SFE, Ver Hoeve J, Wu SM, Kaufman PL, Alm A, editors. Adler’s Physiology of the Eye. 11. New York, NY: Saunders Elsevier; 2011. pp. 480–501. [Google Scholar]
- Ganapathy PS, Dun Y, Ha Y, Duplantier J, Allen JB, Farooq A, Bozard BR, Smith SB. Sensitivity of staurosporine-induced differentiated RGC-5 cells to homocysteine. Curr Eye Res. 2010;35:80–90. doi: 10.3109/02713680903421194. [DOI] [PMC free article] [PubMed] [Google Scholar]
- Ganapathy PS, Moister B, Roon P, Mysona BA, Duplantier J, Dun Y, Moister TK, Farley MJ, Prasad PD, Liu K, Smith SB. Endogenous elevation of homocysteine induces retinal neuron death in the cystathionine-beta-synthase mutant mouse. Invest Ophthalmol Vis Sci. 2009;50:4460–4470. doi: 10.1167/iovs.09-3402. [DOI] [PMC free article] [PubMed] [Google Scholar]
- Ganapathy PS, Perry RL, Tawfik A, Smith RM, Perry E, Roon P, Bozard BR, Ha Y, Smith SB. Homocysteine-mediated modulation of mitochondrial dynamics in retinal ganglion cells. Invest Ophthalmol Vis Sci. 2011;52:5551–5558. doi: 10.1167/iovs.11-7256. [DOI] [PMC free article] [PubMed] [Google Scholar]
- Gerding H. Ocular complications and a new surgical approach to lens dislocation in homocystinuria due to cystathionine-beta-synthetase deficiency. Eur J Pediatr. 1998;157:S94–S101. doi: 10.1007/pl00014312. [DOI] [PubMed] [Google Scholar]
- Ha Y, Saul A, Tawfik A, Williams C, Bollinger K, Smith R, Tachikawa M, Zorrilla E, Ganapathy V, Smith SB. Late-onset inner retinal dysfunction in mice lacking sigma receptor 1 (σR1) Invest Ophthalmol Vis Sci. 2011 doi: 10.1167/iovs.11-8169. In Press. [DOI] [PMC free article] [PubMed] [Google Scholar]
- Jaksic V, Markovic V, Milenkovic S, Stefanovic I, Jakovic N, Knezevic M. MTHFR C677T homozygous mutation in a patient with pigmentary glaucoma and central retinal vein occlusion. Ophthalmic Res. 2010;43:193–196. doi: 10.1159/000272023. [DOI] [PubMed] [Google Scholar]
- Lahey JM, Kearney JJ, Tunc M. Hypercoagulable states and central retinal vein occlusion. Curr Opin Pulm Med. 2003;9:385–392. doi: 10.1097/00063198-200309000-00008. [DOI] [PubMed] [Google Scholar]
- Lawrance AK, Racine J, Deng L, Wang X, Lachapelle P, Rozen R. Complete deficiency of methylenetetrahydrofolate reductase in mice is associated with impaired retinal function and variable mortality, hematological profiles, and reproductive outcomes. J Inherit Metab Dis. 2011;34:147–157. doi: 10.1007/s10545-010-9127-1. [DOI] [PubMed] [Google Scholar]
- Maeda M, Fujio Y, Azuma J. MTHFR gene polymorphism and diabetic retinopathy. Curr Diabetes Rev. 2006;4:467–476. doi: 10.2174/1573399810602040467. [DOI] [PubMed] [Google Scholar]
- Micheal S, Qamar R, Akhtar F, Khan MI, Khan WA, Ahmed A. MTHFR gene C677T and A1298C polymorphisms and homocysteine levels in primary open angle and primary closed angle glaucoma. Mol Vis. 2009;15:2268–2278. [PMC free article] [PubMed] [Google Scholar]
- Moore P, El-sherbeny A, Roon P, Schoenlein PV, Ganapathy V, Smith SB. Apoptotic cell death in the mouse retinal ganglion cell layer is induced in vivo by the excitatory amino acid homocysteine. Exp Eye Res. 2001;73:45–57. doi: 10.1006/exer.2001.1009. [DOI] [PubMed] [Google Scholar]
- Mudd SH. Hypermethioninemias of genetic and non-genetic origin: A review. Am J Med Genet, C, Semin Med Genet. 2011;157:3–32. doi: 10.1002/ajmg.c.30293. [DOI] [PubMed] [Google Scholar]
- Mulvihill A, Yap S, O’Keefe M, Howard PM, Naughten ER. Ocular findings among patients with late-diagnosed or poorly controlled homocystinuria compared with a screened, well-controlled population. J Amer Assoc Ped Ophthalmol Strabismus. 2001;5:311–315. doi: 10.1067/mpa.2001.118219. [DOI] [PubMed] [Google Scholar]
- Peachey NS, Roveri L, Messing A, McCall MA. Functional consequences of oncogene-induced horizontal cell degeneration in the retinas of transgenic mice. Vis Neurosci. 1997;14:627–632. doi: 10.1017/s0952523800012591. [DOI] [PubMed] [Google Scholar]
- Poloschek CM, Fowler B, Unsold R, Lorenz B. Disturbed visual system function in methionine synthase deficiency. Graefes Arch Clin Exp Ophthalmol. 2005;243:497–500. doi: 10.1007/s00417-004-1044-2. [DOI] [PubMed] [Google Scholar]
- Ridder WH, III, Nusinowitz S. The visual evoked potential in the mouse—origins and response characteristics. Vision Res. 2006;46:902–913. doi: 10.1016/j.visres.2005.09.006. [DOI] [PubMed] [Google Scholar]
- Roybal CN, Yang S, Sun CW, Hurtado D, Vander Jagt DL, Townes TM, Abcouwer SF. Homocysteine increases the expression of vascular endothelial growth factor by a mechanism involving endoplasmic reticulum stress and transcription factor ATF4. J Biol Chem. 2004;279:14844–14852. doi: 10.1074/jbc.M312948200. [DOI] [PubMed] [Google Scholar]
- Seddon JM, Gensler G, Klein ML, Milton RC. Evaluation of plasma homocysteine and risk of age-related macular degeneration. Am J Ophthalmol. 2006;141:201–203. doi: 10.1016/j.ajo.2005.07.059. [DOI] [PubMed] [Google Scholar]
- Tranchina L, Centofanti M, Oddone F, Tanga L, Roberti G, Liberatoscioli L, Cortese C, Manni G. Levels of plasma homocysteine in pseudoexfoliation glaucoma. Graefes Arch Clin Exp Ophthalmol. 2011;3:443–448. doi: 10.1007/s00417-010-1487-6. [DOI] [PubMed] [Google Scholar]
- Tsina EK, Marsden DL, Hansen RM, Fulton AB. Maculopathy and retinal degeneration in cobalamin C methylmalonic aciduria and homocystinuria. Arch Ophthalmol. 2005;123:1143–1146. doi: 10.1001/archopht.123.8.1143. [DOI] [PubMed] [Google Scholar]
- Turgut B, Kaya M, Arslan S, Demir T, Güler M, Kaya MK. Levels of circulating homocysteine, vitamin B6, vitamin B12, and folate in different types of open-angle glaucoma. Clin Interv Aging. 2010;5:133–139. doi: 10.2147/cia.s9918. [DOI] [PMC free article] [PubMed] [Google Scholar]
- Vessani RM, Ritch R, Liebmann JM, Jofe M. Plasma homocysteine is elevated in patients with exfoliation syndrome. Am J Ophthalmol. 2003;136:41–46. doi: 10.1016/s0002-9394(03)00077-1. [DOI] [PubMed] [Google Scholar]
- Watanabe M, Osada J, Aratani Y, Kluckman K, Reddick R, Malinow MR. Mice deficient in cystathionine beta-synthase: animal models for mild and severe homocysteinemia. Proc Natl Acad Sci USA. 1995;92:1585–1589. doi: 10.1073/pnas.92.5.1585. [DOI] [PMC free article] [PubMed] [Google Scholar]
- Wu J, Peachey NS, Marmorstein A. D. Light-evoked responses of the mouse retinal pigment epithelium. J Neurophysiol. 2004;91:1134–1142. doi: 10.1152/jn.00958.2003. [DOI] [PMC free article] [PubMed] [Google Scholar]
- Wu J, Marmorstein AD, Striessnig J, Peachey NS. Voltage-dependent calcium channel CaV1.3 subunits regulate the light peak of the electroretinogram. J Neurophys. 2007;97:3731–3735. doi: 10.1152/jn.00146.2007. [DOI] [PMC free article] [PubMed] [Google Scholar]
- Yang G, Lu J, Pan C. The impact of plasma homocysteine level on development of retinopathy in type 2 diabetes mellitus. Zhonghua Nei Ke Za Zhi. 2002;41:34–38. [PubMed] [Google Scholar]
- Yu M, Narayanan SP, Wang F, Morse E, Macklin WB, Peachey NS. Visual abnormalities associated with enhanced optic nerve myelination. Brain Res. 2011;1374:36–42. doi: 10.1016/j.brainres.2010.12.043. [DOI] [PMC free article] [PubMed] [Google Scholar]