

Abstract
Contrast agents for magnetic resonance imaging (MRI) that exhibit sensitivity toward specific ions or molecules represent a challenging but attractive direction of research. Here a Gd3+ complex linked to an aminobis(methylenephosphonate) group for chelating Ca2+ was synthesized and investigated. The longitudinal relaxivity (r1) of this complex decreases during the relaxometric titration with Ca2+ from 5.76 to 3.57 mM−1 s−1 upon saturation. The r1 is modulated by changes in the hydration number, which was confirmed by determination of the luminescence emission lifetimes of the analogous Eu3+ complex. The initial in vivo characterization of this responsive contrast agent was performed by means of electrophysiology and MRI experiments. The investigated complex is fully biocompatible, having no observable effect on neuronal function after administration into the brain ventricles or parenchyma. Distribution studies demonstrated that the diffusivity of this agent is significantly lower compared with that of gadolinium−diethylenetriaminepentaacetic acid (Gd−DTPA).
Keywords: Smart contrast agents, calcium signaling, functional magnetic resonance imaging (fMRI), in vivo brain imaging
Calcium, the most abundant metal by mass in many animals, is essential for cell physiology, and its movement into and out of the cytoplasm functions as a critical signal for a multitude of cellular processes. Its role in the brain cannot be overstated. Hundreds of cellular processes rely on calcium influx, from intracellular secondary messenger cascades and gene expression to neuronal physiology (1). Presynaptically, Ca2+ is necessary for neurotransmitter release; postsynaptically, it is a crucial mediator of synaptic plasticity and the cellular processes supporting learning and memory. Dendritic Ca2+ spikes are involved in synaptic integration and transmission. Propagated Ca2+ waves in astrocytic glia cells following neural activation serve as neuroglial communication. Therefore any substantial fluctuation in external concentration of Ca2+ ions is likely to engender important functional effects. The ability to observe changes in Ca2+concentration noninvasively is thus of paramount importance for biomedical research, especially in neuroimaging.
Magnetic resonance imaging (MRI) has evolved to be one of the most powerful tools in medical diagnostics. Contrast agents (CAs) can be applied that substantially enhance MR sensitivity and image quality by reducing the relaxation time of the water protons in the region of interest. The majority of these CAs are based on macrocyclic chelates of the paramagnetic Gd3+ ion (2,3). Consequently efforts have been made to generate responsive Gd3+ complexes that can report changes in Ca2+ ion concentrations using MRI contrast (4). Their in vivo application would enable the development of new functional MRI (fMRI) methods that do not rely on surrogate signals, such as those based on hemodynamic changes that have poor specificity and spatiotemporal resolution (5). CA-based fMRI has the potential to help elucidate the relationship between the blood-oxygen-level-dependent (BOLD) signal and the underlying physiology6, a relationship that is difficult to interpret (7,8).
Most responsive T1 agents are derived from the Gd3+ macrocyclic complex of 1,4,7,10-tetraazacyclododecane-1,4,7-tris(methylenecarboxylic)-acid (DO3A) linked to another type of chelator, depending on the target metal analyte (4). Typically a modulation of the hydration number, q, is responsible for the changes in r1(9,10). Another class of responsive CAs (T2) rely on a different mechanism, where the Ca2+-induced aggregation of superparamagnetic iron oxide (SPIO) conjugates leads to a change in signal (11). Both approaches have certain advantages and disadvantages determined by the desired application, because many requirements must be fulfiled. Examples include the optimal ratio of CA to target ion concentration and the method’s temporal resolution (12).
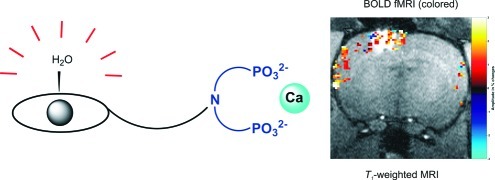
To avoid these existing problems, we developed a bioresponsive agent sensitive to fluctuations in the concentration of Ca2+. Several calcium-seeking contrast agents containing a bis(phosphonate) moiety were previously studied for their potential application as in vivo bone-targeting agents (13−15). We synthesized a novel complex based on Gd3+−DO3A covalently linked to hexyl aminobis(methylenephosphonate), GdL (Figure 1). Its relaxometric properties were investigated in the absence and presence of Ca2+. The biocompatibility and difussion properties in the brain of live rats were also examined.
Figure 1.

Structure of GdL.
Aminobis(methylenephosphonates) are known to be efficient chelators for certain biologically relevant ions such as Ca2+, Mg2+, or Zn2+16. Earlier investigations focused on the interaction of molecules or complexes containing this group with Ca2+17−19. The complexation of Ca2+ with aminobis(methylenephosphonates) is selective, with formation constants in the high micromolar to low millimolar region (19,20), making it suitable for tracking the changes in extracellular Ca2+ concentration (21). Targeting extracellular rather than intracellular Ca2+ through MRI appears more beneficial because the concentration range of CA needed to report these changes ensures detection of the MR signal. Furthermore, the complicated synthesis required to incorporate a vector that aids internalization of the CA for intracellular measurements is not needed here.
Additionally, the inclusion of an aminobis(methylenephosphonate) within the Gd3+ chelate can influence several other parameters, enhancing r1. The access of water molecules to the inner coordination sphere and their residence time at the metal site can be affected by the steric crowding induced by this bulky group. Furthermore, the negative charge on the surface of paramagnetic complexes decreases the residence time and hence also contributes to the overall relaxivity of these agents. These properties are likely to change upon interaction with Ca2+.
Results and Discussion
Synthesis and Physicochemical Characterization
The synthesis of L was performed in a straightforward four-step procedure, commencing with the commercially available 6-bromo hexylamine 1. The Boc protection of this amine yielded 2, which underwent alkylation with tris-tert-butyl-DO3A to give 3. All four protecting groups were removed in one step using TFA to give 4. The ligand L was obtained through a Mannich reaction, where the amino group of 4 was heated with formaldehyde and phosphorous acid to 100 °C (Scheme 1).
Scheme 1. Synthesis of L.

Conditions and yields: (a) Boc2O, H2O/CH2Cl2, 62%; (b) tris-t-Bu-DO3A, K2CO3, CH3CN, 80 °C, 82%; (c) TFA, CH2Cl2, 68%; (d) H3PO3, formaldehyde, H2O, 100 °C, 58%.
The complexation of the chelate L with aqueous GdCl3 yielded the paramagnetic complex GdL, and its relaxometric response to various calcium concentrations was investigated. Titration experiments were performed at physiological pH and a proton Larmor frequency of 400 MHz (9.4 T). Unexpectedly, the r1 of GdL decreased from 5.76 to 3.57 mM−1 s−1 after the addition of approximately 3 equiv of Ca2+ (Figure 2). The changes are reversible, since the addition of an equimolar amount of EDTA returns the r1 to its initial value. The response of GdL to other biologically relevant cations such as Mg2+ and Zn2+ was also investigated. The titration of GdL with Zn2+ gave a response toward this cation, but at much higher concentrations (more than 8 equiv), whereas the titration with Mg2+ did not show any change in r1. In addition, the response of GdL to Zn2+ appeared to be irreversible, since the addition of EDTA did not lead to the recovery of r1. The potential for Zn2+ to interfere with the application of GdL in neuroimaging can be neglected since its extracellular concentration (a few micromolar) is significantly lower than that of Ca2+22.
Figure 2.

Dependence of r1 on the concentration of GdL (bottom) in the absence of Ca2+ (◼) and the presence of 3 equiv of Ca2+ (●) and relaxometric Ca2+ titration curve (top) with GdL concentration = 2.5 mM at 9.4 T, 25 °C, and pH 7.3 (HEPES buffer).
The decrease in relaxivity exhibited by GdL on addition of Ca2+ is unusual for this class of complexes. Previously reported responsive agents contained a selective Ca2+ chelator that coordinates to the Gd3+ centers, maintaining a low q-value and r1(4). Upon addition of Ca2+, the chelator “flips” from Gd3+ to bind Ca2+ allowing the access of water to the paramagnetic center, which leads to an increase of the r1. Mechanistic studies confirm that the modulation of q is principally responsible for the r1 changes (23). The observed opposing behavior of GdL will be favorable for imaging the fluctuations of extracellular Ca2+ in the brain, since its concentration during neural activity decreases. In response to the decrease in Ca2+ concentration GdL would subsequently increase the MRI contrast signal.
It is likely that the aminobis(methylenephosphonate) is causing the unusual behavior of GdL. It has already been established that this group behaves in a similar manner to other phosphonates and diphosphonates, forming aggregates in solution that are either hydrogen-bonded or metal-assisted (16). From a practical viewpoint, the use of an aggregation mechanism for the MR imaging of Ca2+ should be feasible (11). Evidence for the formation of aggregates of GdL in the presence of Ca2+ was indicated by the measurement of the r1 in the absence and presence of Ca2+ as a function of different concentrations of GdL. A Ca2+-free solution exhibited a 20% increase in r1 upon dilution from 20 to 2.5 mM. Addition of Ca2+ (3 equiv) decreased the r1; however the r1 remained practically constant over the whole investigated range of GdL concentrations (Figure 2).
To understand the mechanism of the change in r1, luminescence emission lifetimes of EuL in H2O and D2O were determined (Table 1). This enables us to calculate the hydration number, q, and how it changes as a function of Ca2+ concentration. Following the addition of up to 3 equiv of Ca2+, q is reduced from 0.83 to 0.36. Furthermore, the q value of EuL is concentration dependent, with values of 0.65 and 0.30 at 50 mM of EuL for Ca-free and 3 equiv of Ca2+, respectively, confirming that the observed changes in r1 are modulated by q.
Table 1. Luminescence Emission Lifetimes and Calculated q Values of EuL (5 mM) in the Absence and Presence of Ca2+ (3 equiv).
| complex | τ (ms), H2O | τ (ms), D2O | q |
|---|---|---|---|
| EuL | 0.65 | 1.66 | 0.83 |
| EuL + 3 equiv of Ca2+ | 0.89 | 1.75 | 0.36 |
The results obtained from the physicochemical characterization of GdL and EuL indicate the potential for this new system to be used as a novel contrast agent responsive to extracellular Ca2+. Its ability to report the decrease in Ca2+ concentration by producing a positive MRI signal could find application in the design of new fMRI experiments, where the dynamic response of Ca2+ fluctuations during brain stimulation can be recorded. However, due to its response to Ca2+ in the millimolar range and the required high dose of the contrast agent (also millimolar), we performed initial in vivo characterization of this agent.
In Vivo Studies
In vivo experiments in rats were performed to characterize the distribution, half-life and biocompatibility of GdL in the extracellular space of the brain. We first administered the compound by infusing a pH-buffered solution containing 20 mM of GdL in artificial cerebral-spinal fluid (ACSF) into the lateral ventricle (see Methods section). The solution was infused with the animal inside the scanner and T1-weighted MR images were acquired continuously before and after GdL administration. The signal rapidly increased (due to T1-shortening) and diffused in the ventricular system, without entering the brain parenchyma (Figure 3). After the washout of GdL from the ventricle (Figure 3d,e), the signal remained enhanced in the tissues surrounding the infusion site and the walls of the ventricles (ependyma), suggesting that GdL strongly interacts with the brain parenchyma thus limiting its diffusivity.
Figure 3.

Injection of the compound GdL into the cerebroventricles: (a) overlay of the anatomical image and the rat brain atlas; (b) pre-injection; (c) 15 min after injection; (d) 2 h after injection; (e) time courses of signal increase due to GdL with the respective trendlines.
Since the contrast agent did not reach the neurons after intracerebroventricular (icv) administration, we then injected GdL directly into the parenchyma to further investigate its biocompatibility and response to brain activation. Following the same experimental approach stated previously, we slowly injected GdL (20 mM in 120 nL of ACSF solution) into the sensory cortex of an anesthetized rat. In accordance with the icv injections, diffusion of GdL in the brain’s extracellular space was limited with most of the signal increase restricted to the injection site (not shown). In addition, GdL clearance was slow with signal enhancement detected for more than 6 h after injection. For comparison, we performed an experiment with parallel injections of GdL and gadolinium−diethylenetriaminepentaacetic acid (Gd−DTPA) in the same animal. Gd−DTPA, a commercially available diagnostic agent (Magnevist), diffuses over significantly longer distances, and washes out comparatively faster than GdL (Figure 4) (24). Collectively, the results from icv and parenchymal injections of GdL suggest that it interacts with extracellular elements that limit its diffusivity. We hypothesize that an interaction of the negatively charged phosphonates with the cell membranes or with the proteins in the extracellular space is occurring.
Figure 4.

A comparison of the diffusivity of Gd−DTPA and GdL following their simultaneous injection in brain tissue: (a) the injection sites of Gd−DTPA (left) and GdL (right) with the corresponding sections (green lines) used to produce the diffusion diagrams; diffusion diagrams for (b) Gd−DTPA and (c) GdL.
Biocompatibility was investigated by recording the neuronal response in the presence of GdL. Combined electrophysiological and fMRI (BOLD contrast) experiments were performed in Long−Evans rats, upon visual stimulations (4 Hz flickering) or under direct intrabrain electric microstimulation (25). Electrophysiological and fMRI data were recorded in the primary visual cortex of anesthetized rats before and after a local injection of GdL (20 mM in 40 nL of ACSF). Figure 5 shows multiunit activity (MUA), reflecting the firing of action potentials by a small group of neurons in the visual cortex in response to the visual stimulation, collected before and after the injection of GdL (red and blue traces, respectively). Stimulus responses in MUA were normal (26) and remained unaltered by the presence of GdL. Accordingly, local field potentials reflecting population postsynaptic potentials, voltage-gated membrane oscillations, and after-polarization effects were also preserved (data not shown). These observations indicate that at the applied concentrations, GdL did not disturb neuronal processing in the brain. In good agreement with these results, the BOLD signals in the cortex during visual stimulation (not shown) and during direct electrical microstimulation were also unaffected (Figure 6).
Figure 5.

Electrophysiological recording. Multiunit activities (MUA) before and after GdL injection. Red and blue traces represent MUAs before and after the injection, respectively. Shaded area (blue) represents the standard error of mean for MUAs after the injection (2−3 h). MUA responses during the stimulated period (shaded as green) remained in a similar way as before and no significant effect on MUA by GdL was observed.
Figure 6.

An fMRI map demonstrating functional activity at the injection site. Percentage signal change (−3 to 3; teal to yellow) of gradient echo EPI with microstimulation after GdL injection overlaid upon T1-weighted MDEFT (modified driven equilibrium Fourier transformed, with 0.2 mm square voxels) anatomy demonstrating functional activity at the injection side. Parameter: activated voxels were selected with p < 0.1, gradient echo EPI and microstimulation as described in the Methods section.
The final series of in vivo MRI experiments involved measuring contrast changes due to neural activation. For that purpose, we performed standard sensory stimuli (visual and somatosensory) and direct brain electric microstimulation targeting callosal fibers. The contrast agent GdL (20 mM in 40 nL of ACSF) was injected unilaterally in the visual or somatosensory cortex, depending on the stimulation used or co-registered with the implanted electrode in electric microstimulation experiments. The hemisphere contralateral to the GdL injection was used as a control. During stimulation, T1 images were acquired. A more detailed description of the applied protocols and analysis is given in the Methods section. The analysis of the above experiments indicated no significant change in T1 upon applied stimuli.
Conclusion
A novel Ca2+-sensitive contrast agent for MRI was successfully synthesized and its initial physicochemical characterization was performed. Unlike other Ca2+-responsive agents, here we see a decrease in r1 with the increase in Ca2+ concentration. This behavior was expected to induce an increase in MR contrast following brain activation, since extracellular Ca2+ concentration is reduced during neuronal depolarization (27). Electrophysiological and BOLD fMRI experiments showed that the presence of millimolar quantities of GdL in the rat brain did not disturb neuronal function, thus demonstrating its biocompatibility. However, administration of GdL in the lateral ventricles and parenchyma indicated that its diffusion in the extracellular space is slow, which was confirmed by parallel injections of GdL and Gd−DTPA in two opposing brain hemispheres and comparison of their washout. An anticipated functional response in T1 MRI experiments during stimulation certainly depends on the extent of changes in extracellular Ca2+ concentration and the corresponding change in r1 of the applied SCA. One of the reasons for an absence of the functional signal could be the insufficient change in r1 of GdL during quite robust stimulation. Additionally, the absence of the functional response might be the result of molecular interactions in brain tissue, which also lead to low diffusivity and prevent the Ca2+ chelator from interacting with the paramagnetic center in the required dynamic manner. This will impede the change in hydration state and consequently the r1 and MR signal. Nevertheless, the feedback obtained from these experiments is essential for the future application of these responsive agents in vivo. Furthermore, this will provide information for the redesign and synthesis of this class of agents and their improved behavior and characteristics.
Methods
Synthesis
General Remarks
1H, 13C{1H}, and 31P{1H} NMR spectra were recorded on a Bruker DRX400 spectrometer at room temperature. Luminescence time-resolved measurements were performed on a QuantaMaster 3 PH fluorescence spectrometer from Photon Technology International, Inc., USA. ESI-LRMS were performed on a ion trap SL 1100 system (Agilent, Germany). ESI-HRMS were performed on a Bruker Daltonics Apex II FT-ICR-MS (Bruker, Germany). FAB-HRMS was recorded on a Finnigan MAT 711A modified by AMD Company. Elemental analyses were obtained on a Vario EL cube (Elementar Analysensysteme GmbH, Germany). Column chromatography was performed using silica gel 60 (70−230 mesh ASTM) from Merck, Germany.
tert-Butyl 5-Bromohexylcarbamate (2)
A solution of NaOH, 0.8 g (20 mmol) in water (30 mL), was added dropwise to a vigorously stirring biphasic mixture consisting of 1 (1.80 g, 10 mmol) in water (50 mL) and Boc2O (1.45 g, 6.7 mmol) in dichloromethane (100 mL). After 3 h, the organic phase was separated and washed with 2 N HCl (50 mL) and a saturated NaCl solution (50 mL). The organic phase was dried over MgSO4 and concentrated under reduced pressure. n-Hexane (20 mL) was added to the oil, and the solution was stored at −20 °C overnight. The product was separated from the solvent, washed with cold n-hexane, and dried under reduced pressure to give 1.73 g (62%) of 2 as a brown oil.
1H NMR (CDCl3): δ 4.73 (s, 1H, NH), 3.19 (t, 2H, 3JHH = 6.8 Hz, BrCH2), 2.94 (m, 2H, NHCH2), 1.65 (tt, 2H, 3JHH = 6.8 Hz, 3JHH = 7.6 Hz, CH2), 1.24 (s, 9H, CH3), 1.22−1.40 (m, 6H, CH2). 13C{1H} NMR (CDCl3): δ 158.6 (CO), 79.9 (C(CH3)3), 40.1, 33.9, 32.8, 30.0 (CH2), 28.5 (CH3), 27.9, 26.1 (CH2). Elem. Anal. Calcd: C 47.15%, H 7.91%, N 5.00%. Found: C 47.22%, H 7.22%, N 5.22%.
Tri-tert-butyl-2,2′,2′′-(10-(3-(tert-butoxycarbonylamino)hexyl)-1,4,7,10-tetraazacyclododecane-1,4,7-triyl)triacetate (3)
Compound 2 (0.98 g, 3.5 mmol) was dissolved in acetonitrile (20 mL) and added to a solution of 1,4,7-tri(t-butoxycarbonylmethyl)cyclen (1.5 g, 2.9 mmol) and K2CO3 (0.48 g, 3.5 mmol) also in acetonitrile (30 mL). After the reaction mixture had been stirred for 16 h at 70 °C, the solution was allowed to cool to room temperature, the inorganic impurities were removed by filtration, and the solution was concentrated under reduced pressure to give a brown oil. The crude product was purified by column chromatography (5% CH3OH in CH2Cl2) to give 1.7 g (82%) of 3 as a brown oil.
1H NMR (CDCl3): δ 4.83 (s, 1H, NH), 2.93−1.26 (m, 26H, CH2), 0.83−0.89 (m, 36H, C(CH3)3), 0.71 (m, 8H CH2). 13C{1H} NMR (CDCl3): δ 172.4, 170.8(COOtBu), 155.8 (COBoc), 82.3, 82.0, 81.6, (C(CH3)3), 56.4, 56.1, 52.2, 51.8, 51.8, 51.6, 40.2, 33.7, 32.4, 29.8 (CH2), 28.4, 28.0, 27.7(C(CH3)3), 27.6, 26.5(CH2). HRMS (FAB) for C37H71N5O8Na: calcd 736.52186, found 736.519995 [M + Na]+.
2,2′,2′′-(10-(3-Aminohexyl)-1,4,7,10-tetraazacyclododecane-1,4,7-triyl)triacetic Acid (4)
Compound 3 (1.70 g, 2.38 mmol) was dissolved in dichloromethane (20 mL), and trifluoroacetic acid (20 mL) was added slowly. After the mixture had been stirred at room temperature for 24 h, the solvents were removed under reduced pressure. Dichloromethane (40 mL) was added and evaporated twice to remove the excess trifluoracetic acid. The same procedure was repeated twice with methanol. The viscous residues were dissolved in a minimum amount of methanol and cold diethylether was added dropwise. The resulting precipitate was isolated by filtration and dissolved in 3 mL of water. A large excess of acetone (100 mL) was added, and the resulting cloudy solution was stored at −20 °C for 16 h. A white crystalline powder was isolated by filtration, washed with acetone, and dried under reduced pressure to give 0.72 g (68%) of 4 as a white crystalline powder.
1H NMR (D2O): δ 3.69 (m, 2H, CH2NH2), 3.40−2.68 (m, 24H, CH2N), 1.61−1.12 (m, 8H, CH2). 13C{1H} NMR (D2O): δ 174.4, 170.1 (COOH), 56.3, 54.3, 53.4, 51.5, 49.9, 48.5, 48.3, 39.4, 26.5, 25.4, 25.3, 22.9 (CH2). HRMS (EI) for C20H39N5O6: calcd 444.2828 [M − H]−; found 444.2828.
2,2′,2′′-(10-(3-(Bis(phosphonomethyl)amino)hexyl)-1,4,7,10-tetraazacyclododecane-1,4,7-triyl)triacetic Acid (L)
Compound 4 (0.72 g, 1.62 mmol) was dissolved in 6 M HCl (10 mL). Phosphoric acid (0.27 g, 3.24 mmol) in water (5 mL) was added to this, and the mixture was heated to reflux temperature. Paraformaldehyde (0.19 g, 6.48 mmol) was added in small portions over 1 h, and the heating was continued for another 24 h. The reaction mixture was then concentrated under reduced pressure, and cold ethanol was added slowly while stirring. The solution was cooled to −20 °C for 12 h. The solid product was isolated by filtration and dried by a prolonged standing under reduced pressure to give 0.60 g (58%) of L as a white powder.
1H NMR (D2O): δ 3.96 (m, 2H, CH2N(CH2PO3H2)2), 2.75−3.31 (m, 28H), 1.53 (m, 4H), 1.18 (m, 4H). 13C{1H} NMR (D2O): δ 174.3, 168.7 (COOH), 56.6, 54.9, 54.3, 53.0, 52.2, 51.9, 50.8, 50.2, 48.2 (d, 1JPC = 33.8 Hz), 25.3, 25.0, 23.2, 22.68. 31P{1H} NMR (D2O): δ 10.23. HRMS (EI) for C22H45N5O12P2: calcd 632.2467 [M − H]−; found 632.2467.
Synthesis of GdL and EuL
An aqueous solution of L was mixed with an equimolar amount of the corresponding LnCl3. The mixture was heated to 90 °C for 24 h. The pH was periodically checked and adjusted to 6.5−7.5 using a 1 M solution of NaOH. After 24 h, the reaction mixture was cooled to room temperature, and NaOH was added to raise the pH to 12. The reaction was passed through a syringe with 0.2 μm nylon filters to remove the excess Ln3+ present as an insoluble hydroxide. A cation exchange resin (Chelex 100) was added to the stirring solution, the suspension was passed through another filter after 1 h, and the solvent was evaporated. The absence of noncoordinated lanthanide ions was confirmed by the xylenol test.
Relaxometric Ca2+ Titrations
All titrations were performed at 9.4 T, 25 °C, and pH 7.3−7.4 (maintained by HEPES buffer). A solution of CaCl2 of known concentration was added stepwise to a solution of GdL, and the longitudinal proton relaxation time, T1, was measured after each addition of the analyte. The r1 was calculated from eq 1 using the Gd3+ concentration at each point of the titration. T1,obs is the observed longitudinal relaxation time, T1,d is the diamagnetic contribution, in the absence of the paramagnetic substance, and [Gd] is the concentration of Gd3+. The initial Gd3+ concentrations were determined by measuring the bulk magnetic susceptibility shifts (28).
| 1 |
Luminescence Lifetime Experiments
The luminescence decay experiments were performed on 5 mM EuL solutions in H2O and D2O (25 °C, pH 7.3, HEPES). The Eu3+ ion was directly excited at 395 nm, and the emission intensity at 615 nm was measured with a 10 μs resolution. The excitation and emission slits were set to 15 and 5 nm bandpass, respectively. Data sets are an average of 25 scans, and each reported value is the mean of three independent measurements. The obtained curves are fitted to a first-order exponential decay with r2 = 0.99. The q values were calculated using eq 2.
| 2 |
Surgery and Anesthesia
Male Sprague−Dawley and Long−Evans rats (250−300 g) were used for in vivo studies. All experiments were approved by the local authorities (Regierungspraesidium) and were in full compliance with the guidelines of the European Community (EUVD 86/609/EEC) for the care and use of the laboratory animals. The animals were anesthetized with 2.0% isoflurane (Forene, Abbott, Wiesbaden, Germany) and placed in a stereotaxic frame (Kopf Instruments). In the case of experiments with electrophysiology or functional magnetic resonance imaging, the animals were anesthetized with urethane (1.5 g/kg, i.p.). For surgery, the local anesthetic xylocain was applied additionally in the surgery area. Bregma, the sagittal suture, and the surface of the brain were used as references for the anterior−posterior (AP), lateral (L), and ventral (V) positioning of injections and electrodes respectively. For the injections within the magnet, a guiding cannula (ID 200 μm, OD 360 μm) was implanted at the site of injection and fixed with dental cement (a small hole was drilled for cannula placement). The injections were done through a 4 m long sharpened fused silica capillary (ID 100 μm, OD 160 μm), placed with the guiding cannula in the brain on one side and a 50 μL Hamilton syringe on the other side. The drive for the 50 μL Hamilton syringes was a modified Kopf micropositioner (model 650). In the case of injections outside the magnet, GdL was stereotaxically injected using a 0.5 μL Hamilton syringe at a rate of 0.5 nL/min under general anesthesia using aseptic techniques. The needle was left in the brain for 15 min postinjection and then retracted stepwise to avoid leakage of the contrast agent along the needle track. During the scan, the isoflurane anesthesia was reduced to 1.5−1.7%. Rats were immobilized on a nonmagnetic stereotaxic head holder. The rat body was placed on a heating pad to maintain a body temperature of 37 °C. GdL (20 mM in 250 nL ACSF solution) at pH 7.4 was injected slowly over a period of 20−40 min.
MRI Experiments
The MRI experiments were conducted with custom-made saddle or quad coils integrated in the stereotaxic holder. The in vivo diffusion studies were performed with a 7 T 300 MHz NMR system (BioSpec 70/60v, Bruker Medical, Ettlingen Germany), using a T1-weighted spin echo sequence (MSME, multislice multiecho) and a T1-weighted gradient echo sequence (FLASH, fast low angle shot). The MSME imaging was done with the following parameters: field of view (FOV) 168 mm × 69 mm, voxel size 33 μm × 27 μm × 67 μm, flip angle (FA) 90°, echo time (TE) 16 ms, repetition time (TR) 1000 ms, one average and a volume time of ∼4 min per repetition. The FLASH imaging was done with the following parameters: FOV 48 mm × 34 mm, voxel size 20 μm × 20 μm × 50 μm, FA 10°, TE 9 ms, TR 80 ms, 4 averages and a volume time of ∼40 s per repetition. The in vivo fMRI experiments with visual (4 Hz flickering), whisker (air puffs), electrical hindpaw stimulations, or in brain microstimulation were performed on a 4.7 T 200 MHz NMR system (BioSpec.47/40v, Bruker Medical, Ettlingen Germany). For BOLD imaging, a gradient echo EPI (echo-planar imaging) sequence was used, typically with the following parameters: FOV 32 mm × 26 mm, voxel size 0.4 mm × 0.4 mm × 1.5 mm, FA 40°, TE 20 ms, TR 750 ms, 8 segments and a volume time of 6 s. For experiments with microstimulation, faster gradient echo EPI was chosen using the parameters: FOV 32 mm × 26 mm, voxel size 0.5 mm × 0.5 mm × 1 mm FA 30°, TE 10 ms, TR 500 ms, one segment and a volume time of 500 ms. For fast T1 measurements, an inversion recovery gradient echo EPI sequence with 16 variable inversion delays of 15−3000 ms was used (29) to acquire sets of 16 images with a temporal resolution of 4.5 min for every set. The EPI parameters were similar to the BOLD EPI used for microstimulation, but with 2 segments, a TE of 8 ms, and a TR of 3.5 s.
For stimulation protocols, block designs were used consisting of varying on/off-periods. For example, for aquiring the functional map in Figure 6, (8/8/32)*8 volumes for off/on/off were used. For visual stimulation, a custom-made LED array was used to produce luminance flickering of 4 Hz. For paw stimulation, a pair of needles was placed under the skin of the hindpaw. During the stimulation periods, monophasic 0.3 ms pulses with 3 Hz up to a current strength of 2 mA were applied. The whisker stimulation was done with 100 ms long air puffs repeated every 0.5 s while the whole barrel field was constantly stimulated.
A current intensity of 750 μA was used to do monopolar microstimulation, by applying biphasic 0.2 ms long pulses with 300 Hz in alternating pulse trains of 50 and 150 ms for the on and off periods, respectively.
The MRI data was analyzed with custom-made programs in MATLAB (The Mathworks, Natick, MA), together with statistic parametric mapping packages (SPM5 (30)). T1 values and the corresponding error maps were obtained by fitting the single voxel data of the inversion recovery gradient echo EPI sets to eq 3(31).
| 3 |
The time series of functional data, including the T1 maps, were detrended, bandpassed, and spatially smoothed with a Gaussian kernel (e.g., 3 pixels × 3 pixels with 1.5σ). Statistical maps were generated by using general linear modeling. In Figure 6, the map was created from voxels with a significance of p < 0.1 and the use of a clustering algorithm to eliminate randomly activated voxels. A threshold of 14 coactivated voxels was used to select clusters detected with 18 neighboring connectivities.
Electrophysiology
A glass pipet electrode (filled with 3 M NaCl, 130 kΩ measured at 1 kHz) was stereotaxically placed in the primary visual cortex. Visual stimulus flickering at 4 Hz was presented for 260 s between blank periods without stimulus. Broadband neural signals including local field potentials and spiking activity were amplified by a custom-made amplifier and digitized with a 16 bit AD converter (PCI-6052E; National Instruments) operating at 20.8 kHz. Data collection and stimulus timings were controlled by custom-made software running on QNX real time OS (QNX, Ottawa, Canada). The acquired data was analyzed off-line using custom-made programs in MATLAB (The MathWorks, Natick, MA). The signal was processed in eight frequency bands: 1−8, 8−12, 12−24, 24−40, 40−60, 60−100, and 120−250 Hz as local field potentials (LFPs) and 1000−3000 Hz as MUA. Appropriate downsampling and bandpass filtering (zero phase distortion by bidirectional processing) were used to avoid singularities of digital filtering. The signal was then converted into absolute amplitude, resampled to 250 Hz after the appropriate low-pass filtering, and normalized to standard deviation units (SDU) based on blank periods. Frequency separation was based on results from theoretical analysis (32).
Acknowledgments
The authors would like to thank Dr. Eva Toth and Dr. Josef Pfeuffer for their helpful discussions.
Instituto de Neurociencias CSIC-UMH, Campus de San Juan, 03550 San Juan de Alicante, Spain.
This work was supported by the Max-Planck Society, the Hertie Foundation, the Louis-Jeantet Foundation, DFG (Grant AN 716/2-1), HFSPO (long-term fellowship to S.C.), and the Fonds der Chemischen Industrie (Ph.D. scholarship to J.H.).
References
- Kandel E. R., Schwartz J. H., Jessell T. M. (2000) Principles of Neural Science, 4th ed., McGraw-Hill, New York; London. [Google Scholar]
- Merbach A. E., Toth E. (2001) The Chemistry of Contrast Agents in Medical Magnetic Resonance Imaging, Wiley, Chichester, U.K. [Google Scholar]
- Caravan P.; Ellison J. J.; McMurry T. J.; Lauffer R. B. (1999) Gadolinium(III) chelates as MRI contrast agents: Structure, dynamics, and applications. Chem. Rev. 99, 2293–2352. [DOI] [PubMed] [Google Scholar]
- Que E. L.; Chang C. J. (2010) Responsive magnetic resonance imaging contrast agents as chemical sensors for metals in biology and medicine. Chem. Soc. Rev. 39, 51–60. [DOI] [PubMed] [Google Scholar]
- Jasanoff A. (2007) MRI contrast agents for functional molecular imaging of brain activity. Curr. Opin. Neurobiol. 17, 593–600. [DOI] [PMC free article] [PubMed] [Google Scholar]
- Jasanoff A. (2007) Bloodless fMRI. Trends Neurosci. 30, 603–610. [DOI] [PubMed] [Google Scholar]
- Logothetis N. K. (2008) What we can do and what we cannot do with fMRI. Nature 453, 869–878. [DOI] [PubMed] [Google Scholar]
- Logothetis N. K.; Wandell B. A. (2004) Interpreting the BOLD signal. Annu. Rev. Physiol. 66, 735–769. [DOI] [PubMed] [Google Scholar]
- Major J. L.; Parigi G.; Luchinat C.; Meade T. J. (2007) The synthesis and in vitro testing of a zinc-activated MRI contrast agent. Proc. Natl. Acad. Sci. U.S.A. 104, 13881–13886. [DOI] [PMC free article] [PubMed] [Google Scholar]
- Dhingra K.; Fouskova P.; Angelovski G.; Maier M. E.; Logothetis N. K.; Toth E. (2008) Towards extracellular Ca2+ sensing by MRI: synthesis and calcium-dependent 1H and 17O relaxation studies of two novel bismacrocyclic Gd3+ complexes. J. Biol. Inorg. Chem. 13, 35–46. [DOI] [PMC free article] [PubMed] [Google Scholar]
- Atanasijevic T.; Shusteff M.; Fam P.; Jasanoff A. (2006) Calcium-sensitive MRI contrast agents based on superparamagnetic iron oxide nanoparticles and calmodulin. Proc. Natl. Acad. Sci. U.S.A. 103, 14707–14712. [DOI] [PMC free article] [PubMed] [Google Scholar]
- Shapiro M. G.; Atanasijevic T.; Faas H.; Westmeyer G. G.; Jasanoff A. (2006) Dynamic imaging with MRI contrast agents: Quantitative considerations. Magn. Reson. Imaging 24, 449–462. [DOI] [PubMed] [Google Scholar]
- Adzamli I. K.; Gries H.; Johnson D.; Blau M. (1989) Development of phosphonate derivatives of gadolinium chelates for NMR imaging of calcified soft tissues. J. Med. Chem. 32, 139–144. [DOI] [PubMed] [Google Scholar]
- Kubicek V.; Rudovsky J.; Kotek J.; Hermann P.; Elst L. V.; Muller R. N.; Kolar Z. I.; Wolterbeek H. T.; Peters J. A.; Lukes I. (2005) A bisphosphonate monoamide analogue of DOTA: A potential agent for bone targeting. J. Am. Chem. Soc. 127, 16477–16485. [DOI] [PubMed] [Google Scholar]
- Vitha T.; Kubicek V.; Hermann P.; Elst L. V.; Muller R. N.; Kolar Z. I.; Wolterbeek H. T.; Breeman W. A. P.; Lukes I.; Peters J. A. (2008) Lanthanide(III) complexes of bis(phosphonate) monoamide analogues of DOTA: Bone-seeking agents for imaging and therapy. J. Med. Chem. 51, 677–683. [DOI] [PubMed] [Google Scholar]
- Matczak-Jon E.; Kurzak B.; Kamecka A.; Sawka-Dobrowolska W.; Kafarski P. (1999) Interactions of zinc(II), magnesium(II) and calcium(II) with iminodimethylenediphosphonic acids in aqueous solutions. J. Chem. Soc., Dalton Trans. 3627–3637. [Google Scholar]
- Jakupec M. A.; Galanski M.; Keppler B. K. (2003) Tumour-inhibiting platinum complexes-state of the art and future perspectives. Rev. Physiol., Biochem. Pharmacol. 146, 1–53. [DOI] [PubMed] [Google Scholar]
- Bloemink M. J.; Diederen J. J. H.; Dorenbos J. P.; Heetebrij R. J.; Keppler B. K.; Reedijk J. (1999) Calcium ions do accelerate the DNA binding of new antitumor-active platinum aminophosphonate complexes. Eur. J. Inorg. Chem. 1655–1657. [Google Scholar]
- Demadis K. D.; Stavgianoudaki N.; Grossmann G.; Gruner M.; Schwartz J. L. (2009) Calcium-phosphonate interactions: Solution behavior and Ca2+ binding by 2-hydroxyethylimino-bis(methylenephosphonate) studied by multinuclear NMR spectroscopy. Inorg. Chem. 48, 4154–4164. [DOI] [PubMed] [Google Scholar]
- Popov K.; Ronkkomaki H.; Lajunen L. H. J. (2001) Critical evaluation of stability constants of phosphonic acids (IUPAC technical report). Pure Appl. Chem. 73, 1641–1677. [Google Scholar]
- Somjen G. G. (2004) Ions in the Brain: Normal Function, Seizures, and Strokes, Oxford University Press, New York; Oxford. [Google Scholar]
- Kay A. R. (2003) Evidence for chelatable zinc in the extracellular space of the hippocampus, but little evidence for synaptic release of Zn. J. Neurosci. 23, 6847–6855. [DOI] [PMC free article] [PubMed] [Google Scholar]
- Major J. L.; Boiteau R. M.; Meade T. J. (2008) Mechanisms of Zn-II-Activated Magnetic Resonance Imaging Agents. Inorg. Chem. 47, 10788–10795. [DOI] [PMC free article] [PubMed] [Google Scholar]
- Liu C. H.; D’Arceuil H. E.; de Crespigny A. J. (2004) Direct CSF injection of MnCl2 for dynamic manganese-enhanced MRI. Magn. Reson. Med. 51, 978–987. [DOI] [PubMed] [Google Scholar]
- Canals S.; Beyerlein M.; Merkle H.; Logothetis N. K. (2009) Functional MRI evidence for LTP-induced neural network reorganization. Curr. Biol. 19, 398–403. [DOI] [PubMed] [Google Scholar]
- Detejada P. H.; Green D. G.; Tedo C. M. (1992) Visual thresholds in albino and pigmented rats. Visual Neurosci. 9, 409–414. [DOI] [PubMed] [Google Scholar]
- Nicholson C.; ten Bruggencate G.; Stockle H.; Steinberg R. (1978) Calcium and potassium changes in extracellular microenvironment of cat cerebellar cortex. J. Neurophysiol. 41, 1026–1039. [DOI] [PubMed] [Google Scholar]
- Corsi D. M.; Platas-Iglesias C.; van Bekkum H.; Peters J. A. (2001) Determination of paramagnetic lanthanide(III) concentrations from bulk magnetic susceptibility shifts in NMR spectra. Magn. Reson. Chem. 39, 723–726. [Google Scholar]
- Duong T. Q.; Silva A. C.; Lee S. P.; Kim S. G. (2000) Functional MRI of calcium-dependent synaptic activity: Cross correlation with CBF and BOLD measurements. Magn. Reson. Med. 43, 383–392. [DOI] [PubMed] [Google Scholar]
- www.fil.ion.ucl.ac.uk/spm.
- Kim S. G.; Hu X. P.; Ugurbil K. (1994) Accurate T1 determination from inversion recovery images: Application to human brain at 4 T. Magn. Reson. Med. 31, 445–449. [DOI] [PubMed] [Google Scholar]
- Belitski A.; Gretton A.; Magri C.; Murayama Y.; Montemurro M. A.; Logothetis N. K.; Panzeri S. (2008) Low-frequency local field potentials and spikes in primary visual cortex convey independent visual information. J. Neurosci. 28, 5696–5709. [DOI] [PMC free article] [PubMed] [Google Scholar]