

Abstract
Chronic exposure to manganese results in neurological symptoms referred to as manganism and is identified as a risk factor for Parkinson’s disease. In vitro, manganese induces cell death in the dopaminergic cells, but the mechanisms of manganese cytotoxicity are still unexplained. In particular, the subcellular distribution of manganese and its interaction with other trace elements needed to be assessed. Applying synchrotron X-ray fluorescence nanoimaging, we found that manganese was located within the Golgi apparatus of PC12 dopaminergic cells at physiologic concentrations. At increasing concentrations, manganese accumulates within the Golgi apparatus until cytotoxic concentrations are reached resulting in a higher cytoplasmic content probably after the Golgi apparatus storage capacity is exceeded. Cell exposure to manganese and brefeldin A, a molecule known to specifically cause the collapse of the Golgi apparatus, results in the striking intracellular redistribution of manganese, which accumulates in the cytoplasm and the nucleus. These results indicate that the Golgi apparatus plays an important role in the cellular detoxification of manganese. In addition manganese exposure induces a decrease in total iron content, which could contribute to the overall neurotoxicity.
Keywords: Manganese, PC12, Golgi apparatus, Parkinson’s disease, synchrotron, PIXE
Chronic exposure to manganese (Mn) is toxic to the brain, resulting in manganism (1), a neurological disorder with similar symptoms to Parkinson’s disease (PD). Manganism principally occurs after occupational exposures such as in the case of miners, smelters, and welders (2). Manganese intoxication has also been reported after long-term parenteral nutrition (3), and after the illicit use of methcathinone, a stimulant with euphoric effects, which contains manganese (4). In addition, occupational exposures to manganese are suspected to increase the risk of PD (5,6), as well as the association with high iron in dietary intakes (7). From a neuropathological perspective, both idiopathic PD and manganism are characterized by alteration of the basal ganglia and loss of dopamine levels (8). However, the primary target for Mn neurotoxicity is the globus pallidus (GP), whereas in PD the degeneration of dopaminergic neurons occurs in the substantia nigra pars compacta (SNpc).
The mechanisms of manganese neurotoxicity on dopaminergic cells have been studied in vitro, using cellular models such as the rat pheochromocytoma cell line PC12. Early studies have shown that manganese has a specific toxicity toward PC12 cells and that it can alter dopamine metabolism (9). There are some controversial results concerning the possible intracellular targets of Mn (10). It is generally accepted that Mn accumulates within the mitochondria of neuronal cells (11,12). However, a recent report suggests that less than 0.5% of intracellular Mn is found in the mitochondrial fraction and that Mn rather accumulates into the nucleus and cytoplasm of PC12 cells (13).
On the other hand, the disruption of iron (Fe) homeostasis has also been reported to play an important role in Mn neurotoxicity (14). The two metals compete for the same binding protein in serum (transferrin) and subsequent transport systems (divalent metal transporter, DMT). But here again there are some conflicting results. Zheng (15) observed an increase of Fe uptake following manganese exposure in PC12 cells, whereas Kwik and Smith (16) reported that the total Fe content did not change in the same cells, except at high Mn exposure with a slight decrease of iron.
The two specific aims of this study were (1) to determine the intracellular distribution of Mn into single PC12 cells using the recently developed synchrotron radiation X-ray fluorescence (SXRF) nanoprobe and (2) to quantify the trace element content, particularly of Fe and Mn, using particle-induced X-ray emission microanalysis (PIXE) and backscattering spectrometry (BS). The use of direct analytical methods for chemical element imaging offers the possibility to identify the subcellular compartments where trace elements are located and to quantify their content, without almost any sample preparation and avoiding any possible contamination, redistribution, or loss of trace elements (17).
Results
Cytotoxicity
Cytotoxicity measurements using MTT assays on PC12 cells revealed cell death occurring after 24 h exposure to manganese chloride. Cell viability was expressed as the percentage versus the untreated control (Figure 1). The cytotoxicity measurements show that manganese chloride becomes slightly toxic at 150 μM. At 300 μM, MnCl2 cell viability is 75%. This result is in good agreement with other studies of manganese cytotoxicity on PC12 cells as determined by MTT assay (18,19).
Figure 1.

Dose dependent cytoxicity of MnCl2 in PC12 cells determined by MTT assay. Results are shown as mean ± the standard error from three separate experiments. The ∗ indicates P < 0.001 vs control group (Student’s t test).
Golgi Apparatus and Endoplasmic Reticulum Localization
Golgi apparatus (GA) was labeled with the GFP-Golgi Organelle Lights probe, and we could observe that this organelle lay near one side of the nucleus in PC12 cells (Figure 2B,D). A different distribution was obtained for the GFP-endoplasmic reticulum labeling that extended almost through all the cytoplasm with a marked fluorescence all around the nucleus (Figure 2F,H). These results are in good agreement with the previously observed localization of Golgi apparatus in PC12 cells, localized near one side of the nucleus, and of endoplasmic reticulum found in the cytoplasm and all around the nucleus, either by electron microscopy (20) or by immunocytostaining (21,22).
Figure 2.

Golgi apparatus and endoplasmic reticulum localization in PC12 cells: (A, C, E, G) optical images of PC12 cells in culture medium; (B, D) green fluorescence of Golgi apparatus (the same fields of view as A and C); (F, H) green fluorescence of endoplasmic reticulum (the same fields of view as E and G).
X-ray Fluorescence Nanoimaging
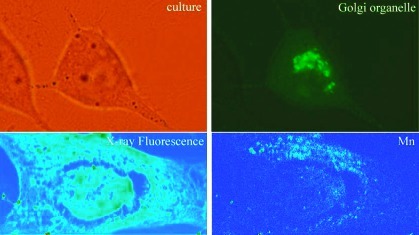
X-ray fluorescence images reveal that in unexposed PC12 cells (control), Mn is located in a perinuclear region, always on one side of nucleus, identified as the Golgi apparatus (Figure 3). When cells are exposed to a subcytotoxic dose of Mn (100 μM), the same distribution is found (Figure 4). At higher Mn concentration (300 μM), Mn is also localized in the perinuclear region although the distribution is more diffuse than that shown in Figures 3 and 4 with Mn evidenced in the cytoplasm, as also confirmed by quantitative analysis (see below) (Figure 5).
Figure 3.

X-ray fluorescence images of intracellular elements in control PC12 cells. Panels A and B show optical images of PC12 cells after cryofixation and freeze-drying. The black squares indicate the analyzed zones by SXRF. At the right of optical images, the X-ray fluorescence images of intracellular elements K, Mn, and Zn are shown. Color scale bar indicates the intensity of X-rays, which increases from blue to red.
Figure 4.

X-ray fluorescence images of intracellular elements in PC12 cells exposed to 100 μM manganese during 24 h. Panels A and B show optical images of PC12 cells after cryofixation and freeze-drying. The black squares indicate the analyzed zones by SXRF. At the right of each optical image, the X-ray fluorescence images of intracellular elements K, Mn, and Zn are shown. Color scale bars indicate the intensity of X-rays, which increases from blue to red.
Figure 5.

X-ray fluorescence images of intracellular elements in PC12 cells exposed to 300 μM manganese during 24 h. Panels A and B show optical images of PC12 cells after cryofixation and freeze-drying. The black squares indicate the analyzed zones by SXRF. At the right of each optical image, the X-ray fluorescence images of intracellular elements K, Mn, and Zn are shown. Color scale bars indicate the intensity of X-rays, which increases from blue to red.
The distribution of Mn is specific to this organelle because other elements like K or Zn are distributed differently in the cells. Potassium and zinc are quite homogeneously distributed, proportionally to the cell thickness, which explains the higher signal in the nucleus, as expected from the ubiquitous distribution of these elements in cells. The specificity of Mn accumulation in the GA is also evidenced by the action of brefeldin A, a lactone antibiotic known to cause the specific disintegration of the GA (23). After cell exposure to Mn and brefeldin A, manganese is redistributed within the cell showing a homogeneous distribution similar to those of K and Zn (Figure 6).
Figure 6.

X-ray fluorescence images of intracellular elements in PC12 cells exposed to 300 μM manganese during 24 h and 30 μg/mL of brefeldin A during 4 h. Panels A and B show optical images of PC12 cells after cryofixation and freeze-drying. The black squares indicate the analyzed zones by SXRF. At the right of each optical image, the X-ray fluorescence images of intracellular elements K, Mn, and Zn are shown. Color scale bars indicate the intensity of X-rays, which increases from blue to red.
As explained in the Methods section, using PyMCA software, we have calculated the proportion of manganese in GA, nucleus, and cytoplasm (excluding GA) compared with the whole cell. For control cells and cells exposed to 100 μM of Mn (nontoxic concentration), we found on average 60% of manganese in the GA, 20% in the nucleus, and 20% in the rest of the cytoplasm. For cells exposed to 300 μM of Mn (toxic concentration), we obtained on average 40% of manganese in the GA, 20% in the nucleus, and 40% in the rest of the cytoplasm. When cells are exposed to 300 μM of Mn and brefeldin A, 45% of Mn accumulates in the nucleus and 55% in the cytoplasm.
Elemental Quantification
Using the same samples analyzed by SXRF, we quantified the elemental concentration in the cells by combination of two ion beam analysis methods, PIXE and BS. Quantitative data reveal that manganese accumulation is not proportional to the exposed dose and that iron decreases in PC12 cells exposed to manganese (Table 1). On the other hand, using BS, we measured that the areal mass of a single cell is about 100 μg/cm2 and the surface of a PC12 cell being on average 400 μm2 the dry mass of a single PC12 cell is about 0.4 ng. Taking into account this single cell mass, the quantitative values of total intracellular manganese obtained by PIXE/BS, and the percentage of Mn in each cell compartment obtained by SXRF, we were able to calculate the total content of manganese in GA, cytoplasm, and nucleus (Table 2). As an example to illustrate this calculation at 100 μM Mn exposure, when the total concentration of Mn is 10 μg/g, it means that in total there is 4 × 10⁻¹⁵ g of Mn in a single PC12 cell. Knowing that at 100 μM Mn exposure, 60% of total Mn is located in the GA, we obtain that the absolute amount of Mn into the GA is 2.4 × 10⁻¹⁵ g.
Table 1. Elemental Concentration in PC12 Cells Determined by Ion Beam Analyses Combining PIXE and BSa.
| element | control (n = 15) | manganese, 100 μM (n = 9) | manganese, 300 μM (n = 9) | manganese, 300 μM + brefeldin A 30 μg/mL (n = 12) |
|---|---|---|---|---|
| K | 27600 ± 5000 | 21400 ± 4400 | 20300 ± 7700 | 22900 ± 3900 |
| Ca | 440 ± 170 | 310 ± 180 | 490 ± 190 | 540 ± 190 |
| Mn | <3 | 10 ± 3 | 75 ± 45 | 202 ± 63 |
| Fe | 81 ± 16 | 63 ± 13b | 45 ± 5b | 64 ± 13b |
| Cu | 19 ± 5 | 14 ± 7 | 10 ± 9 | 9 ± 2 |
| Zn | 141 ± 22 | 116 ± 12 | 111 ± 22 | 116 ± 21 |
Mean concentration and standard deviation, expressed in μg of element per g of dry mass, for each element at different exposure conditions. We can observe that following Mn exposure, iron content diminishes in the cell and Mn increases but not proportionally to the exposed dose. Iron detriment is statistically different when manganese exposure occurs compared with the control case (p < 0.01) using Wilcoxon test. For the other elements, the differences between exposures are not significant (p > 0.05). n = number of analyses.
p < 0.01.
Table 2. Absolute Mn Content in Different Compartments of PC12 Cells after Different Mn Exposures. a.
| Mn content |
||||
|---|---|---|---|---|
| Mn exposure | whole cell (×10−15 g) | Golgi (×10−15 g) | cytoplasm (×10−15 g) | nucleus (×10−15 g) |
| Control | <1.2 | <0.72 | <0.24 | <0.24 |
| 100 μM MnCl2 | 4 | 2.4 | 0.8 | 0.8 |
| 300 μM MnCl2 | 30 | 12 | 12 | 6 |
| 300 μM MnCl2 + 30 μg/mL brefeldin A | 80 | 44 | 36 | |
Mn content in each cell compartment was calculated by multiplying the Mn concentration (measured by PIXE/BS and expressed in μg/g) by the mean dry cell mass (measured by BS and expressed in ng) and by the average Mn percentage in each cell compartment (measured by SXRF).
Discussion
Manganese Subcellular Localization and Toxicity
Manganese is an essential trace element for development and functioning of the brain, and chronic exposure to excess levels of Mn leads to neurotoxic symptoms; however, its subcellular distribution at physiological and toxicological concentrations remained to be elucidated. Up to now, there was no report of the subcellular distribution of manganese at physiological concentration, due to the lack of appropriate analytical techniques. Several studies have pointed out that the intramitochondrial accumulation of manganese in neuronal cells (12,24) is thought to play a critical role in neurotoxic effects by disruption of mitochondrial activity (10,11,25). But according to a recent report, manganese accumulation within other cell compartments, such as the cytoplasm and nucleus, seems also to occur (13). Using the direct chemical imaging nano-SXRF method, we evidenced that Mn is located principally within the Golgi apparatus of PC12 cells cultured in normal conditions, without adding Mn to the culture medium (Figure 3). The Mn concentration in RPMI medium supplemented with sera is below 0.2 μM (26). At higher concentrations of Mn in the culture medium, 100 and 300 μM, Mn also accumulates in the GA (Figures 4 and 5). In addition when GA is specifically altered by brefeldin A, manganese distribution is totally different and displays a homogeneous distribution in the cytoplasm and nucleus (Figure 6). In the study of Morello (12), the Golgi apparatus could not be identified because contrast in the electron microscope images was too low and only a partial observation of intracellular Mn could be performed because the sample preparation used for electron microscopy resulted in about 50% loss of intracellular manganese. In the same way, Gavin (24) separated mitochondria, and not other organelles such as the GA, by centrifugation. Therefore the direct chemical imaging by nano-SXRF is an important achievement because it enables the detection of manganese in whole PC12 cells, avoiding any partial determination due to limitation in sample preparation, and clearly revealed that manganese accumulates primarily in the Golgi apparatus.
The quantitative intracellular distribution of manganese, as determined in whole PC12 cells not exposed and exposed to 100 μM MnCl2, indicates that the major part of manganese partitions in the GA at physiologic and subcytotoxic concentrations (Table 2), suggesting an unexpected role for the GA in Mn homeostasis. At cytotoxic concentration, the picture is slightly different; Mn is still preferentially located in the GA but a higher proportion is found in the cytoplasm and the nucleus (Table 2). These data suggest that Mn toxicity could occur when the storage capacity of the GA is exceeded, resulting in a net increase of Mn content in the cytoplasm and the nucleus, where it can reach critical targets such as the mitochondria or the genomic DNA.
In addition, when GA integrity is altered using brefeldin A, Mn is redistributed within the whole cell, reaching a relatively high amount in the cytoplasm and nucleus (Table 2). The effect of brefeldin A also results in the higher Mn cellular accumulation for the same Mn exposure (Table 1). It is interesting to note that from 100 to 300 μM Mn, total Mn content increases a factor 7.5, from 4 × 10⁻¹⁵ to 30 × 10−15 g, whereas the extracellular concentration is only increased by a factor 3. And this difference is more accentuated, from 4 × 10⁻¹⁵ g to 80 × 10−15 g, when the GA is disrupted. This late result suggests that the GA plays a role in the efflux of Mn outside the cell, preventing cytotoxic effects.
In yeast, there is evidence that the main system for preventing Mn toxicity is its removal from the cytoplasm via accumulation in the GA and an efflux via exocytosis (27). A similar observation is made in plants such as Arabidopsis thaliana, Golgi-based manganese accumulation resulting in manganese tolerance through vesicular trafficking and exocytosis (28). In a different field of research, it has been shown that anticancer drugs accumulate in the trans-Golgi resulting in the prevention of drug accumulation in other compartments of human cells and decreasing in this way the cytotoxicity (29). Our results suggest that a similar mechanism of manganese detoxification could exist in PC12 cells.
Manganese was already known to induce oxidative stress in endoplasmic reticulum (30,31) and to disrupt normal membrane trafficking along the secretory pathway (32). The interaction of Mn with the Golgi apparatus and secretory pathway is especially interesting regarding the possible involvement of Mn in the alteration of dopamine metabolism and in the etiology of PD. It has been evidenced that parkin, a protein mutated in the familial cases of PD, protects against Mn toxicity in dopaminergic cells but not in nondopaminergic cells (33). Treatment with manganese resulted in accumulation of parkin protein in SH-SY5Y dopaminergic cells and its redistribution to the perinuclear region, especially aggregated Golgi complex, while in nondopaminergic Neuro-2a cells neither expression nor redistribution of parkin was noted. Our data could explain why the parkin protein is redistributed to the Golgi apparatus in dopaminergic cells. A recent report also revealed that yeast PARK9 helps to protect cells from manganese toxicity (34). Therefore proteins involved in the prevention of PD, such as parkin and PARK9, could have a direct role in Mn neuroprotection by preventing the alteration of Golgi apparatus. There is increasing evidence that the alteration of the Golgi apparatus by fragmentation and aggregation of misfolded or aberrant proteins could contribute to the pathogeneses of neurodegeneration (35).
Alteration of Iron Homeostasis
Among the possible mechanisms of manganese neurotoxicity, one hypothesis currently under investigation is that manganese exposure could cause dysregulation of cellular iron metabolism. In PC12 cells exposed to 300 μM MnCl2 for 24 h, we noticed a statistically significant decrease of total iron content, from 81 to 45 μg/g. At 100 μM MnCl2, the iron decrease was less pronounced but still statistically significant, from 81 to 63 μg/g. Kwik-Uribe et al. (16,36) noticed a slight decrease of iron in Mn exposure conditions similar to ours (200 μM during 24 h), although the difference was not statistically significant. In a previous study, Zheng and Zhao (15) noticed an increase of iron net uptake in PC12 cells exposed to 200 μM MnCl2 for 3 days. However, in this study an excess of nonradioactive Fe and transferrin was added to the culture medium together with radiolabeled iron. Therefore in the light of our results, the observed increase in Fe net uptake could be consecutive to the Fe intracellular depletion due to 3 days of Mn exposure and the addition of Fe.
The transferrin receptor and the divalent metal transporter protein (DMT), two iron transporters, have been implicated as putative Mn transporters; both proteins are expressed in PC12 cells (37). The competition of Mn and Fe for both of these transporters explains the well demonstrated increase in brain Mn in case of Fe deficiency (14). However, the effect of Mn exposure on Fe concentration has been less investigated. Chronic Mn exposure in adult rats led to a 32% decrease in plasma Fe (38). In developing rats, a high Mn diet resulted in changes in hematological parameters similar to those seen with iron deficiency: decreased plasma Fe and increased plasma transferrin (39). We noticed, at the cellular level, a decrease in total iron content when manganese exposure occurs, suggesting that Mn can compete with Fe for intracellular binding sites.
Conclusion
Our results revealed that the Golgi apparatus plays an unexpected role in the subcellular storage of Mn at physiologic and toxic concentrations of Mn. The accumulation of Mn in the Golgi apparatus could have a preventing effect on Mn cytotoxicity, but as a consequence, high doses of Mn could disturb the vesicular trafficking of the dopamine cell. We have also evidenced that if the GA is altered, Mn reaches the nucleus and cytoplasm in higher proportion. In this case, critical targets such as the mitochondria or the genomic DNA could be damaged, leading to neuronal cell death. We also found that total iron content diminishes in cells exposed to manganese, which could indicate a competition between iron and manganese for intracellular binding sites and transport mechanisms.
Methods
Cell Culture
Rat pheochromocytoma PC12 cells were used as an in vitro model of dopaminergic cells (40). PC12 cells were routinely maintained in RPMI 1640 medium (2.0 g/L glucose, 2 mM glutamine) supplemented with 10% horse serum, 5% fetal bovine serum (Sigma), and 100 U/mL penicillin−streptomycin at 37 °C in a water-saturated atmosphere containing 5% CO2. For chemical nanoimaging, cells were cultured directly on sample holders specially adapted for X-ray fluorescence analysis as recently described (41). Briefly, about 2 × 10⁴ PC12 cells were split directly onto a 2 μm thin polycarbonate foil treated with gelatin gel mounted on a ESRF-ID22 sample holder with a 5 mm hole. PC12 cells were treated with NGF (nerve growth factor) at 100 ng/mL every 2 days during 8 days in order to obtain neuronal-like differentiated chromaffin cells. Exposure to manganese was carried out after NGF treatment.
Cytotoxicity
Manganese cytotoxicity in PC12 cells was measured by MTT assay (Sigma). PC12 cells were seeded in 96-well plates at 5 × 10³ cells per well. After 72 h incubation, manganese was given at various concentrations (50 μM, 150 μM, 300 μM, 1 mM, 2 mM) for 24 h, and cells were further cultured for 24 h without manganese. After treatment and following the Sigma protocol, 100 μL of medium at 10% MTT was added, and cells were incubated for 4 h at 37 °C. The medium was removed, and cells were lysed in 100 μL of MTT solvent. The absorbance at 570 nm was measured with a microplate reader (Bio-Rad).
Sample Preparation for Microanalysis
Cells were exposed to 100 and 300 μM of MnCl2 for 24 h, medium was replaced with fresh medium, and cells rested for 24 h under normal conditions. After this time, cells were cryofixed in liquid isopentane cooled by liquid nitrogen (−160 °C) and freeze-dried at −35 °C. This protocol allows preservation of the integrity of cellular morphology and chemical element distribution in the cells, so sample preparation does not induce any morphological or chemical modification (26,41).
Brefeldin A Treatment
Cells were exposed to 300 μM MnCl2 for 24 h. After that time, medium was removed, and cells were incubated with fresh medium at 30 μg/mL brefeldin A for 4 h as described by other authors also using PC12 cells (42). Cells were then cryofixed and freeze-dried as previously explained.
Golgi Apparatus and Endoplasmic Reticulum Marked by Fluorescence Proteins
PC12 cells were transduced with Organelle Lights reagent (Invitrogen). The reagent contains a baculovirus (BacMam technology) that introduces into mammalian cells the expression of autofluorescent proteins that are localized to specific subcellular compartments and organelles. In this experiment green fluorescent protein (GFP) was used to mark separately the Golgi apparatus and the endoplasmic reticulum (Organelle Lights O36215 and O36212, respectively). The targeting sequences are, respectively, the Golgi-resident N-acetylgalactosaminyltransferase-2 and ER signal sequence of calreticulin and KDEL. PC12 cells were transduced according to the manufacturer’s instructions of Invitrogen. Three days after transduction, organelle fluorescence was observed in living cells using an epifluorescence microscope (BX51, Olympus, Tokyo, Japan) and an U-MNIB2 filter.
Synchrotron X-ray Fluorescence Nanoimaging
The experiments were conducted at ESRF (European Synchrotron Radiation Facility) on the nanoimaging facility ID22NI. The experimental station is located at a distance of 64 m from the undulator source and at 37 m from the high power slits used as secondary source in the horizontal direction. The synchrotron radiation is focused by an X-ray optical device consisting of two elliptically shaped mirrors acting in two orthogonal planes using the so-called Kirkpatrick−Baez geometry (43). The first mirror, coated with a graded multilayer, plays the role of both vertical focusing device and monochromator, resulting in a very high and unique X-ray flux (up to 1012 photons/s) at energies between 15 and 29 keV. In this case, the energy of the pink photon beam was 16.4 keV, the flux was 3.4 × 10¹¹ photons/s, and the spatial resolution was 220 nm × 90 nm (V × H).
The sample, mounted in air on a piezo nanopositioner stage, is scanned through the focal plane while the spectrum of the emitted fluorescence is recorded with an energy-dispersive detector. The latter consists of a collimated silicon drift diode detector (SII Nanotechnology 50 mm2 Vortex) placed in the horizontal plane at 90° from the incident beam and 45° to the sample surface normal. A dwell time of 1 or 0.5 s was chosen per point, and 5 pixels/μm was chosen as a compromise between a good spatial resolution (200 nm) and reasonable acquisition times to preserve the sample from radiation damage. Spectra for each pixel were recorded in list mode so that data treatment could be performed off-line. The recorded spectra are fitted to obtain maps of the element content using PyMCA software (44). PyMCA allows element imaging reconstruction from recorded original spectra and also permits one to obtain the spectrum corresponding to a selected zone of the original image. By selecting zones corresponding to the Golgi apparatus, nucleus, and cytoplasm of cells the corresponding spectra can be obtained and the proportion of Mn in each compartment calculated.
Micro-PIXE/BS Analyses of Trace Elements
Micro-PIXE and micro-BS analyses were performed simultaneously using the AIFIRA facility (Applications Interdisciplinaires des Faisceaux d’Ions en Region Aquitaine) to enable quantitative chemical analysis of trace elements in cells (41). The energy of the incident proton beam produced by the Cockcroft−Walton accelerator was 3.0 MeV. The beam was focused onto the sample surface to a spot of 5 μm in diameter, resulting in a proton beam current of 250 pA as measured with a Faraday cup below the sample. X-ray fluorescence measurements were made with a Si(Li) energy-dispersive detector placed at 45° from the incident beam direction. The BS measurements were performed using a PIPS detector (passivated implanted planar silicon) placed at 135°.
The analyzed samples were the same as those used for nanoimaging of single cells with SXRF. For quantification, groups of several cells were analyzed; in general the scan dimensions was 100 μm × 100 μm. X-ray fluorescence data were treated with Gupixwin software (45, http://pixe.physics.uoguelph.ca/gupix/main/), to quantify the trace element content. BS data were analyzed with SIMNRA code (46) and were used for mass normalization of X-ray emission leading to quantitative results expressed in terms of microgram of element per gram of sample (μg/g). The detailed procedure for quantitative determination of trace element in PC12 cells using micro-PIXE/BS and its validation using appropriate reference material were recently published (41). The BS method allows measurement of the dry mass of a single cell, expressed as areal mass (μg/cm2), which in turn enables calculation of the mass of a single cell, knowing its surface.
Acknowledgments
The authors are grateful to the ESRF for technical support and to the staff of AIFIRA.
Dr. Carmona and Dr. Ortega designed research; Dr. Carmona, Mr. Devès, Dr. Roudeau, Dr. Cloetens, Dr. Bohic, and Dr. Ortega performed research; Dr. Cloetens and Dr. Bohic contributed new reagents and analytic tools; Dr. Carmona analyzed data; Dr. Carmona and Dr. Ortega wrote the paper.
Financial support received from the European Synchrotron Radiation Facility.
References
- Couper J. (1837) Sur les effets du peroxide de manganèse. J. Chim. Méd., Pharm. Toxicol. 3, 233–235. [Google Scholar]
- Flynn M.-R.; Susi P. (2009) Neurological risks associated with manganese exposure from welding operations - A literature review. Int. J. Hyg. Environ. Health 212, 459–469. [DOI] [PubMed] [Google Scholar]
- Dickerson R.-N. (2001) Manganese intoxication and parenteral nutrition. Nutrition 17, 689–693. [DOI] [PubMed] [Google Scholar]
- Stepens A.; Logina I.; Liguts V.; Aldins P.; Eksteina I.; Platka̅jis A.; Ma̅rtinsone I.; Te̅rauds E.; Rozenta̅le B.; Donaghy M. (2008) A Parkinsonian syndrome in methcathinone users and the role of manganese. N. Engl. J. Med. 358, 1009–1017. [DOI] [PubMed] [Google Scholar]
- Gorell J.-M.; Johnson C.-C.; Rybicki B.-A.; Peterson E.-L.; Kortsha G.-X.; Brown G.-G.; Richardson R.-J. (1999) Occupational exposure to manganese, copper, lead, iron, mercury and zinc and the risk of Parkinson's disease. Neurotoxicology 20, 239–247. [PubMed] [Google Scholar]
- Lucchini R.-G.; Albini E.; Benedetti L.; Borghesi S.; Coccaglio R.; Malara E.-C.; Parrinello G.; Garattini S.; Resola S.; Alessio L. (2007) High prevalence of Parkinsonian disorders associated to manganese exposure in the vicinities of ferroalloy industries. Am. J. Ind. Med. 50, 788–800. [DOI] [PubMed] [Google Scholar]
- Powers K.-M.; Smith-Weller T.; Franklin G.-M.; Longstreth W.-T. Jr.; Swanson P.-D.; Checkoway H. (2003) Parkinson's disease risks associated with dietary iron, manganese, and other nutrient intakes. Neurology 60, 1761–1766. [DOI] [PubMed] [Google Scholar]
- Aschner M.; Guilarte T.-R.; Schneider J.-S.; Zheng W. (2007) Manganese: Recent advances in understanding its transport and neurotoxicity. Toxicol. Appl. Pharmacol. 221, 131–147. [DOI] [PMC free article] [PubMed] [Google Scholar]
- Vescovi A.; Facheris L.; Zaffaroni A.; Malanca G.; Parati E.-A. (1991) Dopamine metabolism alterations in a manganese-treated pheochromocytoma cell line (PC12). Toxicology 67, 129–142. [DOI] [PubMed] [Google Scholar]
- Gunter T.-E.; Gavin C.-E.; Gunter K.-K. (2009) The case for manganese interaction with mitochondria. Neurotoxicology 30, 727–729. [DOI] [PMC free article] [PubMed] [Google Scholar]
- Gavin C.-E.; Gunter K.-K.; Gunter T.-E. (1999) Manganese and calcium transport in mitochondria: Implications for manganese toxicity. Neurotoxicology 20, 445–53. [PubMed] [Google Scholar]
- Morello M.; Canini A.; Mattioli P.; Sorge R.-P.; Alimonti A.; Bocca B.; Forte G.; Martorana A.; Bernardi G.; Sancesario G. (2008) Sub-cellular localization of manganese in the basal ganglia of normal and manganese-treated rats. An electron spectroscopy imaging and electron energy-loss spectroscopy study. Neurotoxicology 29, 60–72. [DOI] [PubMed] [Google Scholar]
- Kalia K.; Jiang W.; Zheng W. (2008) Manganese accumulates primarily in nuclei of cultured brain cells. Neurotoxicology 29, 466–470. [DOI] [PMC free article] [PubMed] [Google Scholar]
- Roth J.-A.; Garrick M.-D. (2003) Iron interactions and other biological reactions mediating the physiological and toxic actions of manganese. Biochem. Pharmacol. 66, 1–13. [DOI] [PubMed] [Google Scholar]
- Zheng W.; Zhao Q. (2001) Iron overload following manganese exposure in cultured neuronal, but not neuroglial cells. Brain Res. 897, 175–179. [DOI] [PMC free article] [PubMed] [Google Scholar]
- Kwik-Uribe C.; Smith D.-R. (2006) Temporal responses in the disruption of iron regulation by manganese. J Neurosci. Res. 83, 1601–1610. [DOI] [PubMed] [Google Scholar]
- Ortega R.; Devès G.; Carmona A. (2009) Bio-metals imaging and speciation in cells using proton and synchrotron radiation X-ray micro-spectroscopy. J. R. Soc. Interface 6, S649–S658. [DOI] [PMC free article] [PubMed] [Google Scholar]
- Roth J.-A.; Feng L.; Walowitz J.; Browne R.-W. (2000) Manganese-induce rat pheochromocytoma (PC12) cell death is independent of caspase activation. J. Neurosci. Res. 61, 162–171. [DOI] [PubMed] [Google Scholar]
- Deng Y.; Luan Y.; Qing H.; Xie H.; Lu J.; Zhou J. (2008) The formation of catechol isoquinolines in PC12 cells exposed to manganese. Neurosci. Lett. 444, 122–126. [DOI] [PubMed] [Google Scholar]
- Pezzati R.; Bossi M.; Podini P.; Meldolesi J.; Grohovaz F. (1997) High-resolution calcium mapping of the endoplasmic reticulum-Golgi-exocytic membrane system. Electron energy loss imaging analysis of quick frozen-freeze dried PC12 cells. Mol. Biol. Cell 8, 1501–1512. [DOI] [PMC free article] [PubMed] [Google Scholar]
- Fukuda M.; Mikoshiba K. (1999) A novel alternatively spliced variant of synaptotagmin VI lacking a transmembrane domain. J. Biol. Chem. 274, 31428–31434. [DOI] [PubMed] [Google Scholar]
- Masuda S.; Murakami M.; Takanezawa Y.; Aoki J.; Arai H.; Ishikawa Y.; Ishii T.; Arioka M.; Kudo I. (2005) Neuronal expression and neuritogenic action of group X secreted phospholipase A2. J. Biol. Chem. 280, 23203–22214. [DOI] [PubMed] [Google Scholar]
- Pelham H.,R.,B. (1991) Multiple targets for brefeldin A. Cell 67, 449–451. [DOI] [PubMed] [Google Scholar]
- Gavin C.-E.; Gunter K.-K.; Gunter T.-E. (1990) Manganese and calcium efflux kinetics in brain mitochondria. Relevance to manganese toxicity. Biochem. J. 266, 329–34. [DOI] [PMC free article] [PubMed] [Google Scholar]
- Burton N.-C.; Guilarte T.-R. (2009) Manganese neurotoxicity: Lessons learned from longitudinal studies in nonhuman primates. Environ. Health Perspect. 117, 325–332. [DOI] [PMC free article] [PubMed] [Google Scholar]
- Ortega R.; Moretto P.; Fajac A.; Benard J.; Llabador Y.; Simonoff M. (1996) Quantitative mapping of platinum and essential trace metal in cisplatin resistant and sensitive human ovarian adenocarcinoma cells. Cell. Mol. Biol. 42, 77–88. [PubMed] [Google Scholar]
- Culotta V.-C.; Yang M.; Hall M.-D. (2005) Manganese transport and trafficking: lessons learned from Saccharomyces cerevisiae. Eukaryotic Cell 4, 1159–1165. [DOI] [PMC free article] [PubMed] [Google Scholar]
- Peiter E.; Montanini B.; Gobert A.; Pedas P.; Husted S.; Maathuis F.J-.; Blaudez D.; Chalot M.; Sanders D. (2007) A secretory pathway-localized cation diffusion facilitator confers plant manganese tolerance. Proc. Natl. Acad. Sci. U.S.A. 104, 8532–8537. [DOI] [PMC free article] [PubMed] [Google Scholar]
- Larsen A.-K.; Escargueil A.-E.; Skladanowski A. (2000) Resistance mechanisms associated with altered intracellular distribution of anticancer agents. Pharmacol. Ther. 85, 217–229. [DOI] [PubMed] [Google Scholar]
- Chun H.-S.; Lee H.; Son J.-H. (2001) Manganese induces endoplasmic reticulum (ER) stress and activates multiple caspases in nigral dopaminergic neuronal cells, SN4741. Neurosci. Lett. 316, 5–8. [DOI] [PubMed] [Google Scholar]
- Tjalkens R.-B.; Zoran M.-J.; Mohl B.; Barhoumi R. (2006) Manganese suppresses ATP-dependent intercellular calcium waves in astrocyte networks through alteration of mitochondrial and endoplasmic reticulum calcium dynamics. Brain Res. 113, 210–219. [DOI] [PubMed] [Google Scholar]
- Towler M.-C.; Prescott A.-R.; James J.; Lucocq J.-M.; Ponnambalam S. (2000) The manganese cation disrupts membrane dynamics along the secretory pathway. Exp. Cell Res. 259, 167–179. [DOI] [PubMed] [Google Scholar]
- Higashi Y.; Asanuma M.; Miyazaki I.; Hattori N.; Mizuno Y.; Ogawa N. (2004) Parkin attenuates manganese-induced dopaminergic cell death. J. Neurochem. 89, 1490–1497. [DOI] [PubMed] [Google Scholar]
- Gitler A.-D.; Chesi A.; Geddie M.-L.; Strathearn K.-E.; Hamamichi S.; Hill K.-J.; Caldwell K.-A.; Caldwell G.-A.; Cooper A.-A.; Rochet J.-C.; Lindquist S. (2009) Alpha-synuclein is part of a diverse and highly conserved interaction network that includes PARK9 and manganese toxicity. Nat. Genet. 41, 308–315. [DOI] [PMC free article] [PubMed] [Google Scholar]
- Fan J.; Hu Z.; Zeng L.; Lu W.; Tang X.; Zhang J.; Li T. (2008) Golgi apparatus and neurodegenerative diseases. Int. J. Dev. Neurosci. 26, 523–34. [DOI] [PubMed] [Google Scholar]
- Kwik-Uribe C.-L.; Reaney S.; Zhu Z.; Smith D. (2003) Alterations in cellular IRP-dependent iron regulation by in vitro manganese exposure in undifferentiated PC12 cells. Brain Res. 973, 1–15. [DOI] [PubMed] [Google Scholar]
- Roth J.-A.; Horbinski C.; Feng L.; Dolan K.-G.; Higgins D.; Garrick M.-D. (2000) Differential localization of divalent metal transporter 1 with and without iron response element in rat PC12 and sympathetic neuronal cells. J. Neurosci. 20, 7595–7601. [DOI] [PMC free article] [PubMed] [Google Scholar]
- Zheng W.; Zhao Q.; Slavkovich V.; Aschner M.; Graziano J.-H. (1999) Alteration of iron homeostasis following chronic exposure to manganese in rats. Brain Res. 833, 125–132. [DOI] [PMC free article] [PubMed] [Google Scholar]
- Garcia S.-J.; Gellein K.; Syversen T.; Aschner M. (2006) A manganese-enhanced diet alters brain metals and transporters in the developing rat. Toxicol. Sci. 92, 516–25. [DOI] [PubMed] [Google Scholar]
- Greene L.-A.; Tischler A.-S. (1976) Establishment of a noradrenergic clonal line of rat adrenal pheochromocytoma cells which respond to nerve growth factor. Proc. Natl. Acad. Sci. U.S.A. 73, 2424–2428. [DOI] [PMC free article] [PubMed] [Google Scholar]
- Carmona A.; Devès G.; Ortega R. (2008) Quantitative micro-analysis of metal ions in subcellular compartments of cultured dopaminergic cells by combination of three ion beam techniques. Anal. Bioanal. Chem. 390, 1585–1594. [DOI] [PubMed] [Google Scholar]
- Greaves J.; Salaun Ch.; Fukata Y.; Fukata M.; Chamberlain L.-H. (2008) Palmitoylation and membrane interactions of the neuroprotective chaperone cysteine-string protein. J. Biol. Chem. 283, 25014–25026. [DOI] [PMC free article] [PubMed] [Google Scholar]
- Hignette O.; Cloetens P.; Rostaing G.; Bernard P.; Morawe C. (2005) Efficient sub 100 nm focusing of hard x rays. Rev. Sci. Instrum. 76, 063709. [Google Scholar]
- Solé V.-A.; Papillon E.; Cotte M.; Walter Ph.; Susini J. (2007) A multiplatform code for the analysis of energy-dispersive X-ray fluorescence spectra. Spectrochim. Acta B 62, 63–68. [Google Scholar]
- Campbell J.-L.; Hopman T.-L.; Maxwell J.-A.; Nejedly Z. (2000) The guelph PIXE software package III: Alternative proton database. Nucl. Instrum. Methods B 170, 193–204. [Google Scholar]
- Mayer M. (1997) SIMNRA User’s Guide; Max-Planck-Institut für Plasmaphysik: Garching, Germany. [Google Scholar]