Abstract
Sealing of a microfluidic cartridge is a challenge, because the cartridge commonly contains heat-sensitive biomolecules that must also be protected from contamination. In addition, the objective is usually to obtain a sealing method suitable for mass production. Laser welding is a rapid technique that can be accomplished with low unit costs. Even though the technique has been widely adopted in industry, the literature on its use in microfluidic applications is not large. This paper is the first to report the effects of laser welding on the performance of the heterogeneous immunoassay in a polystyrene microfluidic cartridge in which biomolecules are immobilized into the reaction surface of the cartridge before sealing. The paper compares the immunoassay performance of microfluidic cartridges that are sealed either with an adhesive tape or by use of laser transmission welding. The model analyte used is thyroid stimulating hormone (TSH). The results show that the concentration curves in the laser-welded cartridges are very close to the curves in the taped cartridges. This indicates, first, that laser welding does not cause any significant reduction in immunoassay performance, and second, that the polystyrene cover does not have significant effect on the signal levels. Interestingly, the coefficients of variance between parallel samples were lower in the laser-welded cartridges than in the taped cartridges.
INTRODUCTION
The immunoassay is one of the most popular methods used in in vitro diagnostics, thanks to its excellent sensitivity and specificity. It is a technique that is based on a specific interaction between an antibody and an antigen in order to separate analytes of interest from sample matrices. Immunoassay technology is utilized in the quantification of proteins and small molecules, for example, in medical diagnostics, proteomics, pharmaceutical research, and biological research. Immunoassays are classified into two formats: heterogeneous and homogeneous.1, 2, 3 In heterogeneous immunoassays, the antibodies are immobilized on a solid support and the target molecules (antigens) are in solution. The target molecules can be detected with the help of labeled secondary antibodies that bind to antigens in a different epitope as immobilized primary antibodies. Unbound labeled antibodies are easily removed in washing steps to prevent nonspecific binding.2, 3, 4 In homogeneous immunoassays, the antibodies interact with the antigens in solution and need no separation phase of unbound antibodies.2, 3
Conventionally, heterogeneous immunoassays are performed in microtiter plates in laboratory conditions. This is labor-intensive and requires several procedural steps.2 In addition, such diagnostic tests are hindered in resource-limited settings, as in developing countries.3 These problems related to conventional immunoassays can be circumvented by miniaturization in microfluidic systems. General trends of in vitro diagnostics include a decrease in sample and reagent volumes and increasing functionality by integrating the protocol steps into a single cartridge. The goal is to shorten the analysis times and decrease the involvement of the user, which could lead to reduced total costs.5 Microfluidic systems are believed to hold great promise for fulfilling these goals and trends.
An interesting but still relatively unexplored topic in the microfluidic literature is the development of the immunoassay method to integrate dry-chemistry storage into a mass-produced cartridge. Dry reagents stored in a cartridge enable a convenient ready-to-use setting, long-term storage, and lower consumption of reagents for sandwich immunoassays. However, dry reagents must be immobilized and placed into the cartridge during production (before sealing of the device). This poses challenges, since the methods used should not destroy the stored dry reagents. An additional demand for a production method is low production cost; therefore, a sealing technique that allows mass production is preferred.4
The main challenge in the sealing of microfluidic devices is to achieve a pressure-tight seal between the channel substrate and the cover without clogging the channels, changing their physical parameters or altering their dimensions. Furthermore, bonding should not include unstable reagents (such as outgassing glue or solvents), and it should not damage or contaminate biomolecules used in the bioanalytical microdevices.6, 7, 8
Polymer devices have been sealed using gluing,7 lamination,6, 9 ultrasonic welding,6, 10 resistive welding,11 and laser transmission welding.6, 11, 12 Laser transmission welding offers several advantages in microfluidic applications compared with conventional joining techniques. First, it is a contactless processing technique that does not cause any contamination of the functional areas of the device. The process is also fast process, taking only a few seconds to produce a complete microfluidic device. The method has several other advantages such as high accuracy, good visual properties of the seam, minimal mechanical, and electrical effects on the product, and the possibility of welding hermetic 3D seams. Even though the temperature rises during sealing, laser welding induces a reduced amount of stress into the joining materials compared to conventional methods, such as gluing, lamination, ultrasonic welding, and resistive welding, since the energy generation is highly localized in laser welding.11, 12, 13
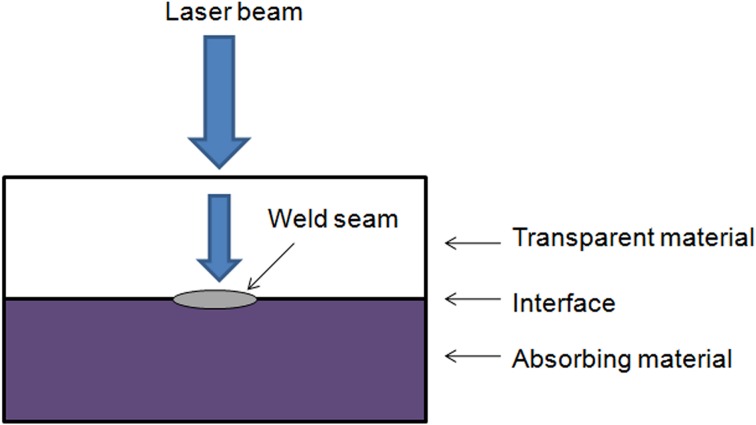
Laser transmission welding of thermoplastic polymeric materials is a widely used method in industry. Various fields, such as the automotive, mechanical, and electronics industries, have utilized the method for welding plastic macro parts. More recently, laser transmission welding has also been used in smaller dimensions, such as the sealing of microfluidic chips.13 The prerequisite for laser transmission welding (Fig. 1) is that one of the joining polymers must be optically transparent for the wavelength of the laser radiation, while the other joining polymer is absorbent. Before welding, the two joining parts are pressed together with a defined force to compensate for the expulsion forces produced at the joining interface during the welding process. The laser beam passes through the transparent polymer and is absorbed by the other polymer, at which time the optical energy is transformed into heat. Heat conduction induces the heating of the transparent polymer, resulting in softening of both of the layers at the interface, and finally to a mixture of the two molten materials. This enables the formation of an accurate local bond.11
Figure 1.
The principle of laser transmission welding.
Several different laser transmission welding techniques have been demonstrated for joining plastics, including contour welding, simultaneous welding, quasi-simultaneous welding, and mask welding. Contour welding is a common plastic welding technique, in which a focused laser beam moves over the surface of the material along a programmed welding path. Either the plastic parts or the laser beam is moved, and the other is kept stationary. For example, a robot can be used for moving the parts, and a laser scanner can move the laser beam. The contour welding technique has many advantages, including simplicity, flexibility, easy controllability, and cost efficiency. Different welding paths can be run by simply changing the program of the robot or the scanner. In spite of its several advantages, the method is considered to have a welding speed too low for many mass production applications. A common processing speed of an industrial robot is lower than 17 mm/s; using a robot at too high, a speed leads to diminished accuracy or insufficient melting of the material.13, 14, 15 However, in microscale applications, 17 mm/s can be considered a sufficiently high processing speed even for mass production applications.
Malek8 has reviewed the laser processing methods used in biomicrofluidics applications. Different laser transmission welding methods have been successfully demonstrated for microfluidic components in several studies. For example, Boglea et al.11 have welded microfluidic chips with a method combining the characteristics of polymer contour welding and quasi-simultaneous welding. The authors have named the method transmission welding by an incremental scanning technique (TWIST). By using the TWIST method, these authors have achieved high quality welding seams as narrow as 100 μm at welding speeds of up to 300 mm/s. Ussing et al.16 have achieved narrow welding seams on microfluidic components made of transparent polymer using low-power laser diodes. They welded firm 10 μm wide seams next to 100 μm wide and 50 μm deep channels at a welding speed of 15 mm/s using a contour welding method. Chen and Zybco17 have used the mask welding technique to join microfluidic devices. They achieved 5 ∼ 10 μm accuracy in the welding seams, and welding of an area of 10 × 10 mm2 was performed in 12 s (actual welding time only 220 ms).
Chemical and biochemical agents utilized in microfluidic immunoassay devices are sensitive to heat, as earlier discussed. Therefore, a minimum heat effect is necessary to achieve a functional immunoassay chip. Earlier studies have shown that the temperature should not exceed 45–70 °C for more than 2 min to keep the biomolecules functional.11 Earlier studies such as Refs. 8, 11, 16, 17 have used laser transmission welding to seal microfluidic devices. However, the question on the influence of the elevated temperature on the biomolecules has not been addressed before. The main contribution of the present paper is to report the influences of contour type laser welding on the performance of heterogeneous immunoassays in a polystyrene microfluidic cartridge. In addition, the channel temperature in the cartridge during laser welding is studied for the first time. The immunoassay performance is compared between cartridges sealed with an adhesive tape or by use of laser welding. The model analyte used in the study is thyroid stimulating hormone (TSH).
MATERIALS AND METHODS
This section first describes the fabrication, coating and sealing of the cartridge, and then introduces the TSH assay and the detection method. Finally, the methods are presented for studying the temperature in the microfluidic channel during welding.
Microfluidic cartridge fabrication
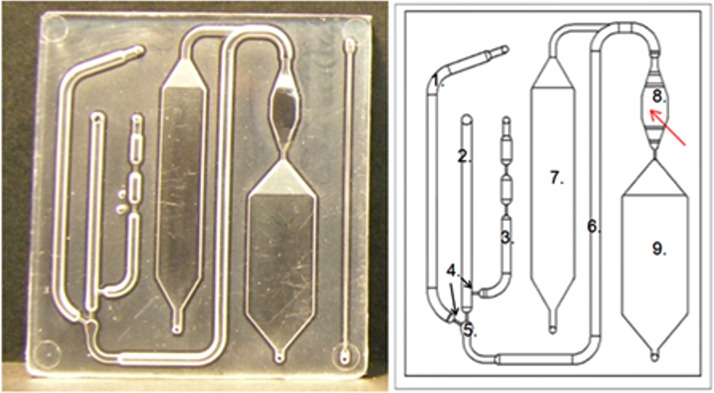
Microfluidic cartridges (Fig. 2) used in the experiments were fabricated of high impact polystyrene (PS-HI, Styrolux® 656 C, BASF) using injection molding made by Plastone, Ltd. (Plastone Oy, Nurmijärvi, Finland). The cartridges are produced as individual pieces in high throughput without need for dicing during the production process. The geometry of the cartridge mold was fabricated by milling. The site of the reaction surface in the mold was manually polished. The cartridge has external dimensions of 55 mm × 45 mm × 2 mm and it consists of the following main parts as illustrated in Fig. 2: a buffer channel (1), a sample channel (2), a pressure channel (3), a mixing channel (6), passive valves (4), a mixer (5), a reaction chamber (8), a washing chamber (7), and a waste chamber (9). The channel is a half circle in its cross-sectional shape with a diameter of 1.5 mm. The volume of the reaction chamber, in which the biochemical immunoreactions and the fluorescence detection take place, is 40 μL.
Figure 2.
Microfluidic cartridge. A photograph (left) of an injection molded polystyrene plate, which is sealed with a black polystyrene plate using laser welding. A schematic of the cartridge structure (right), with red arrow pointing to the reaction chamber. (1) Buffer channel, (2) sample channel, (3) pressure channel, (4) passive valves (arrows), (5) mixer, (6) mixing channel, (7) washing chamber, (8) reaction chamber, and (9) waste chamber.
Coating of the reaction chamber of the microfluidic cartridge
Injection molded cartridges were first washed with isopropanol and deionized water. A total of 20 cartridges were used. The reaction chamber surface of the cartridges was coated with chemically modified streptavidin18 from the Department of Biotechnology at the University of Turku in Finland. The coating was performed such that 1000 ng/40 μL streptavidin was manually dispensed on the reaction chamber, and the cartridges were incubated overnight at +36 °C. The empty sites of the streptavidin surface were blocked with bovine serum albumin (BSA)-containing solution, and the surface was coated with biotinylated antibody (Bio-MAb Anti-TSH 5405). Biotinylated antibody was mixed in buffer solution (Kaivogen buffer, Kaivogen Oy, Turku, Finland) such that the concentration was 200 ng/40 μL. Subsequently, 40 μL of this solution was dispensed on the reaction chamber, and the cartridges were incubated for 2 h at room temperature (RT). The reaction chambers were then washed with 1 ml washing buffer prepared from 25 × wash concentrate (Kaivogen Oy, Turku, Finland) by diluting it to deionized water (1:25), in a continuous flow with a water suction pump. The cartridges were dried at RT and stored at +4 °C before the sealing process.
Sealing of the cartridge
Individual cartridges were sealed either with an adhesive tape (ARSeal 90406 HydFob), or using laser transmission welding to bond a black extruded polystyrene plate (Vikureen, Athlone Extrusions, Ltd., Athlone, Ireland) on top of the injection molded channel plate. Ten cartridges, sealed with both techniques, were used to characterize the immunoassay performance. The adhesive tape was manually placed on top of the injection molded polystyrene channel plate.
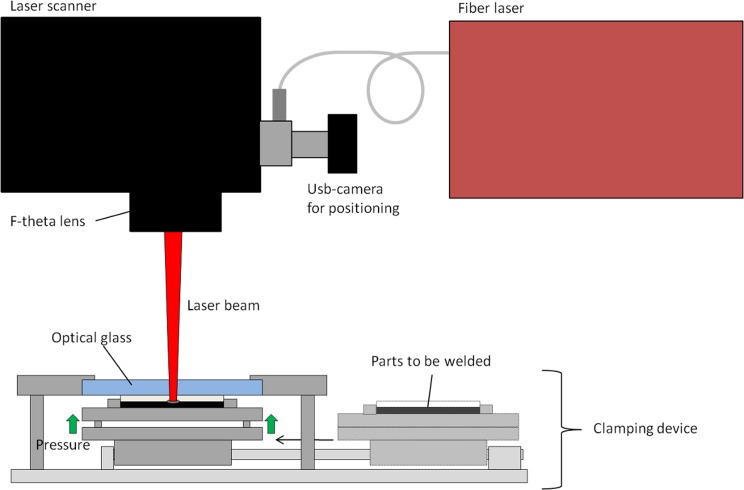
In laser transmission welding, the laser beam travels through the optically transparent plastic layer (injection molded cartridge) and absorbs to the optically opaque layer (black cover). The heat is then conducted to the transparent layer and, as the molten material cools down, a durable joint is formed. The cartridges were welded with a fiber laser (SPI 20 W, wavelength 1090 nm) connected to a laser scanner (GSI HB X-10) equipped with an f-theta lens with a focus of 420 mm. The joining force was generated using a pneumatic clamping device located under the laser scanner. Fig. 3 shows a schematic drawing of the laser welding setup 3.
Figure 3.
A schematic drawing of the laser welding setup.
The intensity profile of the laser beam is Gaussian; therefore, the power density is highest at the middle of the spot and the material can easily be heated excessively in the middle of the welding seam. In order to decrease the power density of the laser spot, the spot size was increased using defocusing: the cartridges were welded using an offset of 19 mm from the laser beam focus. The lower the power density, the easier it is to control the welding process without burning the material. When using a 19 mm defocus, the diameter of the beam—given at a value where the beam intensity drops to 1/e2 ( = 13.5%) of the peak intensity—is 254 μm. The beam propagation factor M2 is 1.07. However, the spot size is not the only variable affecting the width of the weld seam; the amount of laser power that is used and especially the welding speed also have an effect.17
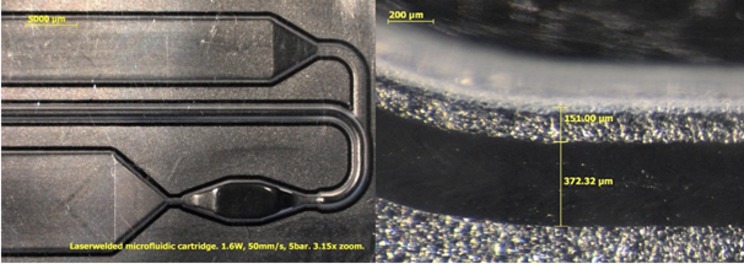
The cartridges were welded using a contour welding technique in which the laser beam is moved once through the welding path. In this experiment, the welding path traveled around the channels. The distance between the welding seam and the channel wall was 150 μm (± 30 μm). The laser power used for welding was 1.6 W, the welding speed was 50 mm/s, and the joining pressure was 5 bar. The width of the welding seam was 370 μm. Fig. 4 presents stereo microscope images from the top direction of the welding seam using 3.15× and 64× zoom. The welding seam can be seen in the images as a black line.
Figure 4.
Stereo microscope images from top direction of the welding seam using 3.15× and 64× zoom.
The cartridges were positioned before welding using a usb-camera (UI-1545LE-M, IDS Imaging Development Systems GmbH, Obersulm, Germany) located in the optical axis of the scanner. By moving the scanner mirrors, two predefined points were shown for the self-made positioning software that calculates the right position of the weld contour. This positioning process takes approximately 30 s. After the experiment, an automatic machine vision-based positioning system (self-made with NI Labview software) was been introduced, which located the cartridge, calculated the position of the weld contour and started the welding process in less than 2 s. Welding of the cartridge with this design at 50 mm/s speed takes 14.2 s. Positioning and welding of one cartridge thus takes approximately 45 s with the semi-automatic positioning system and approximately 16 s with the automated machine vision-based positioning system. Introduction of the next cartridge into the system takes approximately 14 s, which has to be taken into account when estimating the welding times for larger series.
TSH model immunoassay
The TSH-calibrator series was diluted in TSA-BSA buffer (50 mM Tris-HCl, pH 7.75, 154 mM NaCl, 0.05% NaN3, and 7.5% BSA). One blank sample and three parallel samples of three different TSH concentrations (3 × 15 mU/L, 3 × 30 mU/L, and 3 × 60 mU/L) were used for the assay runs. Sample, assay buffer (Kaivogen buffer, Kaivogen Oy, Turku, Finland), and antibody-coated nanoparticles (europium(III)-chelate dyed 107 nm nanoparticles from Seradyn (Indianapolis, USA), coated with anti-hTSH Mab-5409 in the Department of Biotechnology at the University of Turku, Finland) were mixed outside the cartridge and infused with a syringe pump (New Era Pump Systems, Inc., USA) from the washing chamber into the reaction chamber where the immunoreaction took place. The reaction time was 15 min, as cartridges were incubated for 15 min at +36 °C. Subsequently, the reaction chamber was washed with 1 ml washing buffer and scanned with a Victor2 multilabel counter (Wallac 1420-018 multilabel counter, PerkinElmer Life Sciences, Wallac Oy, Turku, Finland) to obtain the fluorescence signal of the europium-dyed nanoparticle labels equal to the amount of bound antigen.
Detection method and result analysis
The cartridge was placed on a cartridge holder, which positions the cartridge correctly in the Victor2 plate reader. Subsequently, the reaction chamber was scanned in 10 × 10 spots to obtain the fluorescence signal of the europium-dyed nanoparticle labels equal to the amount of bound antigen. The cartridge holder was developed such that the reaction chamber aligned with a single scanning area of the reader. Scanning spots (2 × 4) in the middle of the scanning area were selected for result analysis, since the 10 × 10 scanning spot matrix also covered spots outside the reaction chamber.
An average of all 2 × 4 scanning spots inside one cartridge represented the fluorescence signal of the cartridge. An average of fluorescence signals, standard deviation, and coefficient of variance (CV) of three parallel cartridges were calculated for each concentration. However, only one cartridge was used for the 0 mU/L sample. The average fluorescence signal (counts per second) as a function of TSH concentration was plotted for both studies (taped and laser-welded cartridges). A background corrected value of the signal in which the value of the zero sample was subtracted was used in the immunoassay curves.
In addition, signal-to-background ratios were calculated for all TSH concentrations used in the immunoassays. The average photon count of each TSH concentration was divided by the average photon count of the zero sample, in which the TSH concentration was 0 mU/L.
Channel temperature during laser welding
Temperatures inside the microfluidic channel during the laser welding process were measured using a thermal infrared (IR) camera. For the measurements, the cartridges were cut in half in the middle of the channel using a knife (Fig. 5).
Figure 5.
(a) For the temperature measurements, the cartridges were cut in half. The dashed red line represents the cutting line. (b) A schematic drawing of the test arrangement in the channel temperature measurements.
After cutting, the half-cartridge was pressed together with a cover plate using a pneumatic press located under the laser scanner. Subsequently, the cartridges were welded along the cut channel at different welding distances and the temperatures were recorded with the thermal camera (FLIR A325, FLIR Systems, Inc. Wilsonville, USA) from a side using a 30 Hz frame rate. The camera has 50 μm close-up lens, 12 × 14 mm field of view, 33 mm working distance, and an accuracy of ±2 °C or ±2% of the reading. Fig. 5 illustrates a schematic drawing of the test arrangement.
The contour welding technique was used, with 50 mm/s speed and 1.6 W laser power. The samples were welded using six different distances between the weld seam and the channel wall. Distances of −50, 0, 100, 200, 300, and 500 μm were used. The negative distance (−50 μm) means that the welding seam is partially in the channel.
RESULTS AND DISCUSSIOn
This section presents the results of immunoassays performed with the cartridges sealed with an adhesive tape and by use of laser transmission welding. Fluorescence signals obtained from the assays are compared between these two sealing techniques. The background signals for europium fluorescence are also presented and compared.
Effects of laser welding on the performance of heterogeneous immunoassays
The immunoassay curves for the taped and laser-welded cartridges are compared to identify possible differences in the curve shapes or signal levels, which would indicate changes in the function of the biomolecules.
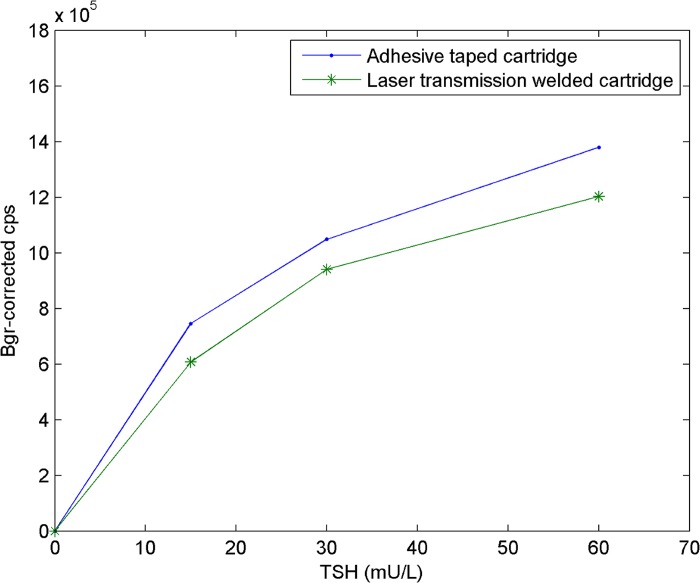
As Fig. 6 illustrates, the immunoassay curves are similar for the taped and laser-welded cartridges. The shapes of the curves are the same, but the signal levels are slightly higher in the cartridges sealed with the adhesive tape compared with the cartridges sealed using laser transmission welding. However, the difference in the signals was not significant, indicating that neither laser welding nor the black polystyrene cover cause any significant reduction in the immunoassay performance.
Figure 6.
TSH-immunoassay in cartridges sealed either with an adhesive tape or using laser welding (2 × 4 scanning points), TSH concentration versus background-corrected—counts per second (cps).
Table TABLE I. provides the signal levels and the variations between parallel samples. In the taped cartridges, the CV ranges from 10% to 20%, while in the laser-welded cartridge, the CV varies approximately from 4% to 12%. Therefore, interestingly, the CVs are lower in the laser-welded cartridges than in the taped cartridges.
TABLE I.
Average fluorescence signals and coefficients of variance from model immunoassays for reaction chambers of the cartridges sealed either with an adhesive tape or by the use of laser welding.
| Adhesion tape | Laser welding | |||
|---|---|---|---|---|
| TSH-sample (mU/L) | Average signal | CV% | Average signal | CV% |
| 0 (n = 1) | 176 332 | — | 84 723 | — |
| 15 (n = 3) | 745 561 | 19.9% | 607 271 | 10.1% |
| 30 (n = 3) | 1 049 440 | 11.1% | 941 022 | 11.8% |
| 60 (n = 3) | 1 379 161 | 10.0% | 1 203 188 | 3.7% |
The background signal of the cartridges for europium fluorescence was measured using a zero sample, in which the TSH concentration was 0 mU/L. The signal-to-background ratio in the taped and laser-welded cartridges was calculated for all studied concentrations (Table TABLE II.). There were no parallel zero samples, but based on these results, the signal-to-background ratios are higher in the laser-welded cartridges, indicating lower background signals when laser-welded cartridges are used. The laser-welded cartridges have a black polystyrene back plate in the reaction chamber of the cartridge. The black color absorbs light more efficiently than the clear tape, which results in lower background signals. Another potential reason could be the lower material-based inherent fluorescence of the black polystyrene plate in comparison with the tape. In addition, the polystyrene plate may have a lower tendency for non-specific binding of the label particles (that is, unintended binding of label particles on the surfaces outside the desired target molecules). Non-specific binding always occurs to some extent in this type of assay and is indistinguishable from the correctly bound label when measuring fluorescence.
TABLE II.
Signal-to-background ratios for all TSH concentrations for the cartridges sealed with an adhesive tape and by use of laser welding.
| Signal-to-background ratio | ||
|---|---|---|
| TSH sample (mU/L) | Adhesion tape | Laser welding |
| 15 | 4.42 | 7.17 |
| 30 | 6.00 | 11.11 |
| 60 | 7.82 | 14.20 |
Channel temperature during laser welding
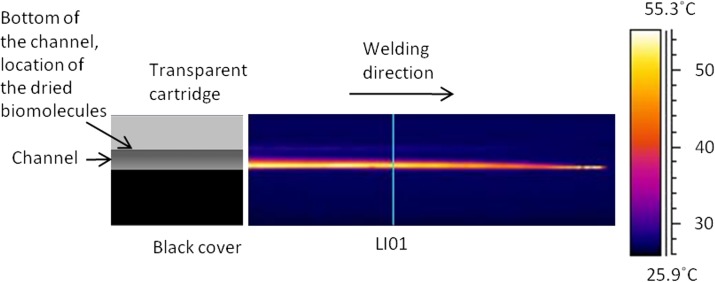
The thermal videos were analyzed using a special analyzing software (thermacam researcher, FLIR Systems, Inc. Wilsonville, USA). The software stored the temperatures in the measured area with 30 Hz frequency. The temperatures were analyzed on the line LI01 shown in Fig. 8.
Figure 8.
Thermal image captured 0.13 s after the beam has passed the line LI01 using a 100 μm welding distance between the seam and the channel wall.
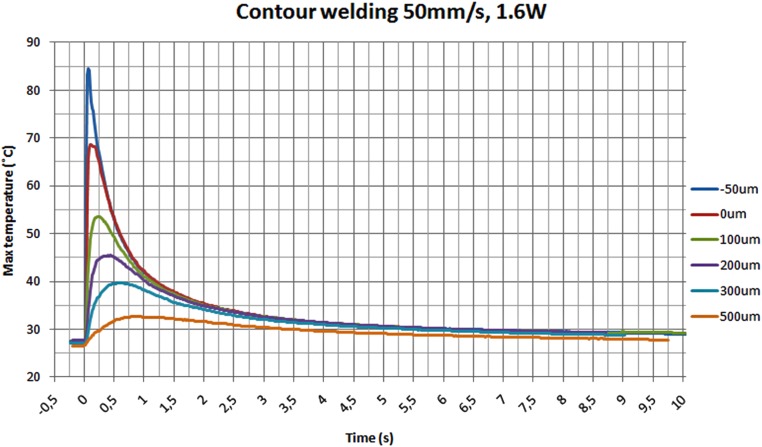
The maximum temperature on the line LI01 is shown in Fig. 7 for different welding distances. The temperature on the measuring line (LI01) rises to its maximum value in a short time but it also drops fast, as shown in Fig. 7. At 1.25 s after welding, the temperature is below 40 °C in all of the distances tested. Because the samples for immunoassay measurements were welded with a seam distance of 150 ± 30 μm, the temperatures should not be higher than in the distance of 100 μm. As seen in Fig. 7, the maximum temperature on the measuring line is 54 °C when the seam is at the distance of 100 μm from the channel.
Figure 7.
The maximum channel temperatures during contour welding with 50 mm/s speed and 1.6 W laser power.
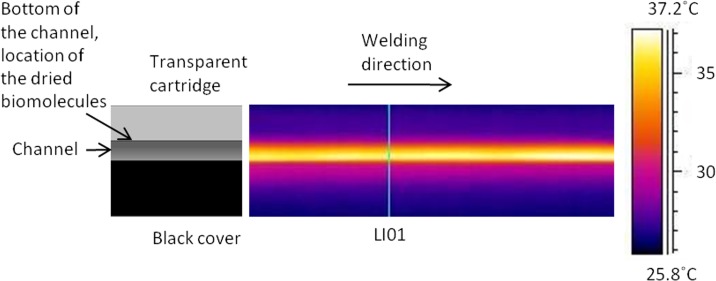
The thermal image illustrated in Fig. 8 is captured at 0.13 s after the beam passed the line LI01 using the seam distance of 100 μm. In this image, the temperature on the observed surface is at its highest value. In the image, the laser beam has moved from left to right and is now located at the right end of the image. As can be seen, the maximum temperature is at the interface of the surfaces. The biomolecules are dried on the bottom of the channel in the transparent cartridge, where the temperature has remained below 30 °C. After the beam has passed, the heat starts to spread to the materials. When analyzing the thermal video, it can be concluded that the temperature on the bottom of the channel does not rise above 36 °C during the welding process with the 100 μm seam distance. Fig. 9 illustrates a thermal image which is captured 2 s after the beam has passed the line LI01. In this image, the temperature at the bottom of the channel is close to its maximum value.
Figure 9.
Thermal image captured 3 s after the beam has passed the line LI01 using 100 μm welding distance between the seam and the channel wall. Temperature at the bottom of the channel is near to its maximum value.
DISCUSSION
The main uncertainties associated with the performance of the immunoassay include: (1) a variation in the volumes of the biochemical reagents due to manual dispensing, (2) a variation in the reaction kinetics, and (3) the effect of the surface read-out measurement mode. The reaction in the cartridge obeys the principle of a kinetic assay, which means that the reaction is not in equilibrium within the 15-min period used in this experiment, but the forward reaction is still faster than the off-rate. In this region, the change in the amount of bound antibody per time unit is large (a steep slope in the bound versus time graph); because of this, small deviations in the reaction time, acquired heat amount, etc. easily affect the amount of the bound label. This kinetic reaction mode is likely to cause some variation between parallel reactions. The surface-readout measurement is vulnerable to the local density of the label under the measuring beam or in the area of the selected data points. The data points selected in the middle of the chamber represent a partial sample of the total bound label and this sample is supposed to represent a constant fraction of the total bound label. As noted, scanning has revealed some local variations in the distribution of the bound label within the reaction chamber, which may cause some additional variations in the surface-readout measurement, even though the total amounts of the bound label are supposed to be equal between replicated reactions.
The volume of the reaction chamber used in this study is fairly large (40 μL) for microfluidic devices. The fairly large buffer and washing volumes used in the current assay protocol result in a relatively large footprint of the cartridge. When the volumes are to be reduced in the future, the footprint and the channel dimensions will also be reduced. Therefore, the effect of laser welding on the immunoassay performance as the devices are scaled to smaller dimensions is an important fact to be considered. In this study, the distance of the laser seam from the channel wall was 150 μm. When scaling down microfluidic structures, the seam should probably be closer to the channel. The positioning accuracy of the laser seam allows the laser welding to be placed closer to the channel, as the positioning error is approximately ±30 μm using microscope imaging. The error is due to a machine vision-based positioning inaccuracy (estimated in this study as ±15 μm) and due to a scanner-dependent positioning inaccuracy of the laser beam (estimation with the used working area and optics ±15 μm). When scaling down the channel dimensions, the seam size might need to be reduced from the current 370 μm. It is possible to reduce the seam size below 100 μm by reducing the spot size with optics having a smaller focal length. Reducing the spot size will also reduce the temperature in the channel, but it could also decrease the bond strength. More experimental investigation is needed on this issue.
In addition to the positioning accuracy and the seam size, an important aspect to take into account when scaling down the microfluidic cartridge dimensions is the temperature effect. Based on the temperature measurements performed in the microfluidic channel during laser welding, the temperature exposure on immobilized biomolecules is sufficiently low. Even if the welding seam distance is closer than 150 μm to the channel, the temperature is high only very close to the welding seam, which is at the interface of the transparent cartridge and the black cover. The immobilization site of the biomolecules is at the bottom of the channel, which is the farthest part of the channel from the welding seam. Moreover, the temperature drops close to 35 °C (the accuracy of thermal camera FLIR A325 ±2 °C or ±2% of reading) with all distances studied within 2 s after passing of the laser beam. Because the temperature should not exceed 45–70 °C for more than 2 min, it is safe to reduce the channel dimensions. However, the effects of laser welding on the immunoassay performance should be further experimentally studied in smaller channel dimensions.
CONCLUSIONS
This was the first time that the performance of immunoassays in laser-welded polymer cartridges has been analyzed. The results show that the immunoassay curves were similar for the taped and the laser-welded cartridges, which indicates that laser welding does not cause any significant reduction in immunoassay performance. In the laser-welded cartridges, the signal levels were close to those of the taped cartridges, indicating that the black polystyrene cover does not influence the signal levels. Interestingly, the coefficients of variance between parallel samples were lower in the laser-welded cartridges than in the taped cartridges.
ACKNOWLEDGMENTS
The authors wish to thank the Finnish Funding Agency for Technology and Innovation (Tekes), the Graduate School of Advanced Diagnostic Technologies and Applications (DIA-NET) coordinated by the University of Turku, and the participating companies for funding the project this study was part of. Special thanks go to Aarne Lemponen for preparing the coatings of the reaction chambers of the microfluidic cartridges, and Mathias von Essen for designing the used microfluidic cartridge and preparing the cartridge illustrations.
References
- Härmä H., Soukka T., and Lövgren T., Clin. Chem. 47, 561 (2001). [PubMed] [Google Scholar]
- Ng A. H. C., Uddaysankar U., and Wheeler A. R., Anal. Bioanal. Chem. 397, 991 (2010). 10.1007/s00216-010-3678-8 [DOI] [PubMed] [Google Scholar]
- Jiang H., Weng X., and Li D., Microfluid. Nanofluid. Published online 21 October (2010), available at http://www.springerlink.com/content/11211001l1753432/fulltext.pdf [cited 28/03/2011].
- Berthier J. and Silberzan P., Microfluidics for Biotechnology, MEMS Series (Artech House, Inc., Norwood, MA, 2006). [Google Scholar]
- Ducrée J. and Zengerle R., FlowMap – Microfluidics Roadmap for the Life Sciences (Books on Demand GmbHm, Norderstedt, Germany, 2004). [Google Scholar]
- Tsao C. W. and DeVoe D. L., Microfluid. Nanofluid. 6, 1 (2009). 10.1007/s10404-008-0361-x [DOI] [Google Scholar]
- Becker H. and Gartner C., Electrophoresis 21, 12 (2000). [DOI] [PubMed] [Google Scholar]
- Malek C. G. K., Anal. Bioanal. Chem. 385, 1362 (2006). 10.1007/s00216-006-0517-z [DOI] [PubMed] [Google Scholar]
- Huang F. C., Chen Y. F., and Lee G. B., Electrophoresis 28, 1130 (2007). 10.1002/elps.v28:7 [DOI] [PubMed] [Google Scholar]
- Truckenmuller R., Ahrens R., Cheng Y., Fisher G., and Saile V., Sens. Actuators, A 132, 385 (2006). 10.1016/j.sna.2006.04.040 [DOI] [Google Scholar]
- Boglea A., Olowinsky A., and Gillner A., Appl. Surf. Sci. 254, 1174 (2007). 10.1016/j.apsusc.2007.08.013 [DOI] [Google Scholar]
- Haberstroh E. and Hoffman W. M., “Laser transmission of microplastic parts,” in Second International Conference on Multi-Material Micro Manufacture (Elsevier, Oxford, UK, 2006), pp. 71–74.
- Kouvo S., Jansson A., Verho M., Minkkinen H., and Kujanpää V., “The assembly of mass-produced components (QUASI),” Project report 2002–2005, 79 pp., VTT and Lappeenranta University of Technology, Lappeenranta, 2006.
- Bachmann F. G. and Russek U. A., “Laser welding of polymers using high power diode lasers,” in Photonics West 2002 Conference, San Jose, USA 21–25 Jan, 2002. [Proc. SPIE Vol. 4637B].
- Haberstroh E. and Hoffman W. M., “Laser transmission welding of transparent plastics parts in micro technology,” 4M Network of Excellence (2007), available at http://www.4m-net.org/files/papers/4M2007/364065/PID364065.pdf [cited 28/03/2011].
- Ussing T., Petersen L. V., Nielsen C. B., Helbo B., and Højslet L., Int. J. Adv. Manuf. Technol. 33, 198 (2007). 10.1007/s00170-007-0969-0 [DOI] [Google Scholar]
- Chen J.-W. and Zybko J., “Laser assembly technology for planar microfluidic devices,” SPE (Society of Plastics Engineers) 60th Annual Technical Conference, San Francisco (2002).
- Ylikotila J., Välimaa L., Takalo H., and Pettersson K., Colloids Surf., B 70, 271 (2009). 10.1016/j.colsurfb.2008.12.042 [DOI] [PubMed] [Google Scholar]


