

Abstract
MiR-145 is known as a tumor suppressor in numerous human cancers. However, its role in tumor angiogenesis remains poorly defined. In this study, we found that miR-145 was significantly downregulated in breast cancer tissues by using 106 cases of normal and cancer tissues as well as in breast cancer cells. MiR-145 exhibited inhibitory role in tumor angiogenesis, cell growth and invasion and tumor growth through the post-transcriptional regulation of the novel targets N-RAS and VEGF-A. In addition, we provide evidence that the expression levels of miR-145 correlate inversely with malignancy stages of breast tumors, although there is no association between miR-145 levels and hormone receptor levels in breast cancer. Taken together, these results demonstrate that miR-145 plays important inhibitory role in breast cancer malignancy by targeting N-RAS and VEGF-A, which may be potential therapeutic and diagnostic targets.
Keywords: angiogenesis, breast cancer, miR-145, N-RAS, VEGF-A
Introduction
Breast cancer is a prevalent carcinoma worldwide and, in women, has the second highest mortality rate after lung cancer.1 Despite advances in genetic and biochemical analyses, which have deciphered many specific molecular signatures, a deeper molecular basis of transformation is still unknown in this tumor.2-5 Recently, an increasing body of evidence has shown that deregulation of miRNAs is associated with cancer development.4,6-8 Among them, miR-145 has been found to function as a tumor suppressor in a variety of tumors, such as colorectal cancer, renal cancer, esophageal cancer, bladder cancer and also breast cancer.4,9-16 MiR-145 is downregulated in these tumors, and its overexpression could affect cell cycle, inhibit proliferation and induce apoptosis.17-19
MicroRNAs commonly carry out their functions by targeting specific downstream genes, either oncogenes or tumor suppressors. Recent studies have revealed some direct targets of miR-145, including fascin homolog 1 (FSCN1),9 mucin-1,20 RTKN,13 YES, STAT1,10 OCT4, SOX2, KLF4,21 epidermal growth factor receptor (EGFR), plasminogen activator inhibitor-1 (PAI-1)22 and nucleoside diphosphate linked moiety X-type motif 1 (NUDT1 or MTH1).23 Furthermore, a recent study has demonstrated the feedforward mechanism between miR-145 and the oncogenic Ras signaling, which means Ras activation leads to miR-145 repression, and miR-145 activates targets K-RAS and Ras-responsive element-binding protein (RREB1).24 Recent study has indicated that miR-145 can be negatively regulated by C/EBP β through AKT pathway.25 We found that p70S6K1 is also a direct target of miR-145 in regulating colon cancer growth and angiogenesis.14 Such evidences support the key role of miR-145 in tumorigenesis. However, more targets of miR-145 need to be elicited to unravel the complete mechanism.
Angiogenesis is one of the key characteristics of malignant tumor.26 A pathway including insulin-like growth factor I (IGF-I), insulin receptor substrate 1 (IRS1), Ras mediates vascular endothelial growth factor (VEGF) production, which is crucial in angiogenesis.27,28 Interestingly, IGF-I/IRS1 was found to be a predominant target of miR-145.29,30 Therefore, it is reasonable to speculate that miR-145 regulates the downstream genes of IGF-I/IRS1, including N-RAS and VEGF. However, it remains unclear to date whether these two genes are direct targets of miR-145 and whether miR-145 functionally affects angiogenesis. This study seeks to investigate the role of miR-145 in breast cancer. We find that miR-145 inhibits tumor angiogenesis and growth. In addition, we show that miR-145 is inversely correlated with the malignant stages of breast cancer.
Results
MiR-145 is downregulated in human breast cancer
A total of 23 miRNAs were found to be significantly disregulated between normal breast (NC) and breast cancer (BC) tissues by deep sequencing. The expression levels of most miRNAs were consistent between NC and BC (Slope = 1, R = 0.8627). Initially, we examined the signature of miR-145 in breast cancer samples (T) and their matched nonneoplastic (N) tissues (Fig. 1A). We found that miR-145 is highly expressed in NC and markedly repressed in BC tissues (Fig. 1B), suggesting its role as a tumor suppressor. Consistent with the results from breast cancer tissues, the expression levels of miR-145 were greatly downregulated in breast cancer cell lines (Fig. 1B).
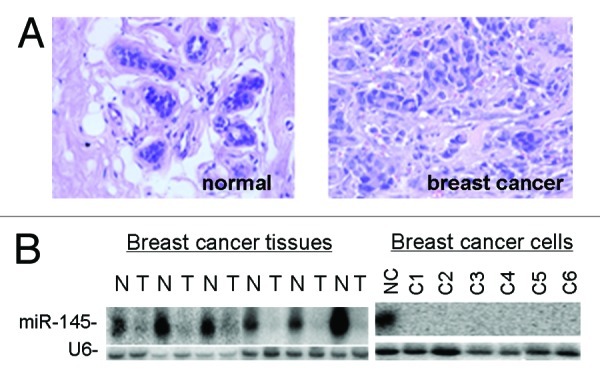
Figure 1. Downregulation of miR-145 in human breast cancer. (A) Pathological examination of normal breast tissues and breast tumor tissues using H/E staining. Normal breast tissue consisted with well-differentiated gland cells and milk ducts. Magnification: 200× . (B) Northern blot analysis shows that miR-145 is expressed at high levels in normal breast tissues (N) but at very low levels in breast cancer tissues (T, left panel) and breast cancer cell lines (right panel). C1 to C6 represent MCF7, ZR-75–30, T47D, MDA-453, MDA-435 and MDA-231 cells.
MiR-145 inhibits angiogenesis and invasion in vitro
Since angiogenesis and invasion are key characteristics of malignant tumor, we next investigated the effects of miR-145 on tumor angiogenesis and invasion in vitro. Tube formation assay using endothelial cells showed that miR-145-transfected HUVECs presented less tube length, indicating angiogenesis was suppressed (Fig. 2A). Simultaneously, cell invasion assay by Matrigel showed less invasive BC cells after miR-145 transfection (Fig. 2B). The viability of cells was not affected 72 h after the miR-145 transfection, indicating that the decreased invasion capacity by miR-145 overexpression was not due to the impairment of cell viability (Fig. 2C). As functional studies suggested the tumor suppressor role of miR-145, we subsequently examined the molecular markers of IRS1-N-RAS-VEGF pathway, the key pathway regulating tumor angiogenesis. As shown in Figure 2D, proteins in the pathway, including IRS1, N-RAS, PIK3CA, PIK3R1, AKT, p-AKT, mTOR, p70S6K1 and VEGF, were induced or activated in all of the six BC cell lines. Since miR-145 could repress angiogenesis, it is reasonable to speculate that miR-145 may target the IRS1-N-RAS-VEGF pathway to function as a tumor suppressor.

Figure 2. Effects of miR-145 on inhibiting angiogenesis and invasion in vitro. (A) Tube formation assay of HUVEC. A significant decrease was observed in the cells transfected with miR-145 precursor compared with the cells transfected with scrambled control (miR-scr). *p < 0.05. (B) Matrigel invasion assay of MCF7 and MDA-MB-231 cells transfected with miR-scr or miR-145 (×200). A significant decrease was observed in miR-145-transfected cells. *p < 0.05. **p < 0.01. (C) Cell viability was tested 72 h after transfection by trypan blue staining. (D) Immunoblotting analysis of genes involved in IRS1-N-RAS-VEGF pathway in breast cancer cell lines using antibodies against IRS1, N-RAS, PIK3CA, PIK3R1, AKT, p-AKT, mTOR, p70S6K1 and VEGFA. β actin level served as an internal control.
MiR-145 targets N-RAS and VEGF-A
To further understand molecular mechanism of miR-145 in inhibiting angiogenesis and cell invasion, we searched for potential targets of miR-145 using the in-lab developed algorithm KeyTar miRNA target prediction algorithm. We found that N-RAS and VEGF-A could be the potential targets of miR-145 (Fig. 3B). To validate these miR-145 targets, we established two cell lines stably expressing miR-145 from MCF7 and MDA-MB-231 cells by lentivirus transduction (Fig. 3A). Both luciferase activity assays and immunoblotting analysis in BC cells following lentivirus-miR-145 infection or miR-145 precursor transfection showed that overexpression of miR-145 repressed IRS1, N-RAS and VEGF-A, indicating miR-145 directly suppresses N-RAS and VEGF-A, the novel two targets and IRS1, the known target (Fig. 3B and C). The expression levels of VEGF were also decreased as confirmed by semi-quantitative RT-PCR (Fig. 3D) and ELISA analysis (Fig. 3E). Importantly, the miR-145-mediated repression of VEGF expression was reversed by re-expression of N-RAS, suggesting the pathway from miR-145 to N-RAS and further to VEGF is important (Fig. 3E).
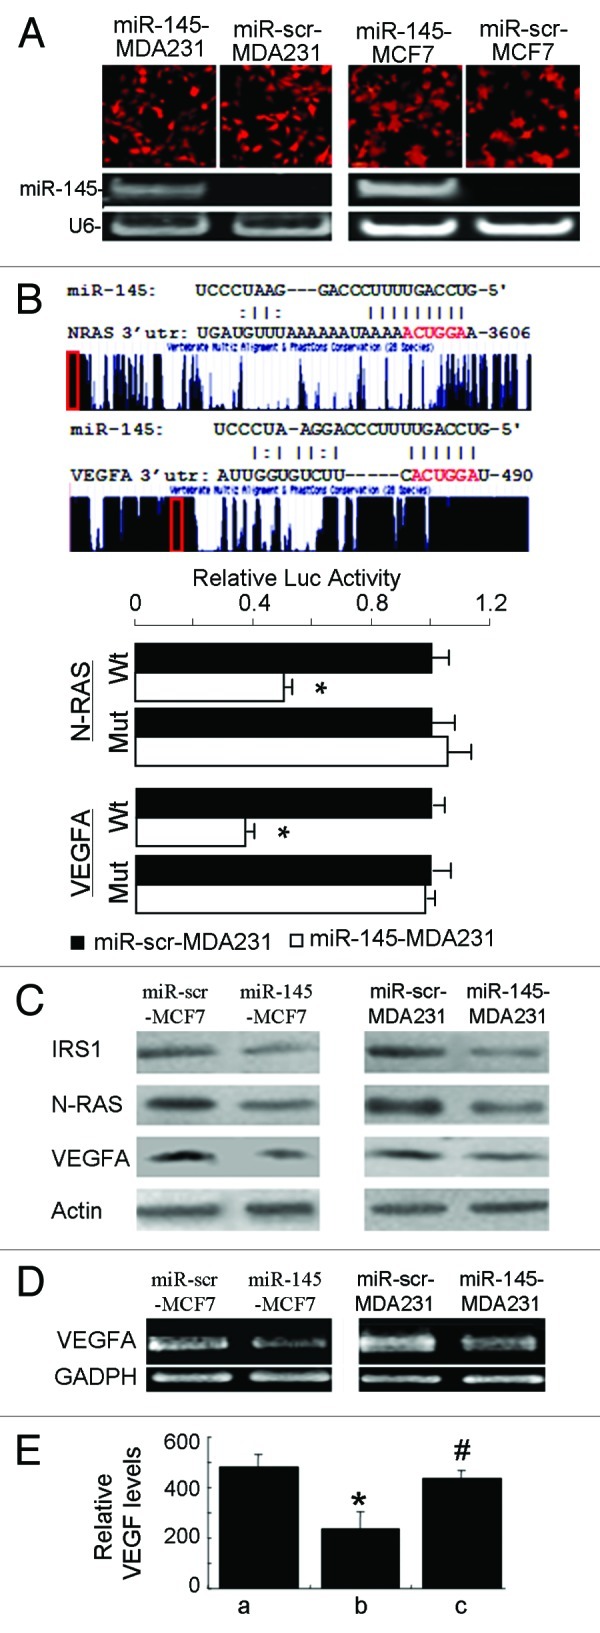
Figure 3. miR-145 targets N-RAS and VEGF-A. (A) Fluorescent images showed high transduction efficiency of lentivirus carrying miR-145 or miR-scr (upper panel). The miR-145 expression levels were detected by semi-quantitative RT-PCR (lower panel). (B) Schematic diagrams of putative miR-145 binding sites in the 3′UTRs of N-RAS and VEGF-A were shown in upper panel. The possible miR-145 binding sites in the 3′UTRs of the target genes were searched using algorithm KeyTar miRNA target prediction algorithm. The mutated nucleotides are shown in red. Luciferase activities of N-RAS and VEGFA reporter constructs in MDA-MB-231 cells transfected with miR-145 or miR-scr were normalized to cotransfected renilla luciferase plasmid activity (lower panel). *p < 0.05 (n = 3). Wt, miR-145 binding site wild type; Mut, miR-145 binding site mutant. (C) Immunoblotting analysis of IRS1, N-RAS and VEGF-A levels in lenti-miR-145 infected cells. (D) Semi-quantitative RT-PCR analysis for VEGF-A expression showed that it was significantly suppressed in lenti-miR-145- transduced MCF7 and MDA231 cells. GAPDH served as an internal control. (E) Forced expression of N-RAS reversed miR-145-inhibited VEGF expression. Relative VEGF levels were measured using ELISA in MCF7 cells infected by lenti-scr (a), miR-145 (b) and miR-145 with N-RAS plasmid (c) 48 h after transfection. * p < 0.01 (n = 3), b vs. a; #p < 0.01 (n = 3), c vs. b.
MiR-145 inhibits tumor growth and angiogenesis in vivo
To confirm the data obtained from in vitro studies, we then subcutaneously injected lentivirus-miR-scr- and lentivirus-miR-145-transduced MDA-MB-231 cells into nude mice. We found that miR-145 expression in breast cancer cells significantly reduced xenograft tumor growth and angiogenesis. At 20 d after subcutaneous injection, xenografts expressing miR-145 had smaller size and lower weight of tumors (Fig. 4A and B). Consistent with previous studies,31,32 we also showed that miR-145 overexpression inhibited cell proliferation (Fig. 4C), suggesting that miR-145 inhibited tumor growth via both anti-angiogenesis and anti-proliferation. Histological sections showed that xenografts derived from miR-145-transduced cells had lower levels of microvessel density (MVD) and proliferation rate detected using Factor VIII and PCNA antigen, respectively, than the negative control (Fig. 4D). Furthermore, quantitative MVD analysis and hemoglobin content assay showed significant suppression of microvascular density by miR-145 overexpression, confirming that miR-145 represses angiogenesis in MDA-MB-231 xenografts (Fig. 4E). In addition, significantly decreased levels of N-RAS, p-AKT, mTOR, HIF1-α and VEGFA were detected in miR-145-expressing xenografts (Fig. 4F). To further confirm the antitumor effect of miR-145, we used MCF-7 stably expression miR-145 or miR-scr to perform tumor growth assay. As shown in Figure 4G and H, similar results were obtained using MCF7 cells overexpressing miR-145. Taken together, these results suggest miR-145 inhibits tumor growth and angiogenesis in vivo through targeting N-RAS, VEGF-A and their downstream signaling molecules.

Figure 4. Inhibitory effect of miR-145 on tumor growth and angiogenesis in vivo. (A) Xenograft tumors obtained 20 d after subcutaneous injection of cancer cells. Bar = 2 mm. (B) Quantative analysis of weight and size of tumors (n = 5). (C) Cell proliferation rates of MDA231 cells infected with lenti-miR-scr or lenti-miR-145 were determined by counting cell number for 4 d. *p < 0.05. (D) Immunohistological analysis of tumor tissues using Factor VIII (×40). (E) Quantative microvascular density (MVD) analysis (left) and hemoglobin content level assay (right). The graph represents the mean ± SD from five different tumor sections. The data displayed significant difference of MVD and hemoglobin content between miR-145-MDA231 tumors and the negative control (p < 0.05), indicating miR-145 repressed angiogenesis in the tumors. (F) Immunoblotting analysis of the targets and key signaling molecules in the tumors using antibodies against N-RAS, p-AKT, mTOR, HIF1α and VEGF-A. (G) MiR-scr-MCF7 and miR-145-MCF7 stable cells were used to perform tumor growth assay as above. After 30 d, the tumors were photographed, measured and weighed. (H) Tumor weight and volumes of MCF7 xenografts were presented as mean ± SD (n = 6).
Overexpression of N-RAS in miR-145 expression xenografts rescues miR-145- inhibited tumor repression in vivo
To investigate in depth whether miR-145 inhibits tumor growth via N-RAS-dependent pathway, we subsequently conducted a series of in vitro and in vivo rescue experiments. N-RAS was successfully re-introduced into miR-145-overexpressed MDA-MB-231 cells. N-RAS re-expression could restore the expression of its downstream proteins, such as p-AKT and mTOR (data not shown). Re-introduction of N-RAS in miR-145-treated nude mice significantly reversed miR-145-suppressed tumor size and weight (Fig. 5A and B). In addition, re-expression of N-RAS also rescued tumor angiogenesis, which was suppressed by miR-145 overexpression as assessed by immunohistological staining using Factor VIII, quantitative MVD analysis and hemoglobin content assay (Fig. 5C and D). These results indicate the key role of N-RAS in miR-145-inhibited tumor growth and angiogenesis.
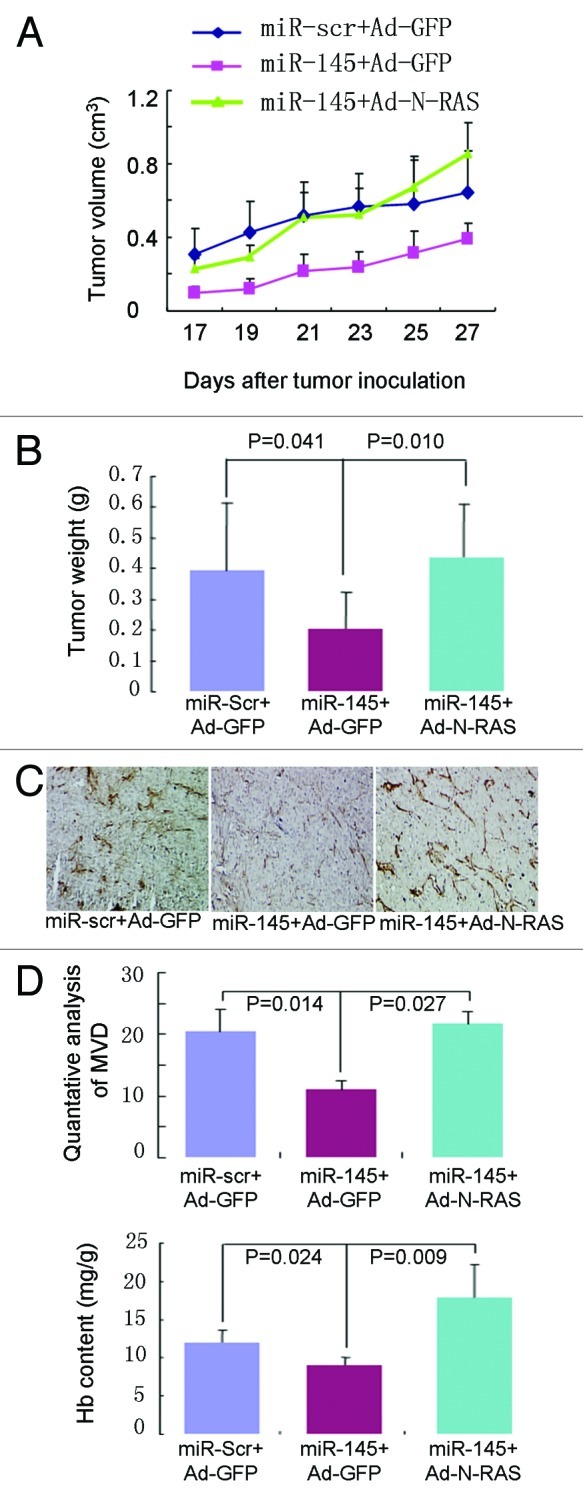
Figure 5. Forced expression of N-RAS rescues miR-145-inhibited tumor growth in vivo. (A and B) Tumor volumes (A) and weight (B) induced by MDA-MB-231 cells expressing lenti-scr and lenti-miR-145 with GFP or N-RAS were analyzed and presented as mean ± SD, n = 5. (C) Immunohistological analysis of microvessels in tumor sections using Factor VIII (×40). Overexpression of miR-145 (middle) inhibited microvessels formation when compared with the scrambled control (left); while re-expression of N-RAS (right) reversed microvessels formation suppressed by miR-145. (D) Quantitative MVD analysis (upper) and hemoglobin contents (lower) were analyzed using above tumors.
MiR-145 levels inversely correlate with malignancy stages in breast tumor
Finally, we examined the miR-145 expression levels in clinical specimens, including nondiseased individuals (n = 23), breast fibroadenoma (n = 10) and invasive ductal carcinoma (n = 73). MiR-145 expression levels were significantly lower in breast cancer tumor tissues compared with the normal tissues, with p = 0.0216 for benign tumor via normal and p < 0.0001 for malignant tumor via normal. Notably, malignant tumors had the lowest expression levels of miR-145 when compared with benign tumors, indicating that miR-145 levels inversely correlate with malignancy stages in breast tumor. However, there was no significant difference of miR-145 expression levels among different clinical stages of invasive ductal carcinoma. In addition, we examined the association between miR-145 expression levels and hormone receptor levels in breast cancer. No significant difference of miR-145 expression was found between estrogen receptor (ER)-positive (n = 46) vs. ER-negative (n = 27) breast cancers (p = 0.243). There was also no significant difference of miR-145 levels between progesterone receptor (PR)-positive and PR-negative tumors (n = 41 vs 32, p = 0.139). For human epidermal growth factor receptor 2 (HER2)-amplified and triple-negative breast cancer, we did not analyze the data due to the limited sample size.
Discussion
This study clearly demonstrates the inhibitory role of miR-145 in tumor angiogenesis and growth both in vitro and in vivo. In addition, we have provided evidence that the expression levels of miR-145 inversely correlate with malignancy stages of breast tumors, although there is no association between miR-145 expression levels and hormone receptor levels in breast cancer. To the best of our knowledge, this study is the first to directly link miR-145 to breast cancer angiogenesis and malignancy stages and indicates that miR-145 is of considerable diagnostic and therapeutic value in breast cancer.
Previous studies showed the apoptosis-inducing properties of miR-145 in a variety of cancer cell models, including colorectal cancer, esophageal cancer, bladder cancer and other tumors.10,12 In breast cancer, it is known that miR-145 activates caspase-3 and induces apoptosis in CAMA-1, MCF7 and MCF10A cells.13,20,32 MiR-145 is also found to be significantly underexpressed in the triple-negative primary breast cancers.33 Our study demonstrates that miR-145 exhibits an inhibitory role of in tumor angiogenesis. The link between miRNA and angiogenesis was first identified by Dews et al., showing that knockdown of miR-17–92 partly restored the expression of anti-angiogenic thrombospondin-1 (Tsp1) and miR-17–92-transduced cells formed larger, better-perfused tumors.34 Recent studies have further revealed miRNAs that contribute to tumor angiogenesis in vivo, such as miR-378, miR-296, miR-9, miR-519 and miR-107.35-39 Those miRNAs could directly target hypoxia-inducible factor 1 (HIF-1) and other angiogenesis-related genes and then regulate tumor vessel formation.38,39 Our study has identified miR-145 acts as an anti-angiogenesis factor both in vitro and in vivo. Therefore, miR-145 is an important tumor suppressor and could be a future therapeutic target.
Although some genes have previously been identified to be direct targets of miR-145, it is the first time that miR-145 has been shown to directly target N-RAS and VEGF-A. FCN1, an actin-binding protein that usually correlates with high-grade, extensive invasion, distant metastasis and poor prognosis in various tumors, was found to be a target of miR-145 in both esophageal squamous cell carcinoma12 and bladder cancer.9 Using microarray profiling upon miR-145 overexpression combined with seed site enrichment analysis, more targets were identified in colon cancer, including YES, FSCN1, ADAM17, BIRC2, VANGL1 as well as the transcription factor STAT1.10 In breast cancer, RTKN, estrogen receptor α (ER α) and mucin-1 are previously reported as the targets of miR-145.13 Overexpression of miR-145 in MCF-7 reduces RTKN expression, while downregulation of RTKN by siRNA can inhibit MCF-7 cell growth. Spizzo et al. found that miR-145 can inhibit ERα protein expression through direct interaction with two complementary sites within its coding sequence.32 More recently, a metastasis gene mucin 1 was identified to be involved in miR-145-mediated suppression of cell invasion and metastasis. Suppression of mucin-1 by RNAi attenuated the miR-145 action in suppression of invasion, while re-expression of mucin-1 enhanced cell invasion.20 Our recent study has shown that p70S6K1 is a direct target of miR-145 in colon tumor growth and angiogenesis.14 The present study has revealed more target genes of miR-145 in breast cancer, N-RAS and VEGF-A, indicating the complexed regulatory network of this miRNA in tumors. Previous studies have also identified IGF-I/IRS1 as direct targets of miR-145.29,30 Importantly, although most of miRNAs have multiple targets, miR-145 seems to affect its tumor suppressor activity predominantly by repressing IRS1, the docking protein of the IGF-IR.30 Our data have suggested that miR-145 also directly target N-RAS and VEGF-A, further enhancing knowledge about the miR-145-dependent network .
Finally, our results showed that the expression levels of miR-145 inversely correlated with malignancy stages of human breast tumors. MiR-145 expression was significantly downregulated in malignant tumors when compared with normal tissue or benign tumors. Such an expression pattern may identify malignant tumors from normal or benign tumors. Recently, some miRNAs have been shown to have potential value in diagnosis or prognosis of breast cancer. High levels of miR-21 expression were significantly correlated with advanced clinical stage, lymph node metastasis and poor survival of BC patients.40 We also found miR-195/497 expression levels were associated with tumor malignancy in breast cancer.41 As these miRNAs have unique expression profiles in cancerous tissues compared to normal tissues, and their expression is more stable than mRNA, miRNAs are very promising for application as diagnostic or prognostic biomarkers. Future work should focus on its clinical application. In summary, miR-145 suppresses tumor angiogenesis and growth due to targeting N-RAS and VEGF signaling. As it is inversely correlated with malignancy of breast tumors, miR-145 could also be used as a diagnostic marker of breast cancer.
Materials and Methods
Human tissue samples
Human breast tumor samples and normal tissues were obtained from Peking Union Medical College Hospital and Nanjing Medical University. All participants provided written informed consent following institutional review board approval at participating hospitals. Tissue samples were collected at surgery, immediately frozen in liquid nitrogen and stored until total RNAs or proteins were extracted. No patient information was used and identified in the study.
Histological examination
All tissues collected for histological examination were fixed in 4% paraformaldehyde for 12–36 h before being embedded in paraffin. Sections were cut at 4–6 μm thickness, stained with hematoxylin and eosin (H&E) and subjected to microscopic evaluation.
Cell culture
Human breast cancer cell lines MDA-MB-231, MDA-MB-435, MDA-MB-453, ZR-75–30, SK-BR-3, T47D and MCF 7 were obtained from ATCC. Cells were maintained in Dulbecco’s modified Eagle medium (DMEM) (MDA-MB-231, MDA-MB-435s, MDA-MB-453, T47D) or RPIM 1640 medium (ZR-75–30, SK-BR-3) supplemented with 10% fetal bovine serum (FBS) and 100 units of penicillin/ml and 100 μg of streptomycin/ml. MCF7 cells were maintained in MEM supplemented with 10% FBS, 0.01 mg/ml bovine insulin and penicillin/streptomycin. All cells were incubated at 37°C in a humidified chamber supplemented with 5% CO2.
In vitro invasion assay
MCF7 and MDA-MB-231 cells were transfected with miR-145 or a scrambled control precursors. Forty-eight hours after transfection, cells (5 104) were plated in the top chamber with polymerized collagen-coated membrane (24-well insert; pore size, 8 μm; Chemicon ECM551) in medium with 0.1% FBS. Complete medium was used as a chemoattractant in the lower chamber. The cells were left to incubate for 24 h, and unattached cells were removed cautiously by cotton swab. Cells that had invaded the lower surface of the membrane were stained with the Cell Stain Solution and counted accordingly. They were finally extracted and detected quantitatively using a standard microplate reader (at 560 nm).
Oligonucleotide transfection
Pre-miR-145 and Pre-miR™ miRNA precursor control were purchased from Ambion. Cells were transfected using Lipofectamine 2000 reagent (Invitrogen) 24 h after the plating. Transfection complexes were prepared according to the manufacturer’s instructions and added directly to the cells to a final concentration of 100 nM.
Cell viability and cell proliferation analyses
MCF7 and MDA-MB-231 cells were transfected with miR-145 or a scrambled control as above. After 72 h, aliquots of cell suspension were mixed with an equal amount of 0.4% (w/v) trypan blue solution (buffered with PBS) to identify permeabilized unviable cells. After 1 min incubation at room temperature, samples were observed using differential interference contrast (DIC) microscopy (DS-Ri1; Nikon Instruments). The number of surviving cells was estimated by counting cells without trypan blue staining with three replicates. MDA-MB-231 cells stably expressing miR-145 or miR-scr were trypsinized, counted and plated into 12-well plates at 1 × 10⁴ cells per well. Total cells were harvested and counted using hemocytometer once a day for 4 d with three replicates.
Northern blot analysis
RNA samples (25 μg each) were electrophoresed on 15% acrylamide and 8 M urea denatured gels and transferred onto Hybond N+ membrane (Amersham Biosciences). The membranes were baked at 80°C for 2 h before hybridization, then hybridized with oligo-nucleotide probes corresponding to the complementary sequences of the following mature miRNAs: miR-145, 5′- AGGGATTCCTGGGAAAACTGGAC-3′; U6: 5′-GCTAATCTTCTCTGTATCGT TCCAATTTT - 3′. Probes were 5-end labeled using the polynucleotide kinase in the presence of [γ-32P]ATP. Hybridization was performed at 41°C in ULTRAhyb™- Oligo Hybridization Buffer (Ambion) for 16 h. Membranes were washed at 42°C, three times with 2 × SSC with 0.1% SDS. Northern blots were rehybridized after stripping the oligo nucleotides used as probes in 1% SDS for 30 min at 65°C. Images were collected on a scanner Storm 860 (Molecular Dynamics).
MiRNA target prediction
miRNA target prediction was performed by an in-lab developed algorithm KeyTar. KeyTar miRNA target prediction is based on miRNA: target sequence, structure and function.
Real-time polymerase chain reaction assays for mature miRNAs
RNAs of tissue samples and cell lines were extracted using TRIzol (Invitrogen) according to manufacturer’s instructions. The expression levels of miR-145 were assayed using the primers designed by Biomics Company. Reverse transcription reaction was performed starting from 30 ng of total RNAs using 1 μM looped primers. Real-time PCR was performed using the standard SYBR Green Assays protocol on an MX3000p Real-Time PCR Detection System (Stratagene). The 25 μl PCR reaction included 2 μl reverse transcription product, 1× PCR Master mix (Takara) 1.5 μmol/L forward primer and 0.7 μmol/L reverse primer. The reactions were incubated in a 96-well plate at 95° for 10 sec followed by 40 cycles of 95° for 5 sec and 60° for 30 sec. The expression levels of U6 were used as endogenous control for each sample. The relative gene expression levels were calculated by comparing cycle times for target PCR using the following equation: relative gene expression = 2-(ΔCtsample-ΔCtcontrol).
Immunoblotting analysis
MCF7 and MDA-MB-231 cells were transfected with 100 nM of miR-145, or negative control precursors. Cells were collected 48 h after transfection for immunoblotting analysis. Total protein extracts (20 μg) were separated on SDS-PAGE gels and transferred to a PVDF membrane. Antibodies were incubated over night at 4°C, respectively. The antibodies used are as following: antibodies against mTOR (Bioworld Tec, diluted at 1:300), N-RAS (Santa Cruz, diluted at 1:200), VEGF-A (diluted at 1:600), IRS1 (CST, diluted at 1:200), PIK3CA (CST, diluted at 1:300), PIK3R1 (CST, diluted at 1:300), AKT (CST, diluted at 1:300), p-AKT (CST, diluted at 1:500), HIF1-α (CST, diluted at 1:300), p70S6K1 (CST, diluted at 1:500) and β-actin (Sigma, diluted at 1:5000). AP-conjugated secondary antibody was incubated for 2 h at room temperature. The corresponding bands were detected using BCIP/NBT (Ameresco). Band signals were quantified with Labworks Instrument software (UVP).
Lentivirus preparation, titration and transduction
Virus soup was obtained by the transfection of HEK293T cells with pLemiR-145 or pLemiR-scrambled control (pLemiR-scr) and packaging mix stock (Open Biosystems) using Arrest-In transfection reagent (Open Biosystems). The virus-containing supernatants were collected 48 and 72 h after transfection, passed through 0.45 µm filters and aliquoted as virus stocks. For virus titration, the diluted virus was added to HEK293T cells in 24-well tissue culture plate and incubated at 37°C for 4 h. Then, the transduction mix was removed and fresh medium was added. After infection for 48 h, the RFP expressing cells were counted, and the transducing units per ml (TU/ml) were determined. For virus infection, cells were incubated at 37°C with virus stocks supplemented with polybrene (8 µg/ml) for 6 h. After 2 d of selection, pooled puromycin-resistant cells were expanded for further analysis.
Adenovirus preparation, titration and infection
Adenoviruses carrying N-RAS were generated and prepared using the AdEasy system. In brief, N-RAS cDNA fragment was obtained from the plasmid pcmv6-xl5-N-RAS (OriGene Technologies, Inc.) via restriction enzyme digestion and subcloned into pAdtrack-CMV shuttle vector. Then pAdtrack-CMV-N-RAS was linearized with Pme I followed by homologous recombination with bone plasmid pAdEasy-1 in BJ5183 cells to generate recombinant plasmid pAd-N-RAS. pAd-N-RAS was digested with Pac I and transfected into Ad-293 cells by lipofectamine to package recombinant adenovirus. The titers of the prepared adenoviruses of Ad-N-RAS and Ad-GFP (as control) were measured with the aid of green fluorescence protein (GFP) expression after multiplication and purification. For function assays, miR-scr-MDA-MB-231 (miR-scr-MDA231) and miR-145-MDA-MB-231 (miR-145-MDA231) cells were infected with Ad-GFP or Ad-N-RAS at 25 MOI.
Luciferase activity assay
The 3′-UTR of human N-RAS genes was amplified by PCR using the following primers:
forward primer 5′-GAATTCATTGCTCCAACGGCTTACT-3′;
reverse primer 5′-CTCGAGCCAACACTTCCAAATGTCA-3′ and the fragment was cloned into the EcoRI and XhiI sites of the modified pGL3-Control vector (Promega) to generate pGL3- N-RAS vector. The 3′-UTR of human VEGF gene was amplified by PCR using the following primers:
forward primer 5′-GAATTCGCTCAGATGTGACAAGCCG-3′;
reverse primer 5′-CTCGAGGGACATCTGCCAGTGGTCT-3′ and cloned into the EcoRI and XhoI sites of the modified pGL3-Control vector. The nucleotide-substitution mutations were performed using PCR-based methods for the 3′-UTRs of N-RAS and VEGF. Primers were used were as follows:
Mut 3′-UTR of N-RAS: 5′-TTGACCTAGTTCTTGGCTTAGTCATAA-3′ and 5′-TTTATTTTTTAAACATCATTTAACAAG-3′;
Mut 3′-UTR of VEGF: 5′-GACCTAGTATTTGACTGCTGTGGAC-3′ and 5′-TGAAGACACCAATAACATTAGCACT-3′. All constructs were sequence verified. The underlined nucleotides indicate the bases where mutations were made. For luciferase assays, cells were cultured in 24-well plates and transfected with 100 ng of reporter plasmid together with 5 ng of pRL-TK vector (Promega), expressing the Renilla luciferase and 50 pmoles of miR-145 or a miRNA negative control of precursor. Transfection was performed using Lipofectamine 2000 (Invitrogen) as described by the manufacturer. After 36 h transfection, firefly and renilla luciferase activities were measured using the Dual-Luciferase Reporter Assay (Promega). Each transfection was repeated twice in triplicate.
Animal care and tumor implantation
All research involving animals complied with protocols approved by the Nanjing Medical University and ECNU Committee on Animal Care. For in vivo tumor growth assay, six-week-old female nude mice [BALB/cA-nu (nu/nu)] were purchased from Shanghai Experimental Animal Center (Chinese Academy of Sciences) and maintained in pathogen-free conditions with standard diets. The MDA-MB-231 cells stably expressing miR-145 or miR-scr transduced by Ad-GFP or Ad-N-RAS (1.0 × 10⁶ cells in 50 μl) were injected into nude mice with the same volume of Matrigel. Mice were sacrificed and the xenografts were trimmed out at the time indicated. For MCF7 cells stably expressing miR-145 or miR-scr, the tumors were collected after 30 d. Tumor volumes were measured and calculated according to the formula (width2 × length)/2. Hemoglobin levels were measured using a Drabkin's reagent kit according to the manufacturer's instructions. The concentrations of hemoglobin were calculated based on a set of hemoglobin standards.
Immunohistochemical examination
Tumor tissues were fixed in Bouin's solution and embedded in paraffin. Tumor sections at 5 µm were cut and deparaffinized and antigen was retrieved using microwave. After incubation with hydrogen peroxide, the sections were washed, blocked for 1 h with 10% goat serum in 1 × PBS buffer and incubated with a 1:50 dilution of rabbit anti-factor VIII antibodies (Biocare Medical) in a humid chamber at 4°C for 16 h. After washing, the slides were incubated with HRP-conjugated goat anti-rabbit IgG for 2 h. The antibody signals were detected using DAB regent. Different sections were prepared from five tumors and the number of microvessels was counted in five different fields per section as follows: slides were first scanned under low power (100×) to determine three “hotspots” or areas with the maximum number of microvessels and then the positive stained blood vessels in the selected areas were analyzed at 400× magnification. Sections incubated with the preimmune IgG were used as the negative control.42
Statistical analysis
The results are expressed as mean S.E, or SD as specifically indicated. Group data comparisons were performed using analysis of variance followed by Dunnett’s method using Microsoft Excel. A two-tailed p < 0.05 was considered as statistically significant. The Mann–Whitney test was used to compare depot-specific differences between cancer tissues and normal controls. The correlation of miR-145 levels with cancer stages was analyzed using the Spearman's correlation coefficient test. (Fig. 6)
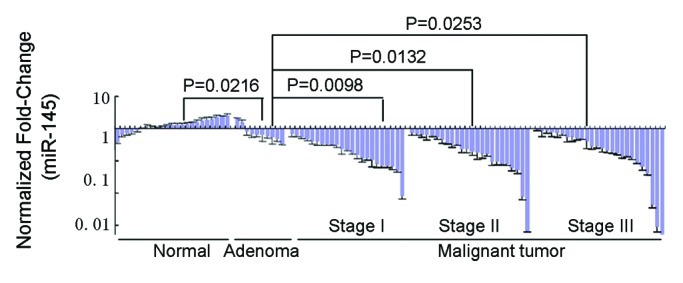
Figure 6. Quantitative RT-PCR analysis of miR-145 levels in normal tissues from nondiseased individuals (n = 23); adenoma, breast fibroadenoma (n = 10) and invasive ductal carcinoma tissues (n = 73) with U6 rRNA as a loading control. MiR-145 levels inversely correlate with malignancy in human breast tumors analyzed using the Spearman's correlation coefficient test.
Disclosure of Potential Conflicts of Interest
No potential conflicts of interest were disclosed.
Financial Support
This work was supported in part by the National Key Basic Research Program of China (2011CB504003), by National Natural Science Foundation of China (81071642), by State High Technology Developing Project (2008AA02Z115), the Key Programs of National Science Foundation of China (30430240), by Shanghai Metropolitan Fund for Research and Development (04DZ14005 and 04JC14096) and by National Cancer Institute, NIH Grant CA109460.
Footnotes
Previously published online: www.landesbioscience.com/journals/cc/article/20598
References
- 1.Mohinta S, Wu H, Chaurasia P, Watabe K. Wnt pathway and breast cancer. Front Biosci. 2007;12:4020–33. doi: 10.2741/2368. [DOI] [PubMed] [Google Scholar]
- 2.Demidov ON, Kek C, Shreeram S, Timofeev O, Fornace AJ, Appella E, et al. The role of the MKK6/p38 MAPK pathway in Wip1-dependent regulation of ErbB2-driven mammary gland tumorigenesis. Oncogene. 2007;26:2502–6. doi: 10.1038/sj.onc.1210032. [DOI] [PubMed] [Google Scholar]
- 3.Gregorieff A, Clevers H. Wnt signaling in the intestinal epithelium: from endoderm to cancer. Genes Dev. 2005;19:877–90. doi: 10.1101/gad.1295405. [DOI] [PubMed] [Google Scholar]
- 4.Iorio MV, Ferracin M, Liu CG, Veronese A, Spizzo R, Sabbioni S, et al. MicroRNA gene expression deregulation in human breast cancer. Cancer Res. 2005;65:7065–70. doi: 10.1158/0008-5472.CAN-05-1783. [DOI] [PubMed] [Google Scholar]
- 5.Simin K, Wu H, Lu L, Pinkel D, Albertson D, Cardiff RD, et al. pRb inactivation in mammary cells reveals common mechanisms for tumor initiation and progression in divergent epithelia. PLoS Biol. 2004;2:E22. doi: 10.1371/journal.pbio.0020022. [DOI] [PMC free article] [PubMed] [Google Scholar]
- 6.Ambros V. The functions of animal microRNAs. Nature. 2004;431:350–5. doi: 10.1038/nature02871. [DOI] [PubMed] [Google Scholar]
- 7.Lu J, Getz G, Miska EA, Alvarez-Saavedra E, Lamb J, Peck D, et al. MicroRNA expression profiles classify human cancers. Nature. 2005;435:834–8. doi: 10.1038/nature03702. [DOI] [PubMed] [Google Scholar]
- 8.Miska EA. How microRNAs control cell division, differentiation and death. Curr Opin Genet Dev. 2005;15:563–8. doi: 10.1016/j.gde.2005.08.005. [DOI] [PubMed] [Google Scholar]
- 9.Chiyomaru T, Enokida H, Tatarano S, Kawahara K, Uchida Y, Nishiyama K, et al. miR-145 and miR-133a function as tumour suppressors and directly regulate FSCN1 expression in bladder cancer. Br J Cancer. 2010;102:883–91. doi: 10.1038/sj.bjc.6605570. [DOI] [PMC free article] [PubMed] [Google Scholar]
- 10.Gregersen LH, Jacobsen AB, Frankel LB, Wen J, Krogh A, Lund AH. MicroRNA-145 targets YES and STAT1 in colon cancer cells. PLoS One. 2010;5:e8836. doi: 10.1371/journal.pone.0008836. [DOI] [PMC free article] [PubMed] [Google Scholar]
- 11.Hidaka H, Seki N, Yoshino H, Yamasaki T, Yamada Y, Nohata N, et al. Tumor suppressive microRNA-1285 regulates novel molecular targets: aberrant expression and functional significance in renal cell carcinoma. Oncotarget. 2012;3:44–57. doi: 10.18632/oncotarget.417. [DOI] [PMC free article] [PubMed] [Google Scholar]
- 12.Kano M, Seki N, Kikkawa N, Fujimura L, Hoshino I, Akutsu Y, et al. miR-145, miR-133a and miR-133b: Tumor-suppressive miRNAs target FSCN1 in esophageal squamous cell carcinoma. Int J Cancer. 2010;127:2804–14. doi: 10.1002/ijc.25284. [DOI] [PubMed] [Google Scholar]
- 13.Wang S, Bian C, Yang Z, Bo Y, Li J, Zeng L, et al. miR-145 inhibits breast cancer cell growth through RTKN. Int J Oncol. 2009;34:1461–6. [PubMed] [Google Scholar]
- 14.Xu Q, Liu LZ, Qian X, Chen Q, Jiang Y, Li D, et al. MiR-145 directly targets p70S6K1 in cancer cells to inhibit tumor growth and angiogenesis. Nucleic Acids Res. 2012;40:761–74. doi: 10.1093/nar/gkr730. [DOI] [PMC free article] [PubMed] [Google Scholar]
- 15.Nohata N, Sone Y, Hanazawa T, Fuse M, Kikkawa N, Yoshino H, et al. miR-1 as a tumor suppressive microRNA targeting TAGLN2 in head and neck squamous cell carcinoma. Oncotarget. 2011;2:29–42. doi: 10.18632/oncotarget.213. [DOI] [PMC free article] [PubMed] [Google Scholar]
- 16.Qu C, Liang Z, Huang J, Zhao R, Su C, Wang S, et al. MiR-205 determines the radioresistance of human nasopharyngeal carcinoma by directly targeting PTEN. Cell Cycle. 2012;11:785–96. doi: 10.4161/cc.11.4.19228. [DOI] [PMC free article] [PubMed] [Google Scholar]
- 17.Ostenfeld MS, Bramsen JB, Lamy P, Villadsen SB, Fristrup N, Sørensen KD, et al. miR-145 induces caspase-dependent and -independent cell death in urothelial cancer cell lines with targeting of an expression signature present in Ta bladder tumors. Oncogene. 2010;29:1073–84. doi: 10.1038/onc.2009.395. [DOI] [PubMed] [Google Scholar]
- 18.Lai VK, Ashraf M, Jiang S, Haider K. MicroRNA-143 is a critical regulator of cell cycle activity in stem cells with co-overexpression of Akt and angiopoietin-1 via transcriptional regulation of Erk5/cyclin D1 signaling. Cell Cycle. 2012;11:767–77. doi: 10.4161/cc.11.4.19211. [DOI] [PMC free article] [PubMed] [Google Scholar]
- 19.Cirera-Salinas D, Pauta M, Allen RM, Salerno AG, Ramírez CM, Chamorro-Jorganes A, et al. Mir-33 regulates cell proliferation and cell cycle progression. Cell Cycle. 2012;11:922–33. doi: 10.4161/cc.11.5.19421. [DOI] [PMC free article] [PubMed] [Google Scholar]
- 20.Sachdeva M, Mo YY. MicroRNA-145 suppresses cell invasion and metastasis by directly targeting mucin 1. Cancer Res. 2010;70:378–87. doi: 10.1158/0008-5472.CAN-09-2021. [DOI] [PMC free article] [PubMed] [Google Scholar]
- 21.Xu N, Papagiannakopoulos T, Pan G, Thomson JA, Kosik KS. MicroRNA-145 regulates OCT4, SOX2, and KLF4 and represses pluripotency in human embryonic stem cells. Cell. 2009;137:647–58. doi: 10.1016/j.cell.2009.02.038. [DOI] [PubMed] [Google Scholar]
- 22.Villadsen SB, Bramsen JB, Ostenfeld MS, Wiklund ED, Fristrup N, Gao S, et al. The miR-143/-145 cluster regulates plasminogen activator inhibitor-1 in bladder cancer. Br J Cancer. 2012;106:366–74. doi: 10.1038/bjc.2011.520. [DOI] [PMC free article] [PubMed] [Google Scholar]
- 23.Cho WC, Chow AS, Au JS. MiR-145 inhibits cell proliferation of human lung adenocarcinoma by targeting EGFR and NUDT1. RNA Biol. 2011;8:125–31. doi: 10.4161/rna.8.1.14259. [DOI] [PubMed] [Google Scholar]
- 24.Kent OA, Chivukula RR, Mullendore M, Wentzel EA, Feldmann G, Lee KH, et al. Repression of the miR-143/145 cluster by oncogenic Ras initiates a tumor-promoting feedforward pathway. Genes Dev. 2010;24:2754–9. doi: 10.1101/gad.1950610. [DOI] [PMC free article] [PubMed] [Google Scholar]
- 25.Sachdeva M, Liu Q, Cao J, Lu Z, Mo YY. Negative regulation of miR-145 by C/EBP-β through the Akt pathway in cancer cells. Nucleic Acids Res. 2012 doi: 10.1093/nar/gks324. Epub ahead of print. [DOI] [PMC free article] [PubMed] [Google Scholar]
- 26.Grothey A, Galanis E. Targeting angiogenesis: progress with anti-VEGF treatment with large molecules. Nat Rev Clin Oncol. 2009;6:507–18. doi: 10.1038/nrclinonc.2009.110. [DOI] [PubMed] [Google Scholar]
- 27.Jiang ZY, He Z, King BL, Kuroki T, Opland DM, Suzuma K, et al. Characterization of multiple signaling pathways of insulin in the regulation of vascular endothelial growth factor expression in vascular cells and angiogenesis. J Biol Chem. 2003;278:31964–71. doi: 10.1074/jbc.M303314200. [DOI] [PubMed] [Google Scholar]
- 28.Stearns M, Tran J, Francis MK, Zhang H, Sell C. Activated Ras enhances insulin-like growth factor I induction of vascular endothelial growth factor in prostate epithelial cells. Cancer Res. 2005;65:2085–8. doi: 10.1158/0008-5472.CAN-04-4100. [DOI] [PubMed] [Google Scholar]
- 29.Shi B, Sepp-Lorenzino L, Prisco M, Linsley P, deAngelis T, Baserga R. Micro RNA 145 targets the insulin receptor substrate-1 and inhibits the growth of colon cancer cells. J Biol Chem. 2007;282:32582–90. doi: 10.1074/jbc.M702806200. [DOI] [PubMed] [Google Scholar]
- 30.La Rocca G, Shi B, Badin M, De Angelis T, Sepp-Lorenzino L, Baserga R. Growth inhibition by microRNAs that target the insulin receptor substrate-1. Cell Cycle. 2009;8:2255–9. doi: 10.4161/cc.8.14.9026. [DOI] [PubMed] [Google Scholar]
- 31.Götte M, Mohr C, Koo CY, Stock C, Vaske AK, Viola M, et al. miR-145-dependent targeting of junctional adhesion molecule A and modulation of fascin expression are associated with reduced breast cancer cell motility and invasiveness. Oncogene. 2010;29:6569–80. doi: 10.1038/onc.2010.386. [DOI] [PubMed] [Google Scholar]
- 32.Spizzo R, Nicoloso MS, Lupini L, Lu Y, Fogarty J, Rossi S, et al. miR-145 participates with TP53 in a death-promoting regulatory loop and targets estrogen receptor-alpha in human breast cancer cells. Cell Death Differ. 2010;17:246–54. doi: 10.1038/cdd.2009.117. [DOI] [PMC free article] [PubMed] [Google Scholar]
- 33.Radojicic J, Zaravinos A, Vrekoussis T, Kafousi M, Spandidos DA, Stathopoulos EN. MicroRNA expression analysis in triple-negative (ER, PR and Her2/neu) breast cancer. Cell Cycle. 2011;10:507–17. doi: 10.4161/cc.10.3.14754. [DOI] [PubMed] [Google Scholar]
- 34.Dews M, Homayouni A, Yu D, Murphy D, Sevignani C, Wentzel E, et al. Augmentation of tumor angiogenesis by a Myc-activated microRNA cluster. Nat Genet. 2006;38:1060–5. doi: 10.1038/ng1855. [DOI] [PMC free article] [PubMed] [Google Scholar]
- 35.Lee DY, Deng Z, Wang CH, Yang BB. MicroRNA-378 promotes cell survival, tumor growth, and angiogenesis by targeting SuFu and Fus-1 expression. Proc Natl Acad Sci USA. 2007;104:20350–5. doi: 10.1073/pnas.0706901104. [DOI] [PMC free article] [PubMed] [Google Scholar]
- 36.Würdinger T, Tannous BA, Saydam O, Skog J, Grau S, Soutschek J, et al. miR-296 regulates growth factor receptor overexpression in angiogenic endothelial cells. Cancer Cell. 2008;14:382–93. doi: 10.1016/j.ccr.2008.10.005. [DOI] [PMC free article] [PubMed] [Google Scholar]
- 37.Ma L, Young J, Prabhala H, Pan E, Mestdagh P, Muth D, et al. miR-9, a MYC/MYCN-activated microRNA, regulates E-cadherin and cancer metastasis. Nat Cell Biol. 2010;12:247–56. doi: 10.1038/ncb2024. [DOI] [PMC free article] [PubMed] [Google Scholar]
- 38.Cha ST, Chen PS, Johansson G, Chu CY, Wang MY, Jeng YM, et al. MicroRNA-519c suppresses hypoxia-inducible factor-1alpha expression and tumor angiogenesis. Cancer Res. 2010;70:2675–85. doi: 10.1158/0008-5472.CAN-09-2448. [DOI] [PubMed] [Google Scholar]
- 39.Yamakuchi M, Lotterman CD, Bao C, Hruban RH, Karim B, Mendell JT, et al. P53-induced microRNA-107 inhibits HIF-1 and tumor angiogenesis. Proc Natl Acad Sci USA. 2010;107:6334–9. doi: 10.1073/pnas.0911082107. [DOI] [PMC free article] [PubMed] [Google Scholar]
- 40.Yan LX, Huang XF, Shao Q, Huang MY, Deng L, Wu QL, et al. MicroRNA miR-21 overexpression in human breast cancer is associated with advanced clinical stage, lymph node metastasis and patient poor prognosis. RNA. 2008;14:2348–60. doi: 10.1261/rna.1034808. [DOI] [PMC free article] [PubMed] [Google Scholar]
- 41.Jiang BH, Zheng JZ, Aoki M, Vogt PK. Phosphatidylinositol 3-kinase signaling mediates angiogenesis and expression of vascular endothelial growth factor in endothelial cells. Proc Natl Acad Sci USA. 2000;97:1749–53. doi: 10.1073/pnas.040560897. [DOI] [PMC free article] [PubMed] [Google Scholar]
- 42.Li D, Zhao Y, Liu C, Chen X, Qi Y, Jiang Y, et al. Analysis of MiR-195 and MiR-497 expression, regulation and role in breast cancer. Clin Cancer Res. 2011;17:1722–30. doi: 10.1158/1078-0432.CCR-10-1800. [DOI] [PubMed] [Google Scholar]